Abstract
Local delivery of drugs to the inner ear has the potential to treat inner ear disorders including permanent hearing loss or deafness. Current mathematical models describing the pharmacokinetics of drug delivery to the inner ear have been based on large rodent studies with invasive measurements of concentration at few locations within the cochlea. Hence, estimates of clearance and diffusion parameters are based on fitting measured data with limited spatial resolution to a model. To overcome these limitations, we developed a noninvasive imaging technique to monitor and characterize drug delivery inside the mouse cochlea using micro-computed tomography (μCT). To increase the measurement accuracy, we performed a subject-atlas image registration to exploit the information readily available in the atlas image of the mouse cochlea and pass segmentation or labeling information from the atlas to our μCT scans. The approach presented here has the potential to quantify concentrations at any point along fluid-filled scalae of the inner ear. This may permit determination of spatially dependent diffusion and clearance parameters for enhanced models.
Keywords: Computed tomography, Image registration, Automatic segmentation, Drug delivery, Pharmacokinetics, Inner ear, Mouse, Cochlea
INTRODUCTION
Local delivery of drugs to the inner ear has the potential to treat inner ear disorders including sudden sensorineural hearing loss and genetic diseases. Developing novel therapeutics and delivery systems to the inner ear have therefore become the center of attention over the past several decades.19,35
A difficulty facing the development of local therapeutic protocols is lack of reliable data on the pharmacokinetics of drugs due to the existing challenges in direct measurement of drug concentration in the inner ear. Hence, significant efforts have been made to estimate longitudinal and radial distributions of drugs using computer simulations.25,28 These simulations have also been used to interpret published data on drug concentration measurements in the chinchilla and guinea pig cochlea.24,26
The currently available experimental data on large rodents, obtained using direct measurement techniques, are either based on using ion-selective microelectrodes,31 or taking fluid samples from the basal or apical turns of the cochlea.2,17,22,30 These procedures are invasive, can influence concentration of drugs in the inner ear, have limitations on spatial resolution, and are not applicable to animals with smaller size (like mice) which are of special interest due to the established information on their genetic make-up.
Indirect methods, based on functional assessment of hearing, have also been proposed in the literature to evaluate drug pharmacokinetics inside the cochlea. These methods include distortion product otoacoustic emissions (DPOAE),4 auditory brainstem response (ABR),7 and compound action potential (CAP) measurements.4,21 These indirect measures assume the physiological response is proportional to the intracochlear drug concentration and that cochlear hair cell sensitivity is uniform from base to apex.4,20 While qualitatively useful to evaluate different infusion protocols, these techniques provide only estimates of the spatiotemporal concentration profiles within the inner ear.
To overcome the limitations associated with the methods described above, developing quantitative noninvasive measurement techniques is of special interest to the hearing research community. To this end, magnetic resonance imaging has been used for qualitative23,40 and semi-quantitative14 assessment of gadolinium distribution in the inner ear of humans and large rodents (like guinea pigs). In order to obtain higher resolution images, we used micro-computed tomography (μCT) and developed a fully-quantitative noninvasive technique to monitor and characterize drug delivery inside the mouse cochlea. Computed tomography has been used in a wide range of noninvasive monitoring applications,3,13,36,39 but it has not been used to directly image drug delivery to the inner ear of any animals, including mice.
The physical basis for CT image formation is the differential attenuation of photons in body tissue characterized by linear attenuation coefficients which produces subject contrast in CT images.8 Often times, contrast agent compounds with relatively high attenuation coefficients are used in CT imaging experiments to improve visibility. In the present investigation, ioversol, an iodine based contrast agent, was used for this purpose. By establishing a correlation between image intensity (which is directly proportional to attenuation) and ioversol concentration, we quantified inner ear drug delivery concentrations over time for a fixed infusion protocol.
Despite the relatively high resolution of the experimental μCT images, identification of intracochlear structures, especially the membranes between different fluid-filled scalae, is not easily and accurately possible using only the information available in these scans. Therefore, we used a subject-atlas image registration to exploit the information readily available in the atlas image and passed segmentation or labeling information from the atlas to the subject image, i.e., our μCT scans.
Atlas-based image registration and segmentation has become very popular in biomedical engineering in recent years.1,10,16,27 Image registration is a technique with the purpose of finding a spatial relationship, also called mapping, between two or more images with similar or different image modalities.15 Once a mapping between the images is found, the labeling of one image (the atlas image) can be mapped to the other image (the subject image); i.e., the subject image can be automatically segmented using an already-labeled atlas image.
The mouse cochlea database (MCD) of Santi et al.32 was used for atlas-based image registration and segmentation in this work. MCD is a complete database in which all histological sections of mouse inner ear have been manually segmented and labeled. It includes 2D atlas images and 3D reconstruction images of the inner ear of two different mouse strains (CBA and C57BL6 Col4A5) obtained using orthogonal plane fluorescence optical sectioning (OPFOS) microscopy.
In this work we present an approach to noninvasively monitor and quantify concentrations at any point along the fluid-filled scalae of the inner ear (scala tympani (ST), scala vestibuli (SV), and scala media (SM)) during inner ear delivery of a contrast agent. This approach has the potential to enhance existing models of cochlear fluid flow by permitting extraction of spatially dependent diffusion and clearance parameters in the mouse and other rodent model systems.
Surgical procedures and drug delivery systems for μCT imaging are described in section “Surgical Procedures and Imaging Experiment.” Image processing techniques for registration, segmentation, and quantification of spatio-temporal drug concentrations are presented in section “Image Processing and Data Extraction Techniques,” and results from live animal in vivo scans are illustrated and discussed in section “Results and Discussion.” Finally, section “Conclusions” concludes the paper.
SURGICAL PROCEDURES AND IMAGING EXPERIMENT
Animals and Surgical Procedures
Young adult (age 3–6 months) CBA/CaJ mice, bred and raised in-house, were used for this study. All animal experiments were approved by the University of Rochester Committee on Animal Resources, and were performed using accepted veterinary standards. The surgical approach was identical to that described by Borkholder et al.4 Briefly, animals were deeply anesthetized with a mixture of ketamine/xylazine (120 and 10 mg/kg body weight, respectively, intraperitoneal injection (IP)), and the left ventral surface of the neck was shaved and cleaned. The animal was positioned on a heated operative plane on their back under aseptic conditions. Surgery was performed on the left (ipsilateral) ear. Under an operating microscope, an incision was made longitudinally along the ventral surface of the neck, extending from the angle of the mandible to the level of the clavicle. The submandibular gland was retracted laterally to expose the digastric muscle that was cut with an electrocautery to expose the bony tympanic bulla and the stapedial artery. The stapedial artery was carefully lifted from the surface of the bulla and cauterized at the entrance to the bulla with care taken to minimize cochlear heating. The surrounding tissue was removed to expose the inferior-medial aspect of the bulla which was carefully cleaned and dried. A cochleostomy was drilled by hand at a location approximately 300 μm below the stapedial artery stump using 175 μm diameter carbide micro drills modified to include insertion stops. Sequentially longer insertion depth 175 lm bits were used (153 and 178 lm), with cochlear entry determined by a subtle change in mechanical resistance.
Using a micromanipulator (MM3–3, World Precision Instruments, Sarasota, FL), a fine metal probe and adhesive (3M Repositionable 75 spray adhesive) loosely attaching the polyimide infusion tubing to the probe, the infusion tubing was inserted into the cochleostomy. Medical grade adhesive (Loctite 4206, Rocky Hill, CT) was used to temporarily secure the infusion tubing to the bulla opening, with subsequent application of dental cement (3M ESPE Durelon, St. Paul, MN) providing a more permanent and robust bond, sealing the cannula to cochleostomy site. The surgery site was loosely sutured closed for this acute experiment to provide strain relief for the infusion tubing. During surgery, mice remained immobilized by anesthesia as described above, with supplementary doses ( of the initial dose) administered as needed to maintain the proper levels of general anesthesia. Parameters such as foot or tail pinch, palpebral reflex, and respiratory rate were monitored to indicate the need for supplemental doses.
The mice were transferred to a custom mouse holder (described below) for transport to the μCT machine. While in the scanner, anesthesia was maintained with continuous flow of isoflurane.
Drug Infusion System and Solutions
Artificial perilymph (AP) and ioversol solutions were delivered to the basal turn of ST through a 30–40 cm length of US Pharmacopoeia Class VI polyimide tubing (044-I; ID 110 μm; OD, 139 μm; Microlumen, Tampa, FL). The infusion tubing was connected to a 25 μL Hamilton syringe (1702 RNR 22S/2”) using a PEEK nanotight fitting (Upchurch Scientific, Oak Harbor, WA). The syringe was mounted in a syringe pump (UMP2, World Precision Instruments, Sarasota, FL) allowing precise control of infusion rates. The syringe pump was powered from an inverter running on a 12 V battery to permit continuous infusion during surgery and transport to the μCT scanner. A schematic illustration of the infusion setup is shown in Fig. 1.
FIGURE 1.
Syringe based system for intracochlear infusions. AP precedes the contrast agent (ioversol) to allow for visualization of cochlear anatomy in initial μCT scans. OD: outer diameter.
The volume of the infusion tubing was sufficient to contain the initial AP and subsequent ioversol solutions. The syringe was carefully filled with AP, with all trapped air removed via repeated rapid aspiration and ejection. The infusion tubing was then connected and filled via syringe ejection. Defined volumes of solution and air were then preloaded into the infusion tubing through aspiration of AP, air, ioversol, air, and AP. 1700–2000 nL of ioversol were preceded by the initial 1800 nL of AP providing ample volume for in-surgery continuous infusion, transport to the μCT scanner, and an initial scan with no contrast agent. The inclusion of ~10 nL air bubbles between solutions avoided within-tube diffusion. The tubing tip was left immersed in AP until being attached to the micromanipulator immediately prior to drilling the cochleostomy hole. At this time, infusion at 16 nL/min was started to ensure that evaporation at the tubing tip did not incorporate an air bubble of variable and uncontrolled size. Infusion continued during insertion of the cannula tube and the gluing process. The flow rate was kept constant at the fixed rate of 16 nL/min during the infusion process. The AP solution was mixed with a composition (in mM) of: NaCl, 120; KCl, 3.5; CaCl2, 1.5; glucose, 5.5; and HEPES buffer, 20.6 The pH was adjusted to 7.5 with NaOH and the solution filter sterilized and stored for later use. The ioversol solution (Optiray 300) was used at stock strength 300 mg/mL organically bound iodine.
Continuous Infusion and Impacts on Hearing Function
The total volume of ST and SV are reported to be approximately 320 and 300 nL, respectively.38 In this experiment, the total volume exchange through infusion of AP and contrast agent was approximately 3800 nL, based on a 237 min long infusion at a fixed flow rate of 16 nL/min. While this volume is large compared to that of the perilymph, a continuous infusion at the basal turn of ST with no fluidic exit hole results in excess fluid being pushed through the cochlear aqueduct into the cranial subarachnoid space with diffusion as the dominant mechanism for carrying pharmaceutical agents to the apical turns.4,5 Figure 2 depicts the theoretical flow conditions inside the cochlea for the cochleostomy infusion method.
FIGURE 2.
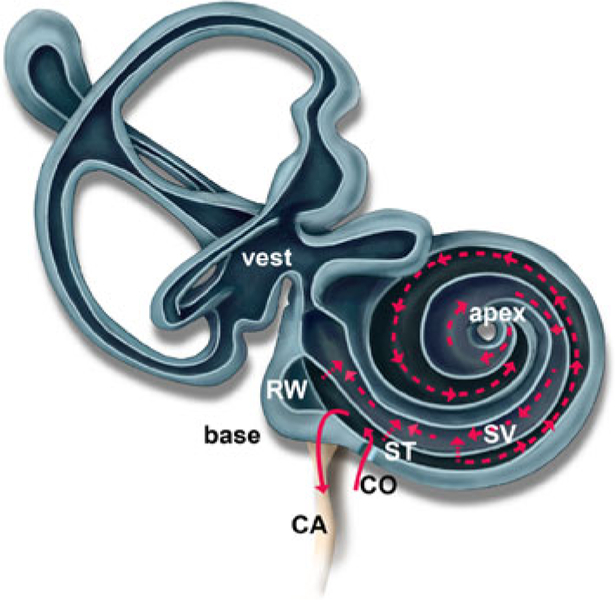
Theoretical flow path within the cochlea and vestibular system for the cochleostomy drug infusion approach. Pressure driven flow is depicted with solid lines and diffusion is depicted with dotted lines. The infusion approach results in pressure driven outflow through the CA and diffusion-driven transport from base to apex and between scala. CO: cochleostomy.
This approach is advantageous since having no effluent hole in the cochlea reduces the probability of damage to the delicate structures of the inner ear.5 While assessment of hearing function was not part of this work, the protocols employed are consistent with those previously described by Borkholder et al.4 where they were shown to have no impact to acute hearing function.
μCT Imaging
A Scanco Medical VivaCT40 μCT scanner was used in these experiments. Image stacks of 212 slices focused on the cochlea and vestibular system were obtained with 15 × 15 × 15 μm voxel size. Each full scan took 13.2 min to complete. The mouse holder was placed inside the lCT machine and a low resolution scout view was obtained to position the 3.18 mm high resolution scan window in the region of the cochlea. Scans were continuously done with the infused volume manually recorded from the syringe pump display at the start of each scan. Scans were continued through delivery of the entire volume of ioversol. Image files for each scan were saved in uint16 DICOM format from the Sanco system and were used for further image processing.
A custom mouse holder (Fig. 3) was designed to ensure consistent orientation of collected images. The mouse holder ensured proper orientation of the cochlea relative to the rotating scanner within the μCT machine by using a bite bar and ear bars to attain three points of contact between the skull and holding device. The use of the mouse holder also eliminated motion artifacts that could impact the image processing steps described in the next section. Finally, the holder provided for correct placement of the isoflurane delivery system to maintain the plane of anesthesia during scanning.
FIGURE 3.
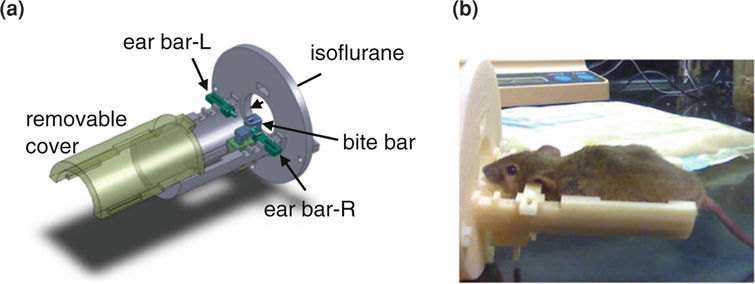
(a) Illustration of custom μCT mouse holder created in SolidWorks. The bite bar and ear bars allow for three points of contact between the holder and the animal, and ensure proper orientation. Isoflurane anesthesia delivered through circular opening at the front of the holder. (b) Photograph of CBA mouse in μCT holder, cover removed.
A total of 12 animals were used in this study to develop the new cochlear imaging techniques introduced in the present study; with variable survival times. Data from one animal was fully analyzed in the subsequent sections to demonstrate the potential utility of this new methodology for quantifying inner ear drug delivery.
IMAGE PROCESSING AND DATA EXTRACTION TECHNIQUES
Pixel Intensity vs. Concentration Characterization
To determine the concentration of contrast agent present throughout the cochlea as a result of the intracochlear infusion, a relationship between pixel intensities extracted from the μCT images and the concentration of contrast agent must be established. To this end, plastic tubes containing eight different known concentrations of ioversol, ranging from 0 to 225 mg/mL, were used as imaging phantoms to evaluate the correlation between pixel intensity and concentration (with μCT imaging parameters identical to those used in the animal experiments). Figures 4a and 4b show the imaging phantoms together with their corresponding concentrations.
FIGURE 4.
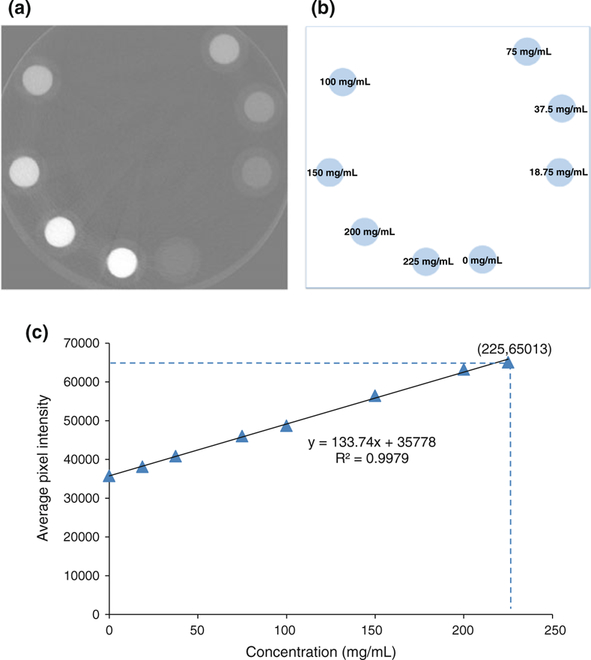
(a) Imaging phantoms of different known concentrations of ioversol. (b) The corresponding concentration levels of ioversol. (c) Linear regression of average pixel intensity vs. concentration. The μCT images were saved in uint16 DICOM format. Note that the concentration level of 225 mg/mL has an intensity very close to the saturation limit of 65,532.
A circular region of interest (ROI) of 80-pixel diameter was selected within each image phantom, and the average and standard deviation of pixel intensities were calculated inside each ROI. Average pixel intensities were then plotted vs. the ioversol concentration and linear regression was used to model the relationship between them. The result of regression is shown in Fig. 4c. As shown in the figure, the coefficient of determination R2 = 0.9979, which indicates a strong linear relationship between pixel intensity and concentration.
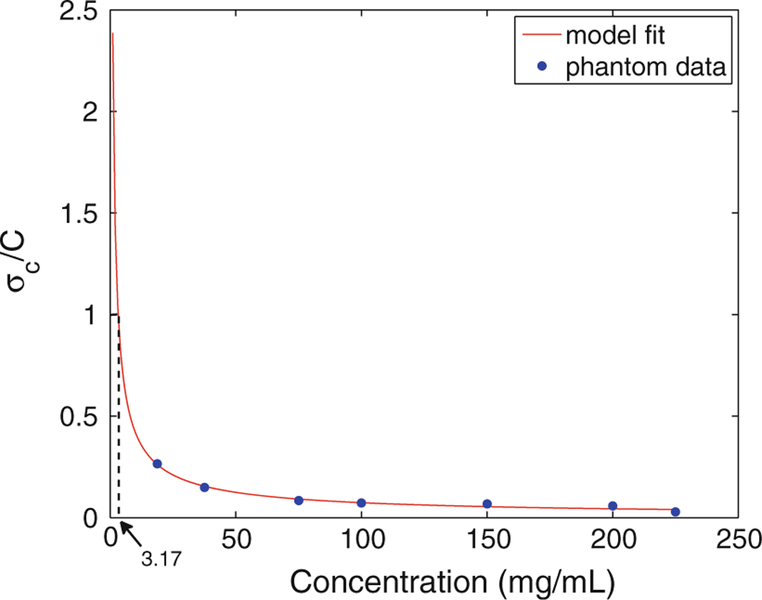
The imaging phantoms were also used to measure the sensitivity of the μCT machine. For this, we adopted a method similar to Szymanski-Exner et al.36; first, the standard deviation of ioversol concentration, denoted by σc, was calculated by converting the measured standard deviation of pixel intensities for each circular ROI. Then, the ratio of noise to concentration was plotted vs. ioversol concentration and a power curve axb was fitted to the data points to estimate the sensitivity cutoff, which as defined in Szymanski-Exner et al.,36 is the concentration at which . Figure 5 shows the calculated sensitivity cutoff of the μCT imaging experiment to be close to 3.17 mg/mL; hence, any changes in ioversol concentration less than this amount must be treated as noise.
FIGURE 5.
The ratio of noise to concentration vs. ioversol concentration. A power model axb (the red line) was fitted to the data points. The sensitivity cutoff is estimated to be around 3.17 mg/mL.
After successful segmentation of μCT images, described in the subsequent sections, small circular regions of 7-pixel diameter were selected at the center of the cross section of each scala (circular regions were selected to account for the statistical noise inherent in μCT images) and the mean pixel intensities were measured inside the selected ROIs. The baseline pixel intensity values, corresponding to the background values with no contrast agent in the cochlea, were then subtracted from the measurements to account for the bone and tissue absorptions. Finally, the conversion value of obtained from the linear regression model (shown in Fig. 4c) was used to calculate the mean ioversol concentration at the desired locations and at different time points during the infusion. Note that choosing a smaller ROI would affect the accuracy of measurements, hence at each image slice, pixel intensities of scalae with very small cross sections were not included in the measurements.
Atlas Image Slicing and Morphometry
In order to better find correspondence between the two image stacks, the atlas image was resampled to have the same thickness (15 μm) as the μCT image slices. The atlas image volume was also virtually resliced to generate a stack of 2D images with the same orientation as the μCT image stack. For this purpose, an initial guess was made using the relative position of the stapes and the oval window as landmarks to approximate the orientation of the atlas image; the final reslicing orientation was then found through an iterative process by comparing the resliced image stack and the μCT stack at each step. The atlas label image was also resliced and resampled along the same orientation to generate a stack of 2D label images. Hence, each 2D atlas image slice has a corresponding label image where desired cochlear structures are out-lined using different colors. All the reslicing and resampling steps were done in AMIRA (Visage Imaging, San Diego, CA) which is a commercial software for diagnostic image processing.
Figure 6 shows the set of the μCT image slices (first column) together with their corresponding atlas images (second column) and label images (third column) that were selected for the rest of the analysis. The set of images were selected such that they contain cross sections of cochlear structures at the basal, middle, and apical turns of the cochlea. Hence, concentration measurements can be done at different locations along ST and SV.
FIGURE 6.
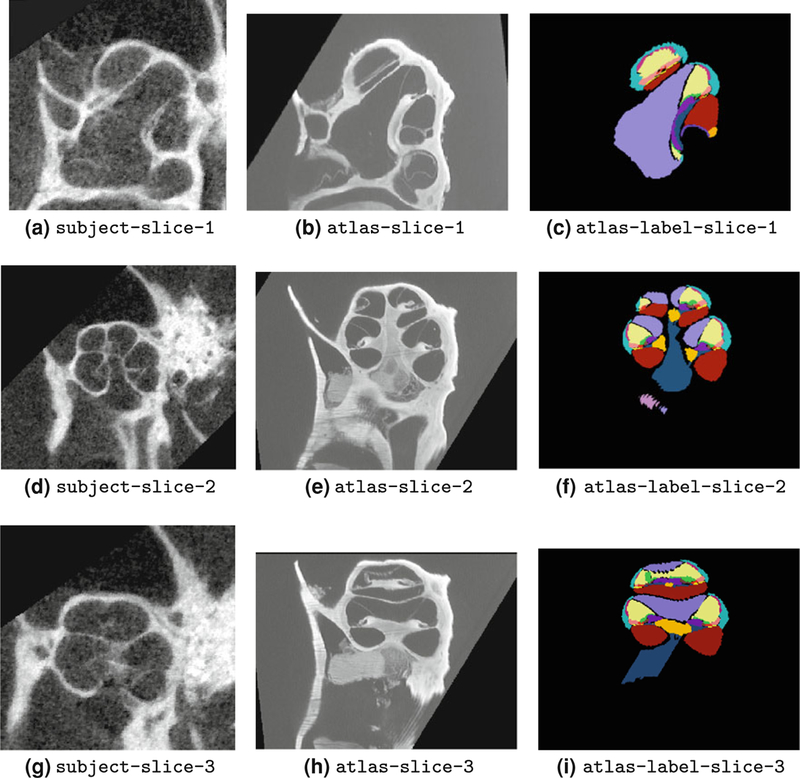
First column: subject (μCT) image slices of mouse cochlea. These are the set of 2D image slices selected for monitoring and measurement of contrast agent concentration over the time course of ioversol infusion to the inner ear. Second column: corresponding atlas images acquired by OPFOS imaging. Note that finer structures are apparent in the atlas images. Third column: corresponding atlas label images. Each cochlear structure is labeled with a different color; e.g., ST, SV, and SM are labeled with red, violet, and light yellow, respectively.
In order to have a complete set of measurements, we not only need to segment the μCT image slices, which is described in the next section, but also must calculate the approximate distance of cochlear structures from a starting point, chosen to be the location of the round window (RW). For this purpose, we again made use of the one-to-one correspondence between the μCT and atlas image slices and found the location of each atlas slice in Fig. 6 with respect to the 3D isosurface reconstruction of ST in the atlas image. The distance was then measured by fitting a B-spline curve to the curved structure of ST and calculating the relative distance of each slice from the RW. This process was also done in AMIRA using the isosurface reconstruction images of Santi et al.32 Figure 7 is a set of snapshots taken from AMIRA showing the relative distance of cochlear structures in the selected image slices (Fig. 6) with respect to ST.
FIGURE 7.
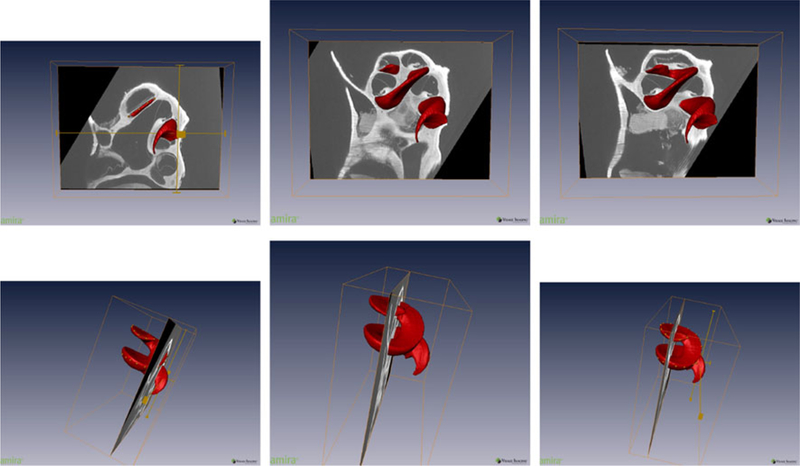
Snapshots of AMIRA showing the relative location of atlas image slices of Fig. 6 along ST (the red curved structure). First column shows the front and side view of atlas-slice-1 image; similarly, the second column and the third column show the front and side view of atlas-slice-2 and atlas-slice-3, respectively. B-spline control points were used to approximate ST as a curve and measure distance along ST. This helps find the relative distance of points inside each cross section (shown in Fig. 6) from the base of ST.
Image Registration and Segmentation
In registration, one image, referred to as the moving image is deformed to fit the other image, called the fixed image. This deformation is mathematically defined as a mapping from the fixed image domain to the moving image domain.
Let Im(·) and If(·) denote the mathematical representation of the moving image and the fixed image, respectively. Both Im and If are of dimension d ∈ {2, 3}. Registration is the problem of finding a transformation T that makes Im(T(·)) spatially aligned to If (·). This can be formulated as the following optimization problem
| (1) |
where is the cost function representing a distance measure, or equivalently a negated similarity measure, between the two images. The minimization is with respect to T and the optimal solution, denoted by T*, is
| (2) |
Based on Eq. (2), there are three elements involved in the registration process of two images If(·) and Im(·); the transformation T, the similarity (or distance) measure, and the optimization method.
The set of different mappings T can be chosen from a certain set of parametric or nonparametric functions.9,15 The parametric transformations are further divided into rigid, affine, and nonrigid transformations.
Rigid and affine transformations are both linear transformations and compensate for translation, rotation, and isotropic scaling (in affine transformation) mismatches between the two images. They are mainly used for intra-subject registration when there is no or little distortion between the images. Furthermore, affine transformation is often used as an initial estimate for nonrigid registration to capture the global displacement of both images.27
Nonrigid transformation, on the other hand, is nonlinear and is mainly used for inter-subject image registration to account for inter-subject variability. Different types of basis functions (e.g., spline and wavelet functions) and different physical based models are used to model nonrigid transformations.11
Different choices have also been proposed literature to measure similarity of two images,18,33,37 out of which the mutual information (MI) is a very general and powerful measure and can be applied to images with different image modalities.18 In this work, we used a slightly different version of MI, called normalize mutual information (NMI), which is shown to provide better results over a range of image registration problems.34
To perform image registration, we used a registration software called elastix15 which is built upon the Insight Toolkit (ITK)12 and is a publicly available software for intensity-based image registration.
The registration scheme in this work had two steps; we started with an affine registration to adjust the images and compensate for translation, rotation, and scaling mismatches between the μCT image and its corresponding atlas image. The resulting image was then used as an initial estimate for the nonrigid registration. The class of B-spline polynomials were used for the nonrigid registration step.
In both registrations, the NMI measure was chosen as the similarity measure and the Gradient Descent method was used for solving the optimization problem (1). Also, note that in each registration we chose the μCT image as the fixed image If and the atlas image as the moving image Im. One obvious reason for this choice is that μCT images must stay undeformed for further processing and intensity measurements.
The resulting coordinate transformation T* was then applied to the corresponding label image of Im, denoted by Lm, to automatically segment the μCT image. For this purpose, we used another command line driven program called transformix (like elastix, large parts of transformix is based on ITK12). The reader is referred to Klein et al.15 for more information about implementing registration and segmentation techniques using elastix and transformix.
A subset of μCT images together with their corresponding atlas images selected for subject-atlas image registration was previously shown in Fig. 6. As can be seen in the figure, the bony structure of tympanic bulla is not present in the atlas images; this is because the cochlea was harvested before the OPFOS imaging. In order to restrict registration to the cochlea and remove the effects of the surroundings, we used binary masks for μCT images during the image registration process.
RESULTS AND DISCUSSION
Results
Figure 8 shows the final segmentation results. In each row, the leftmost image is the resulting label image. For visual validation of segmentation results, label images are overlaid on their corresponding μCT images, and their contrast fades in from the left to the right.
FIGURE 8.
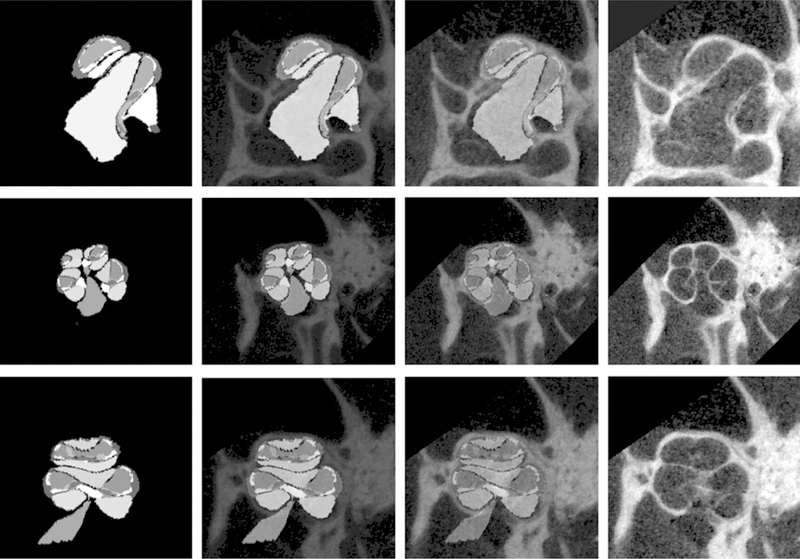
Final segmentation results for the selected set of μCT images shown in Fig. 6. First row: subject-label-slice-1 overlaid on subject-slice-1 image; second row: subject-label-slice-2 overlaid on subject-slice-2 image; third row: subject-label-slice-3 overlaid on subject-slice-3 image. In each row, the leftmost image is the resulting label image. Label images are overlaid on their corresponding μCT slice images, and their contrast fades in from the left to the right.
After successful segmentation of μCT images, pixel intensities were measured at desired locations inside the mouse cochlea. The conversion of measured intensity values to their corresponding concentration levels was described earlier in section “Pixel Intensity vs. Concentration Characterization.”
Figure 9 illustrates a μCT image slice at different time points during the infusion of contrast agent. As shown in the figure, mean pixel intensities increase as more ioversol reaches ST and SV.
FIGURE 9.

subject-slice-2 μCT image (cropped) at different time points during the infusion of ioversol. This image slice shows the mid-modiolar cross section of the cochlea. ST and SV are specified in (a) with red and violet dotted lines, respectively. The effect of ioversol contrast agent in changing pixel intensities along ST and SV is apparent from the images. The slow rate of change in image brightness is consistent with the theoretical flow path shown in Fig. 2 where diffusion is the dominant mechanism for carrying contrast agent to the middle and apical turns.
Figure 10 illustrates the ioversol concentration along ST and SV as a function of distance from the RW, and for different time points during the infusion process. Note that in all plots distance is expressed as the fraction of length of ST from the RW; this is consistent with the 1D model of Salt28 where the uncoiled scalae are assumed to be parallel compartments. As shown in the plots, the ioversol concentration is maximum near the cochleostomy site (approximately at 10% distance from the RW), and it declines in the rest of the ST with a high basal-to-apical concentration gradient. This is consistent with the theoretical flow path shown in Fig. 2 and previous infusion modelings presuming a pressure-driven outflow through the CA and describing diffusion as the dominant mechanism for drug propagation along and between different compartments.4,25 Ioversol also reaches SV by radial communication between ST and SV, which can be described by diffusion through spiral ligament and SM,25 as well as by direct communication at the apical regions of ST and SV through the helicotrema. The measurement results also confirm the existence of both communication paths, radial communication path through diffusion and direct path at the apex, between ST and SV.
FIGURE 10.
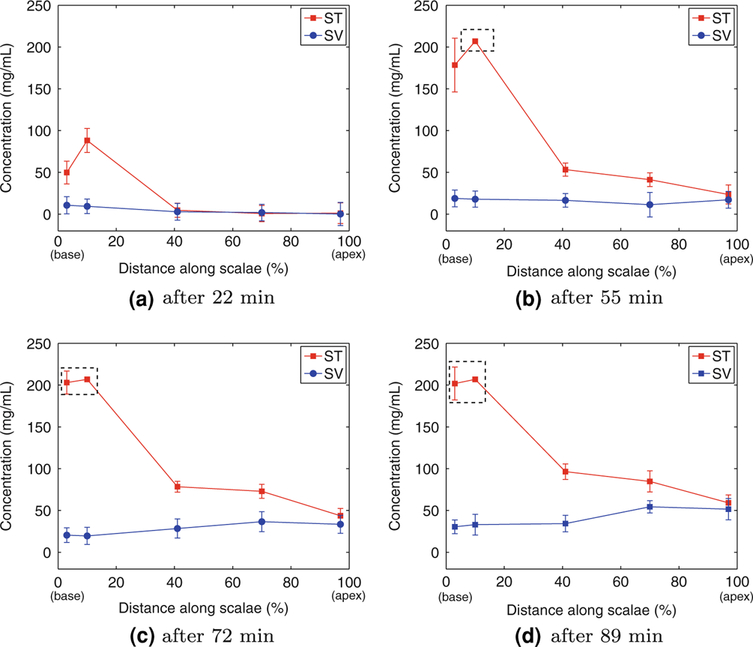
Comparison of ioversol concentration levels along ST and SV in one animal after (a) 22 min, (b) 55 min, (c) 72 min, and (d) 89 min of the continuous infusion of ioversol. The concentration levels were calculated from average pixel intensities of selected ROIs inside the three μCT image slices of Fig. 6. Error bars represent the standard deviation of concentration levels inside the selected ROIs. Note that distance is expressed as the fraction of length of ST (from RW). The dashed rectangles in (b), (c), and (d) highlight points that have reached the saturation limit.
Concentration profiles of Fig. 10 resemble results of Salt and Ma,31 where concentration profiles of trimethylphenylammonium (TMPA), applied to perilymph by irrigation of the intact round window membrane, were calculated through numerical modeling and computer simulation. The results are specifically similar in the middle and apical turns of ST which are diffusion-limited regions under both delivery scenarios. The final results also resemble the results of Bork-holder et al.4 where drug concentration profiles, infused through ST via cochleostomy at the base of the cochlea, were measured using DPOAE threshold shifts.
Discussion
As the measurement results indicate, the approach presented here has the potential to quantify concentrations at all points in the cochlear fluid-filled scalae. This may permit determination of spatially dependent diffusion and clearance parameters for enhanced models.
Due to the statistical noise inherent in the images, pixel intensities must be averaged inside a (circular) ROI around a selected location; this puts an upper bound on the spatial resolution of the measurement technique. The spatial resolution is determined by the size of the selected ROI and the image voxel size. In this work, we used 7-pixel diameter circular regions for measuring pixel intensities. Therefore, the spatial resolution of the noninvasive measurement technique was approximately 7 × 15 μm. The size of the ROI is proportional to the amount of noise in the images, but there are no closed form relations between the two.
The final data points of Fig. 10 were measured from the set of μCT image slices shown in Fig. 6. Within each image slice, issues regarding image noise did not allow accurate measurement of pixel intensities inside compartments with very small cross sections (less than 7 pixels in diameter), and those measurements were not included in the final measurement results.
There was a 2–7% uncertainty in all the concentration levels plotted in Fig. 10, which was due to the existing noise in the μCT images and was calculated from the standard deviation of pixel intensities measured inside the selected ROIs.
Contrast agent was used in this μCT imaging experiment to improve visibility and monitor drug propagation inside the mouse cochlea. The concentration level of the infused contrast agent must be chosen such that it is easily detectable (i.e., it is beyond the sensitivity cutoff of the CT machine), and at the same time it does not pass the saturation limit of the machine; otherwise, some part of the information would be lost. In this work, we opted to allow saturation at the basal end, where concentrations were likely to approach the infused concentration, to enhance our ability to visualize concentrations in more apical regions; therefore, the final results passed the saturation limit at few instances. The concentration of the infused ioversol must be reduced to have more accurate measurements along different scalae in future experiments.
Scanning parameters such as X-ray tube current, voltage, and slice thickness affect the amount of statistical noise in CT scans as well as the sensitivity cutoff of the contrast agent detection. Having access to the image acquisition site, these parameters can be adjusted systematically to decrease image noise and increase the detection sensitivity and spatial resolution of the imaging technique.
As mentioned earlier, this method has the potential to perform measurements at any location inside the cochlea and has a relatively high spatial resolution compared to more invasive methods such as with implanted ion selective electrodes or direct sampling. In the 2D approach, image registration can be performed between each μCT slice and its corresponding atlas slice allowing concentrations to be measured at any arbitrary point along each compartment; this, however, requires multiple registration steps. Having access to the 3D μCT image, 3D subject-atlas registration can be performed. While image masking and registration parameter determination become more challenging in the 3D approach, it will facilitate rapid extraction of concentrations at each point within the cochlea and reaching the full potential of the technique in terms of spatial resolution. 3D registration will be investigated in our upcoming future work.
The accuracy of segmentation can be increased by using statistical shape models (SSM) or multi-atlas label fusion techniques to account for inter-subject anatomic variability. These techniques are based on having several atlas images of different specimens with high resolution that are manually segmented with high accuracy. Implementation and evaluation of these techniques are also left for future work.
Finally it is important to note that until now, all of the direct methods proposed for studying the pharmacokinetics of drugs and quantification of drug concentration inside the inner ear have been based on either using contrast agents in noninvasive imaging as in this work, or monitoring ionic markers with implanted electrodes and direct fluid sampling. All of these methods rely on infusion of a target marker that is easily quantified and can be used to determine distribution characteristics and membrane properties.
In order to generalize the results to therapeutic drugs, different factors affecting diffusion coefficients of drugs and the partition coefficients of membranes inside the cochlea must be understood. Aside from the structure of tissues and environment properties, like viscosity of perilymph and endolymph, the main factors that affect these parameters are molecular size and polarity of the drug. Although the effect of molecular size can be compensated easily in the diffusion coefficients, the role of polarity requires more investigation.
Other factors, such as the background medium of the drug-containing solution, osmolarity, pH, and ionic composition have also been mentioned in the literature that may affect drug transport and penetration through membranes inside the cochlea.29 Devising hybrid monitoring approaches based on covalent attachment of contrast agents with therapeutic drugs may be a possible route to further study the effects of different drugs in the future.
CONCLUSIONS
In this work we developed a noninvasive imaging technique to monitor and characterize drug delivery inside the mouse cochlea using μCT. Live animal scanning was performed during intracochlear delivery of the contrast agent ioversol and its concentration was measured at different time points and locations during the infusion process. This was done by establishing a linear correlation between image intensity and ioversol concentration. To identify intracochlear structures with higher precision, we used a subject-atlas image registration for automatic segmentation of the μCT images.
The final measurement results indicate the feasibility of using μCT imaging to noninvasively extract spatially dependent intracochlear concentrations and quantify drug delivery inside the inner ear in vivo. Future work will leverage this capability to explore details of pharmacokinetic processes that are difficult to examine with existing techniques.
ACKNOWLEDGMENTS
This work was supported in part by NIH Grants from the National Institute on Deafness and other Communication Disorders (K25-DC008291), the National Institute on Aging (P01 AG009524), and the Schmitt Foundation. We thank Dr. Peter Santi for providing access to the mouse cochlea data base. We also thank Mr. Mike Thullen for his technical support in μCT imaging. The help of Dr. Stefan Klein with the elastix software and the help of the AMIRA support team are gratefully acknowledged.
ABBREVIATIONS
- μCT
Micro-computed tomography
- ABR
Auditory Brainstem Response
- AP
Artificial perilymph
- CA
Cochlear aqueduct
- CAP
Compound Action Potential
- CSF
Cerebrospinal fluid
- DPOAE
Distortion product otoacoustic emissions
- IP
Intraperitoneal injection
- MCD
Mouse cochlea database
- MI
Mutual information
- NMI
Normalized mutual information
- OD
Outer diameter
- OPFOS
Orthogonal plane fluorescence optical sectioning
- ROI
Region of interest
- RW
Round window
- SM
Scala media
- SSM
Statistical shape models
- ST
Scala tympani
- SV
Scala vestibuli
- TMPA
Trimethylphenylammonium
REFERENCES
- 1.Aljabar P, Heckemann RA, Hammers A, Hajnal JV, and Rueckert D. Multi-atlas based segmentation of brain images: atlas selection and its effect on accuracy. Neuro-image 46(3):726–738, 2009. [DOI] [PubMed] [Google Scholar]
- 2.Arnold W, Senn P, Hennig M, Michaelis C, Deingruber K, Scheler R, Steinhoff HJ, Riphagen F, and Lamm K. Novel slow-and fast-type drug re lease round-window microimplants for local drug application to the cochlea: an experimental study in guinea pigs. Audiol. Neurootol 10(1):53–63, 2005. [DOI] [PubMed] [Google Scholar]
- 3.Badea CT, Fubara B, Hedlund LW, and Johnson GA. 4-D micro-CT of the mouse heart. Mol. Imaging 4(2):110–116, 2005. [DOI] [PubMed] [Google Scholar]
- 4.Borkholder DA, Zhu X, Hyatt BT, Archilla AS, Livingston WJ, and Frisina RD. Murine intracochlear drug delivery: reducing concentration gradients within the cochlea. Hear. Res 268(1):2–11, 2010. [DOI] [PMC free article] [PubMed] [Google Scholar]
- 5.Chen Z, Kujawa SG, McKenna MJ, Fiering JO, Mescher MJ, Borenstein JT, Leary Swan EE, and Sewell WF. Inner ear drug delivery via a reciprocating perfusion system in the guinea pig. J. Control. Release 110(1): 1–19, 2005. [DOI] [PMC free article] [PubMed] [Google Scholar]
- 6.Chen Z, Mikulec AA, McKenna MJ, Sewell WF, and Kujawa SG. A method for intracochlear drug delivery in the mouse. J. Neurosci. Methods 150(1): 67–73, 2006. [DOI] [PubMed] [Google Scholar]
- 7.Conn PM Sourcebook of Models for Biomedical Research New Jersey: Humana Press, 2008. [Google Scholar]
- 8.Dowsett DJ, Kenny PA, and Johnston RE. The Physics of Diagnostic Imaging London: Chapman & Hall Medical, 1998. [Google Scholar]
- 9.Fischer B, and Modersitzki J. A unified approach to fast image registration and a new curvature based registration technique. Linear Algebra Appl 380:107–124, 2004. [Google Scholar]
- 10.Gholipour A, Akhondi-Asl A, Estroff JA, and Warfield SK. Multi-atlas multi-shape segmentation of fetal brain MRI for volumetric and morphometric analysis of ventriculomegaly. NeuroImage 60(3):1819–1831, 2012. [DOI] [PMC free article] [PubMed] [Google Scholar]
- 11.Holden M A review of geometric transformations for nonrigid body registration. IEEE Trans. Med. Imaging 27(1):111–128, 2008. [DOI] [PubMed] [Google Scholar]
- 12.Ibanez L, Schroeder W, Ng L, and Cates J. The ITK Software Guide Clifton Park: Kitware Inc, 2005. [Google Scholar]
- 13.Kim HW, Cai QY, Jun HY, Chon KS, Park SH, Byun SJ, Lee MS, Oh JM, Kim HS, and Yoon KH. Micro-CT imaging with a hepatocyte selective contrast agent for detecting liver metastasis in living mice. Acad. Radiol 15(10):1282–1290, 2008. [DOI] [PubMed] [Google Scholar]
- 14.King EB, Salt AN, Eastwood HT, and OLeary SJ. Direct entry of gadolinium into the vestibule following intratympanic applications in guinea pigs and the influence of cochlear implantation. JARO J. Assoc. Res. Otolaryngol 12(6):741–751, 2011. [DOI] [PMC free article] [PubMed] [Google Scholar]
- 15.Klein S, Staring M, Murphy K, Viergever MA, and Pluim J. Elastix: a toolbox for intensity-based medical image registration. IEEE Trans. Med. Imaging 29(1):196–205, 2010. [DOI] [PubMed] [Google Scholar]
- 16.Klein S, van der Heide UA, Lips IM, van Vulpen M, Staring M, and Pluim JPW. Automatic segmentation of the prostate in 3D MR images by atlas matching using localized mutual information. Med. Phys 35(4):1407–1417, 2008. [DOI] [PubMed] [Google Scholar]
- 17.Laurell G, Teixeira M, Sterkers O, Bagger-Sjöbäck D, Eksborg S, Lidman O, and Ferrary E. Local administration of antioxidants to the inner ear: kinetics and distribution. Hear. Res 173(1–2):198–209, 2002. [DOI] [PubMed] [Google Scholar]
- 18.Maes F, Collignon A, Vandermeulen D, Marchal G, and Suetens P. Multi modality image registration by maximization of mutual information. IEEE Trans. Med. Imaging 16(2):187–198, 1997. [DOI] [PubMed] [Google Scholar]
- 19.McCall AA, Swan EEL, Borenstein JT, Sewell WF, Kujawa SG, and McKenna MJ. Drug delivery for treatment of inner ear disease: current state of knowledge. Ear Hear 31(2):156–165, 2010. [DOI] [PMC free article] [PubMed] [Google Scholar]
- 20.Müller M, Klinke R, Arnold W, and Oestreicher E. Auditory nerve fibre responses to salicylate revisited. Hear. Res 183(1):37–43, 2003. [DOI] [PubMed] [Google Scholar]
- 21.Müller M, von Hünerbein K, Hoidis S, and Smolders JWT. A physio logical place–frequency map of the cochlea in the CBA/J mouse. Hear. Res 202(1):63–73, 2005. [DOI] [PubMed] [Google Scholar]
- 22.Mynatt R, Hale SA, Gill RM, Plontke SK, and Salt AN. Demon stration of a longitudinal concentration gradient along scala tympani by sequential sampling of perilymph from the cochlear apex. JARO J. Assoc. Res. Otolaryngol 7(2):182–193, 2006. [DOI] [PMC free article] [PubMed] [Google Scholar]
- 23.Naganawa S, Sone M, Yamazaki M, Kawai H, and Nakashima T. Visualization of endolymphatic hydrops after intratympanic injection of Gd-DTPA: comparison of 2D and 3D real inversion recovery imaging. Magn. Reson. Med. Sci 10(2):101–106, 2011. [DOI] [PubMed] [Google Scholar]
- 24.Plontke SK, and Salt AN. Quantitative interpretation of corticosteroid pharmacokinetics in inner fluids using computer simulations. Hear. Res 182(1–2):34–42, 2003. [DOI] [PubMed] [Google Scholar]
- 25.Plontke SK, Siedow N, Wegener R, Zenner HP, and Salt AN. Cochlear pharmacokinetics with local inner ear drug delivery using a three-dimensional finite-element computer model. Audiol. Neurootol 12(1):37–48, 2007. [DOI] [PMC free article] [PubMed] [Google Scholar]
- 26.Plontke SK, Wood AW, and Salt AN. Analysis of gentamicin kinetics in fluids of the inner ear with round window administration. Otol. Neurotol 23(6):967–974, 2002. [DOI] [PubMed] [Google Scholar]
- 27.Rohlfing T, Brandt R, Menzel R, and Maurer CR. Evaluation of atlas selection strategies for atlas-based image segmentation with application to confocal microscopy images of bee brains. Neuroimage 21(4):1428–1442, 2004. [DOI] [PubMed] [Google Scholar]
- 28.Salt AN Simulation of methods for drug delivery to the cochlear fluids. Adv. Otorhinolaryngol 59:140–148, 2002. [DOI] [PubMed] [Google Scholar]
- 29.Salt AN Pharmacokinetics of drug entry into cochlear fluids. Volta Rev 105(3):277, 2005. [PMC free article] [PubMed] [Google Scholar]
- 30.Salt AN, Hale SA, and Plontke SK. Perilymph sampling from the cochlear apex: a reliable method to obtain higher purity perilymph samples from scala tympani. J. Neurosci. Methods 153(1):121–129, 2006. [DOI] [PMC free article] [PubMed] [Google Scholar]
- 31.Salt AN, and Ma Y. Quantification of solute entry into cochlear perilymph through the round window membrane. Hear. Res 154(1–2):88–97, 2001. [DOI] [PubMed] [Google Scholar]
- 32.Santi PA, Rapson I, and Voie A. Development of the mouse cochlea database (MCD). Hear. Res 243(1–2):11–17, 2008. [DOI] [PMC free article] [PubMed] [Google Scholar]
- 33.Studholme C, Hill DLG, Hawkes DJ. Automated 3D registration of MR and CT images of the head. Med. Image Anal 1(2):163–175, 1996. [DOI] [PubMed] [Google Scholar]
- 34.Studholme C, Hill DLG, and Hawkes DJ. An overlap invariant entropy measure of 3D medical image alignment. Pattern Recogn 32(1):71–86, 1999. [Google Scholar]
- 35.Swan EEL, Mescher MJ, Sewell WF, Tao SL, and Borenstein JT. Inner ear drug delivery for auditory applications. Adv. Drug Deliv. Rev 60(15):1583–1599, 2008. [DOI] [PMC free article] [PubMed] [Google Scholar]
- 36.Szymanski-Exner A, Stowe NT, Salem K, Lazebnik R, Haaga JR, Wilson DL, and Gao J. Noninvasive monitoring of local drug release using X-ray computed tomography: optimization and in vitro/in vivo validation. J. Pharm. Sci 92(2):289–296, 2003. [DOI] [PubMed] [Google Scholar]
- 37.Thevenaz P, Ruttimann UE, and Unser M. A pyramid approach to subpixel registration based on intensity. IEEE Trans. Image Process 7(1):27–41, 1998. [DOI] [PubMed] [Google Scholar]
- 38.Thorne M, Salt AN, DeMott JE, Henson MM, Henson OW, and Gewalt SL. Cochlear fluid space dimensions for six species derived from reconstructions of three-dimensional magnetic resonance images. Laryngoscope 109(10):1661–1668, 1999. [DOI] [PubMed] [Google Scholar]
- 39.Zheng J, Jaffray D, and Allen C. Quantitative CT imaging of the spatial and temporal distribution of liposomes in a rabbit tumor model. Mol. Pharm 6(2):571–580, 2009. [DOI] [PubMed] [Google Scholar]
- 40.Zou J, Poe D, Ramadan UA, and Pyykkö I. Oval window transport of Gd- DOTA from rat middle ear to vestibulum and scala vestibuli visualized by in vivo magnetic resonance imaging. Ann. Otol. Rhinol. Laryngol 121(2):119–128, 2012. [DOI] [PubMed] [Google Scholar]


