Abstract
The purpose of this study was to extend the Extended Cardiac-Torso (XCAT) series of computational phantoms to include a detailed lung architecture including airways and pulmonary vasculature. Eleven XCAT phantoms of varying anatomy were used in this study. The lung lobes and initial branches of the airways, pulmonary arteries and veins were previously defined in each XCAT model. These models were extended from the initial branches of the airways and vessels to the level of terminal branches using an anatomically-based volume-filling branching algorithm. This algorithm grew the airway and vasculature branches separately and iteratively without intersecting each other using cylindrical models with diameters estimated by order-based anatomical measurements. Geometrical features of the extended branches were compared with literature anatomy values to quantitatively evaluate the models. These features include branching angle, length to diameter ratio, daughter to parent diameter ratio, asymmetrical branching pattern, diameter, and length ratios. The XCAT phantoms were then used to simulate CT images to qualitatively compare them with the original phantom images. The proposed growth model produced 46369±12521 airways, 44737±11773 arteries, and 39819±9988 veins to the XCAT phantoms. Furthermore, the growth model was shown to produce asymmetrical airway, artery, and vein networks with geometrical attributes close to morphometry and model based studies. The simulated CT images of the phantoms were judged to be more realistic, including more airways and pulmonary vessels compared to the original phantoms. Future work will seek to add a heterogeneous parenchymal background into the XCAT lungs to make the phantoms even more representative of human anatomy, paving the way towards the use of XCAT models as a tool to virtually evaluate the current and emerging medical imaging technologies.
Keywords: Lung, Simulation and Synthesis, Tissue modeling, X-ray imaging and computed tomography
I. Introduction
EXTENDED CARDIAC-TORSO (XCAT) phantoms are a library of computational human phantoms with detailed whole-body anatomies for individuals of different ages and body types. XCAT geometries are defined based on segmentation of organs in patient CT datasets using non-uniform rational B-spline (NURBS) surfaces [1–4]. These virtual phantoms can be used to perform patient-specific simulation studies in the context of medical imaging. As such, these phantoms have been extensively used in patient-specific organ dose estimation studies [5–8].
A current limitation of the XCAT phantoms is that the intra-organ anatomical structures are not modeled, i.e. the organs are mainly uniform inside. For example, the current XCAT phantoms include lungs with segmented models for initial airways and vessels to the maximum of 9 generations; these models do not currently include the smaller airways and pulmonary vasculature that make a significant anatomical content of the lung. While sufficient for dosimetry studies, lack of these heterogeneous intra-organ structures negatively affects the accuracy of image quality based simulation studies. For example, recent studies have shown that in CT, image quality attributes such as contrast, noise, and resolution are dependent on the subject’s heterogeneous background and material, especially in iterative reconstructions [9–11]. Such studies cannot be accurately conducted in a virtual platform using homogenous phantoms. Therefore, detailed anatomically-based models of the intra-organ structures are essential for conducting image quality based simulations towards the goal of better understanding and further optimizing the imaging systems.
In this paper, building upon our earlier work with the airway tree [12], we advanced the XCAT phantoms to include a more comprehensive lung architecture. The airways as well as the pulmonary arteries and veins were extended from the initially segmented branches to the level of terminal branches, considering the bronchial wall thicknesses. The three trees (airways, pulmonary arteries, and veins) were grown simultaneously, optimizing their distribution while avoiding intersections.
The human lung consists of five lobes (two in the left and three in the right) and its architecture can be classified into parenchyma and non-parenchyma [13]. The parenchyma contains air, gas exchange units, vessels smaller than 20 to 25 μm in diameter, and capillaries whereas the non-parenchyma includes conducting airways and vasculature trees larger than 20 to 25 μm in diameter [14, 15]. Ideally, these structures would be segmented from real human imaging data to create the most realistic models of human lungs. However, direct segmentation of these structures is limited by the image acquisition and segmentation algorithms. As such, the current state of the art lung segmentation methods are limited in extracting only initial branches of the conducting airways, pulmonary arteries, and pulmonary veins [16, 17], as in the existing XCAT models. Therefore, knowledge of lung structures’ morphometry and its three-dimensional geometrical complexity are required to augment the limited realism of anthropomorphic phantoms.
II. Methods
In the existing XCAT models, the lung lobes, the airways, and pulmonary arteries and veins are already defined for the lower branches. Similar to our previous work [12], we used a growth model based on anatomical and morphometry studies to grow and model the higher generation branches using the earlier generations as starting points. In this work, though, we grew the artery and vein trees in addition to the airways. This framework was utilized to extend 11 anatomically variable XCAT adult phantoms (6 females, 5 males).
A. Growth Model
Previous anatomy studies have shown that airway and vascular networks are space filling, asymmetrical tree structures that bifurcate into multiple generations [14, 18–22]. These studies informed the development of an asymmetrical volume-filling branching (VFB) method for modeling the human airways [23, 24] and the pulmonary vasculature [25], separately. The VFB has been shown to produce detailed lung airways or vasculature with consistent geometrical properties compared against anatomy studies. Furthermore, the VFB has been extensively used to investigate lung functions [26–30].
In this study, we extended the VFB method [24] to generate the airways and vasculature together in the XCAT phantoms while avoiding intersections between branches.
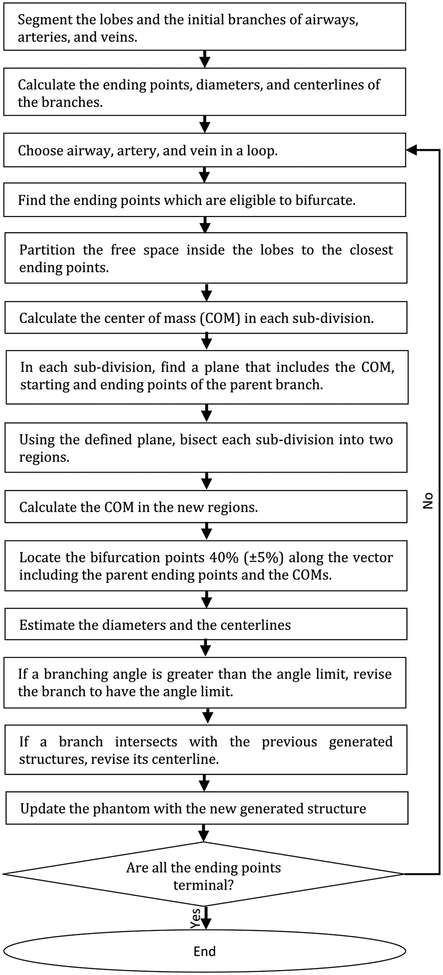
The proposed growth model algorithm is outlined in Fig. 1. First, the centerlines, diameters and ending points were extracted from the initial airway and vessel branches defined in each XCAT model. The centerlines were computed by skeletonizing the initial branches [31, 32]. The branch diameters were calculated from the surfaces. The ending points were found by extracting the network graph of the centerlines [32]. The algorithm iteratively estimated bifurcation points of the new generations for the airways, arteries, and veins, with their corresponding diameters and centerlines. Airways, arteries, and veins were grown in a loop. In each iteration, the free space was sampled with a uniform grid where each grid point occupied an average volume of a pulmonary acinus. Then, the next generation branches were estimated using the VFB method. Finally, the phantom was updated with the new generated structures. The algorithm was iterated, growing a given branch until at least one of the following conditions was met:
Fig. 1.
Outline of the growth model
Branch diameter less than 0.25 mm,
Bifurcation reaching the boundary of the lobe, or
No more free space (grid point) to grow.
In each iteration, the Voronoi diagram was used to partition the grid points (re-sampled at each iteration from the updated free space) to the closest starting points that are eligible to bifurcate. As noted in Fig. 1, the branch length ratio was set to be 0.4 (± 0.05) along the vector of the parent ending point and center of mass points. This ratio was applied as it was shown to create branching results for both airways and vasculature close to anatomy studies [24, 25].
In each iteration, the newly generated branch was examined with respect to the previous state of its ever-growing branches to avoid potential intersections. After fixing any intersections, the phantom got updated with the newly generated structures (see the “Avoiding intersections” section for more details). The algorithm was set to end when no branch was eligible to bifurcate.
The following describes how the branches were limited in terms of the branching angles, how the diameters and the bronchial wall thicknesses were estimated, and how the intersections were avoided at each iteration of the algorithm.
1). Branching angle limit::
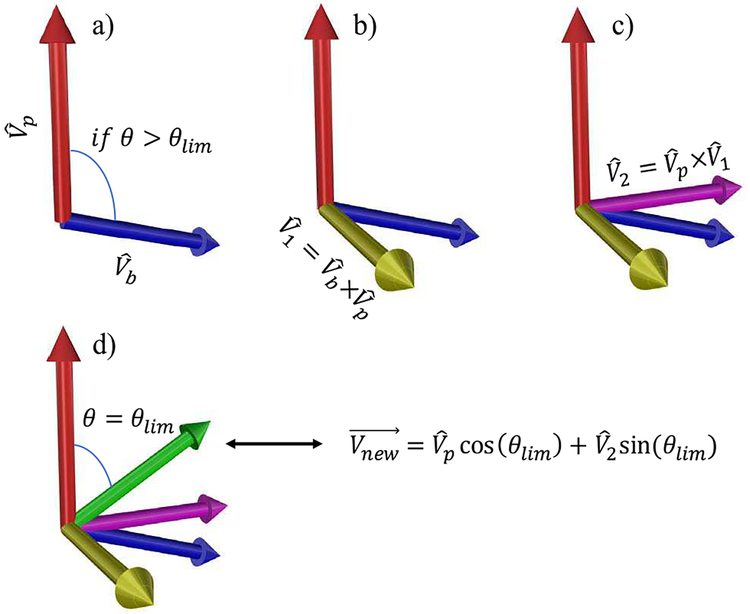
To avoid generating unrealistic, wide-angle branches, a limit of 60 degrees was assigned [24]. In the rare situations, where the angle between a branch and its parent was greater than the limit, the branch was revised adjusting the angle to 60 degrees where the revised branch remains in the same plane with its parent. Fig. 2 illustrates this procedure. First, the cross product of the unit vectors of the branch and its parent was calculated (Fig. 2b). The cross product of the resulting unit vector and was calculated to generate the unit vector , which is orthogonal to and is in the same plane including and (Fig. 2c). The revised unit vector was then calculated using
| (1) |
where θlim is the angle limit (Fig. 2d).
Fig. 2.
Procedure for correcting a branch if the angle is greater than the limit. and are the unit vectors of the branch and its parent. θis the angle between and , and θlim is the angle limit. The “×” is the cross-product operation and is the revised vector for the branch. Note that these are unit vectors and each branch starts at the end of its parent branch.
2). Diameters:
The branch diameter, D, was estimated using
| (2) |
as the mean value. A coefficient of variation of 0.1 was randomly added to D value with a uniform distribution to add variability. In (2), Dparent is the parent diameter, N and Np are the Strahler order of the branch and its parent, and Rd is the Strahler diameter ratio calculated from morphometry measurements. The Strahler order difference, N − Np, was estimated using the connectivity matrix provided in [20], where the probability of the connection between a branch with order of X and another branch with order of Y was calculated.
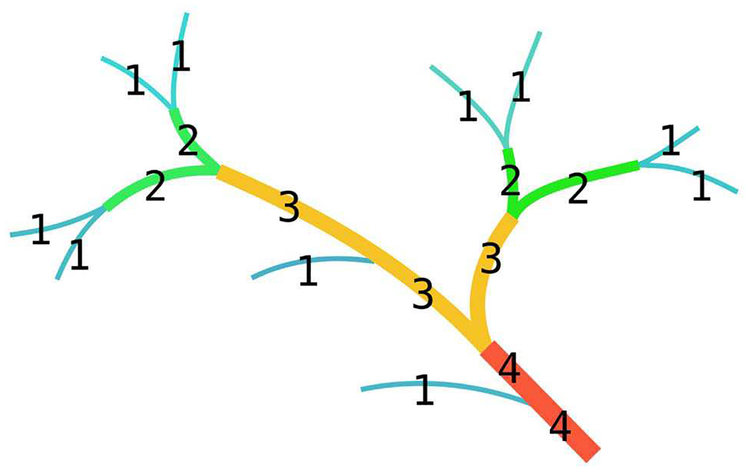
In summary, Strahler ordering is a way of demonstrating the complexity of tree structures. In this ordering arrangement, the terminal branches are order 1. A non-terminal branch is order x+1 if both of its daughter branches are order x, otherwise the order of the branch is the maximum order of its daughter branches. Fig. 3 shows an illustration of Strahler ordering of a tree structure.
Fig. 3.
An illustration for Strahler ordering.
3). Airway wall thicknesses:
Airways are hollow structures with wall thicknesses in the range of 0.1 to 1 mm. These walls consist of pseudostratified ciliated epithelium and a layer of smooth muscle [34]. To simulate this, wall thicknesses were estimated using the following equation
| (3) |
where, D, Dl, and tw are the branch diameter, lumen diameter, and wall thickness. The ratio was assigned using the measurements in [35].
4). Avoiding intersections:
The VFB method does not consider avoiding the potential intersections of the generated branches with each other or with the previous segmented branches. This problem is even more challenging in our case with modeling airways and vessels altogether.
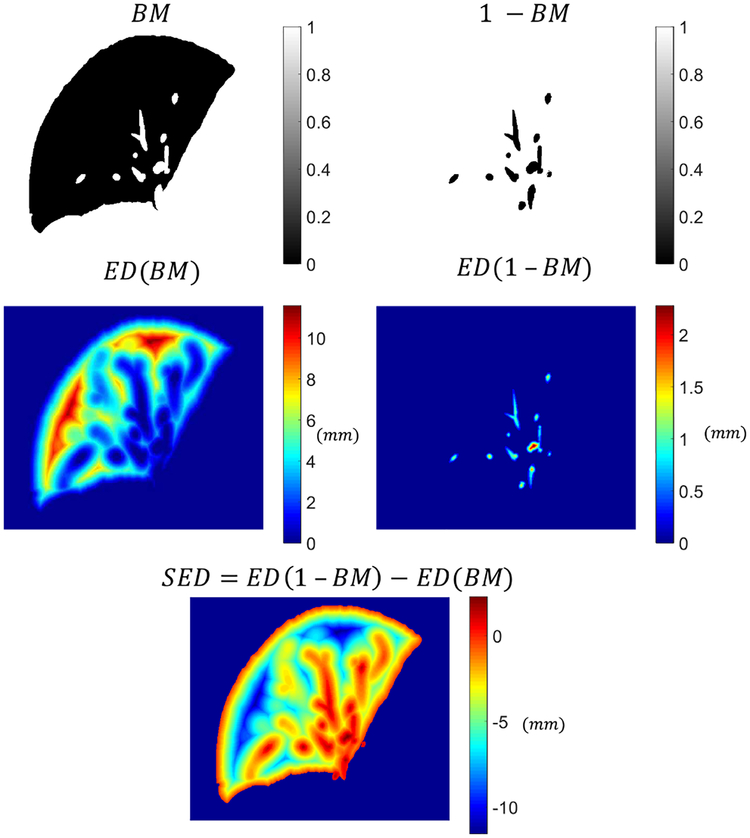
Our proposed algorithm avoided intersections using the following procedure. The algorithm generated the branches one by one and not in parallel. Once a branch was found to be not intersecting the previous generated structures, it was added to the phantom allowing the next branch to bifurcate. If the ending point of a branch was not in the free space, the branch length was iteratively reduced until the criteria was met. If this procedure made the branch length less than the limit (1.0 mm), the branch was removed and was not further grown. Once the ending point of the branch was in the free space, the centerline of the branch was checked for intersections by overlapping its mask with the binary mask of the previously generated structures. In the case of any intersections, the centerline of the branch was iteratively moved along a vector until the intersections were avoided. The vector used here was the gradient descent of the Signed Euclidean Distance (SED) transform map of the binary mask.
The Euclidean distance transform map (ED) of a binary mask assigns a number for each voxel of the mask, where that number is the Euclidean distance between that voxel and the nearest non-zero voxel in that mask. The Signed Euclidean distance transform map (SED) of a binary mask, B M, is defined as
| (4) |
where ED is the Euclidean distanced transform map of the binary mask, B M. The voxels outside the lobes were assigned to one in the B M and 1 − B M masks and were set to be not a number (NaN) in the SED. Fig. 4 shows an example of a binary mask and its corresponding SED transform map.
Fig. 4.
An example of Signed Euclidean distance (SED) map calculation based on a binary mask (BM). In SED, voxels with positive values are the regions where structures exist and voxels with negative values are the free regions. The voxels outside the lung lobe is set to be not a number (NaN).
The SED map guides the intersected centerline points to find the minimum path from the intersected regions to the free space. The SED map was set to be positive inside the previously generated structures, zero in the boundaries, and negative in the free space inside the lobes. The revised centerline was further smoothed by fitting it to a cubic spline curve where the starting and the ending points of the revised centerline were fixed.
B. Evaluation
1). Geometrical evaluation:
The goal of this study was to make the XCAT phantoms more representative of clinical reality by extending the airway and vessel trees. Therefore, it was essential to ascertain that the proposed method simulates relevant attributes of human lungs in the phantoms. Towards that goal, the XCAT phantoms with the growth model were evaluated by comparing their geometrical features against morphometry measurements and other modeling studies. The geometrical features included: angle θ between a branch and its parent, length to diameter ratio , and daughter to parent diameter ratio . The asymmetrical characteristics of the growth model were also compared against morphometry and modeling studies. These features included diameter ratio (RdS), length ratio (RlS), and branching ratio (RbS), defined as the antilog of the slope of the log (mean diameters), log (mean lengths), and log (number of branches) against the Strahler order, respectively [36–38].
2). Imaging Comparison:
The detailed lung models were added as NURBS surfaces into 11 anatomically variable whole-body XCAT phantoms. Linear attenuation coefficient of different materials as a function of photon energy were calculated using [39]. A CT ray tracer [40] was used to synthesize contrast-enhanced CT projection images with a tube voltage of 120 kV. The projection images were then reconstructed using a weighted filtered backprojection algorithm. The CT images of the phantoms with and without the tree extensions were qualitatively compared with each other.
III. Results
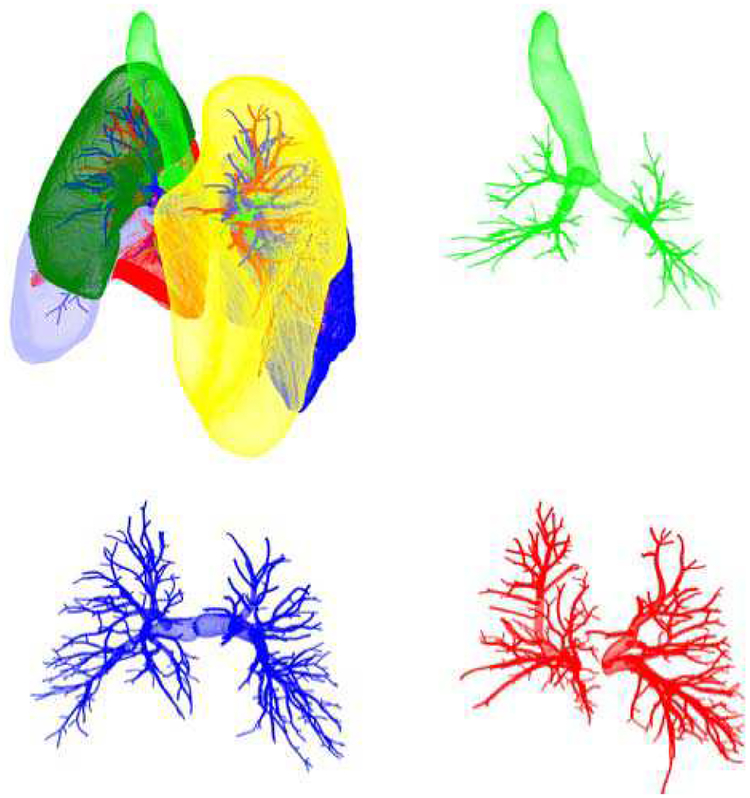
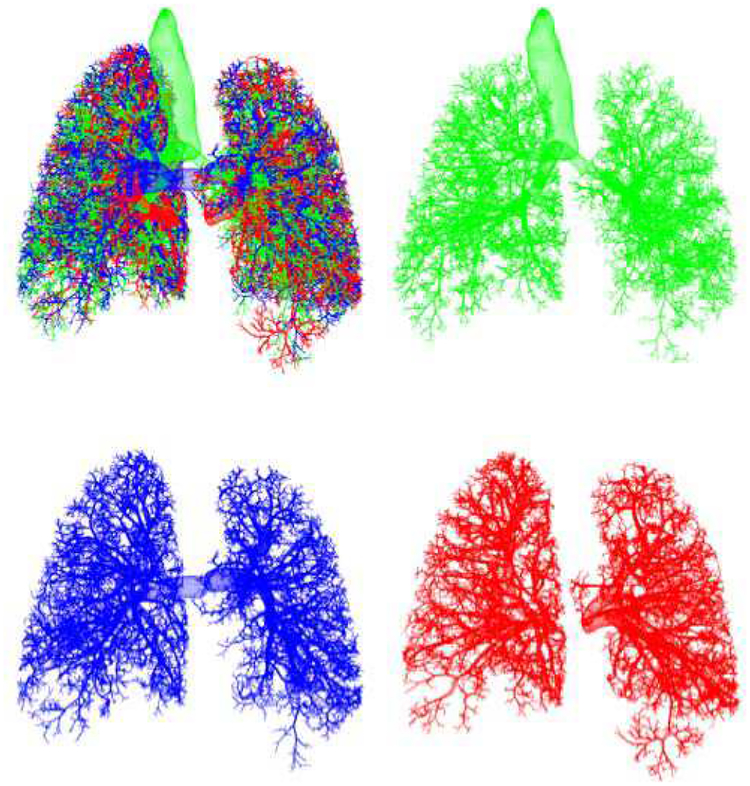
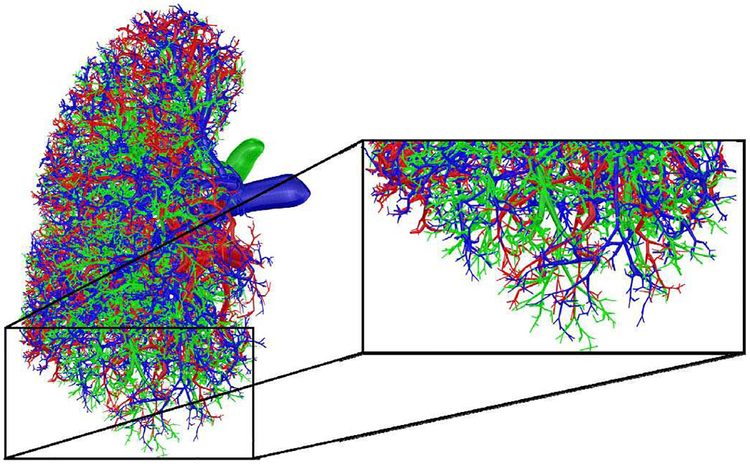
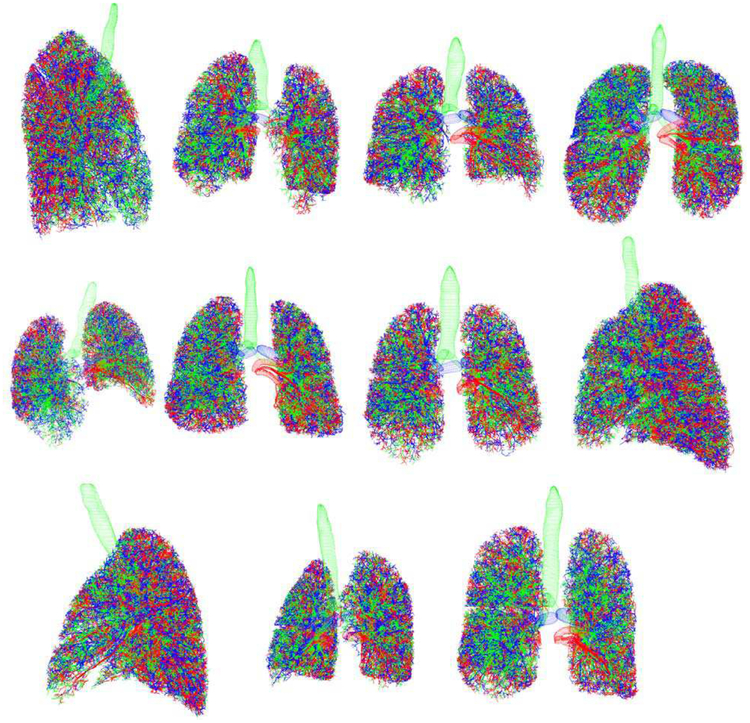
A summary of the gender, age, weight, body mass index (BMI), and total lung volumes of the prototyped phantoms is given in Table I. As shown in the table, the phantoms had different BMI and lung volumes to include a various range of patient sizes. Fig. 5 shows an example of 3D renderings of the initial branches for the airways and pulmonary vessels that are defined in the XCAT models. Three-dimensional rendering of the results of using the growth model and a magnified section of it are shown in Fig. 6 and 7. The growth model added 46369 ± 12521 (range: 31056–68899) airways, 44737 ± 11773 (range: 30834–66140) arteries, and 39819 ± 9988 (range 28029–57989) veins to the XCAT phantoms. Fig. 8 shows a collage of the generated phantoms illustrating detailed lung structures in 11 anatomically variable XCAT phantoms.
TABLE I.
A Summary of Prototyped Phantoms
| Sex | Age | Weight (kg) | BMIa | Lung Volumeb (cm3) | |
|---|---|---|---|---|---|
| Phantoml | Female | 27 | 57.5 | 20.37 | 2456 |
| Phantom2 | Female | 31 | 69.6 | 28.60 | 2431 |
| Phantom3 | Male | 31 | 82.8 | 25.33 | 5592 |
| Phantom4 | Female | 36 | 70.1 | 24.26 | 4174 |
| Phantom5 | Male | 38 | 74.8 | 23.09 | 3015 |
| Phantom6 | Male | 48 | 92.7 | 28.61 | 4032 |
| Phantom7 | Female | 49 | 105.1 | 35.52 | 4123 |
| Phantom8 | Female | 51 | 68.2 | 22.27 | 3322 |
| Phantom9 | Male | 58 | 117 | 36.11 | 4692 |
| Phantom 10c | Female | NA | 66 | 24.93 | 2531 |
| Phantoml lc | Male | NA | 81 | 26.12 | 2768 |
BMI = Body Mass Index
Volumes are at the end-expiratory phase
50th percentile phantoms
Fig. 5.
Initial surfaces for the lobes (upper left), airways (green), arteries (blue), and veins (red).
Fig. 6.
Growth model results: airways (green), arteries (blue), and veins (red).
Fig. 7.
A magnified section of a phantom with the growth model: airways (green), arteries (blue), and veins (red).
Fig. 8.
Collage of 11 XCAT phantoms. Airways are green. Arteries are blue. Veins are red.
Table II lists the geometrical comparisons between the growth model and previous morphometry-based and model-based studies. Results are presented in terms of average across the phantoms ± the standard deviation, range (indicating the patient to patient variability), and R2 (indicating the goodness of the fits). Parameters θ, , and were found to produce results in the range of real human anatomy and previous lung models. It should be noted that we could not find any anatomical measurements for the θ and the in arterial and venous networks. Therefore, those results could only be compared against the airway measurements or the vasculature models.
TABLE II.
Geometrical Features of the Growth Model, Previous Morphometry Studies, and Previous Models
| Growth model | Morphometry | Other Models | ||
|---|---|---|---|---|
| θ | Airways | 43.76 ±0.51 (range: 42.96–44.47) |
39,43 [41]; 37.28 [42] |
50.31 [24]; 42.90 ±0.10[43] |
| Arteries | 44.84 + 0.30 (range: 44.46 – 45.26) |
- | 47.29 [25] | |
| Veins | 44.56 ± 0.41 (range: 43.97 – 45.19) |
- | 51.52 [25] | |
| Airways | 3.45 ± 0.05 (range: 3.40 – 3.53) |
3.09,3.14[41]; ~3.25 [44] |
2.92 [24]; 3.0[45] 4.67 ± 0.47 [43] |
|
| Arteries | 4.05 + 0.12 (range: 3.86 – 4.22) |
- | - | |
| Veins | 4.35 ± 0.09 (range: 4.21 – 4.48) |
- | - | |
| Airways | 0.78 ± 0.00 (range: 0.78 – 0.79) |
0.76 [46]; 0.78, 0.83 [41] |
0.79 [24] 0.82 ± 0.00 [43] |
|
| Arteries | 0.73 ± 0.01 (range: 0.72 – 0.74) |
- | - | |
| Veins | 0.73 ± 0.01 (range: 0.72 – 0.74) |
- | - | |
| RbS | Airways | 2.48 ± 0.08 (range: 2.34 −2.58) (R2= 0.99 + 0.01) |
2.51–2.81 [38] | 2.80 [24] (R2 = 1.00) |
| Arteries | 2.96 ± 0.53 (range: 2.54 – 4.05) (R= 0.96 + 0.04) |
3.03 [36] 3.11 [14] 3.36 [20] |
3.04 [25] (R2 = 1.00) |
|
| Veins | 3.46 ± 0.29 (range: 3.15–4.01) (R2= 0.96 + 0.01) |
3.30 [38] 3.33 [20] |
3.41 [25] (R2 = 1.00) |
|
| RdS | Airways | 1.43 + 0.03 (range: 1.37 −1.46) (R3= 0.94 ± 0.02) |
1.35–1.45 [38] | 1.41 [24] (R2 = 0.98) |
| Arteries | 1.58 + 0.03 (range: 1.54–1.62) (R2= 0.91 + 0.01) |
1.56 [20] 1.60[36] 1.56, 1.60 [14] |
1.57 [25] (R2 = 1.00) |
|
| Veins | 1.59 + 0.04 (1.55–1.67) (R2= 0.93 ± 0.02) |
1.58 [20] 1.69 [38] |
1.66 [25] (R2 = 1.00) |
|
| RlS | Airways | 1.37 ±0.02 (range: 1.34 −1.40) (R2= 1.00 ±0.01) |
1.33–1.46 [38] | 1.39 [24] (R2 = 0.95) |
| Arteries | 1.34 + 0.03 (range: 1.28 −1.39) (R2= 0.96 ± 0.03) |
1.46 [14] 1.49 [36] 1.49 [20] |
1.50 [25] (R2 = 0.95) |
|
| Veins | 1.29 + 0.01 (range: 1.28 −1.33) (R2= 0.99 ± 0.01) |
1.50 [20] 1.68 [38] |
1.64 [25] (R2 = 0.94) |
Results are in mean ± standard deviation and the range of the values. R2 is the coefficient of determination and indicates the goodness of the fits. θ=branching angle; = length to diameter ratio; = daughter to parent diameter ratio: RbS, RdS, RlS = branching, diameter, and length ratios.
RbS, as defined in [37], is 2 for symmetrical tree structures and is greater than 2 for asymmetrical ones. The prototyped airways, arteries and veins had RbS > 2 and were very close to the anatomy and the model measurements, with the trend of the arteries being more symmetrical than the veins and the airways being more symmetrical than the arteries. The growth model also generated the tree structures with Rd S values close to the previous studies. Finally, Rl S was in the range of previous studies for the prototyped airways. This feature was slightly smaller in the prototyped arteries and veins compared with the previous studies.
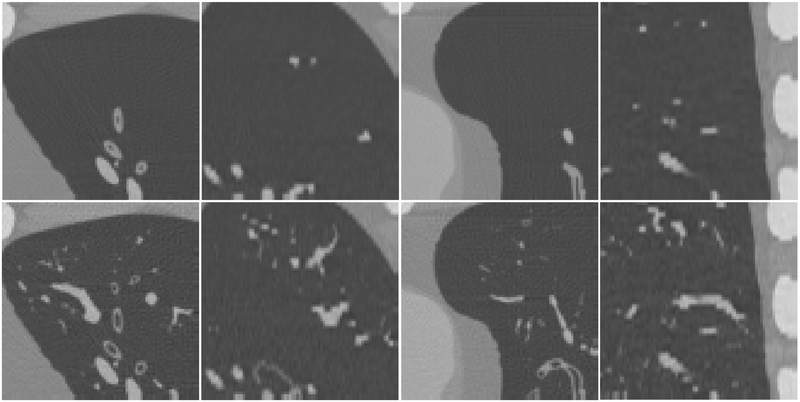
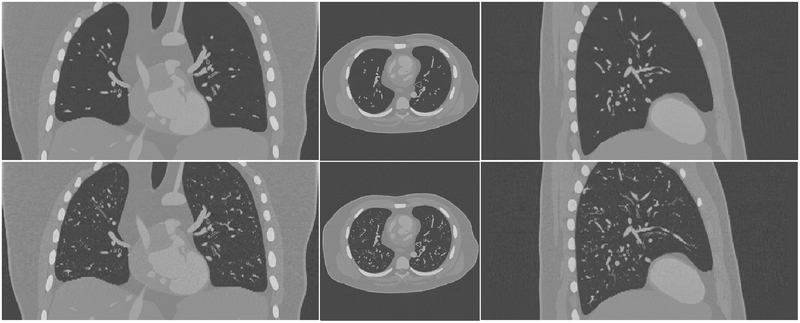
Fig.9 shows a coronal, an axial, and a sagittal view of the simulated CT images of an XCAT with and without the growth model. Fig. 10 shows some magnified regions of the CT images in the same phantom. The CT images of the enhanced phantoms are more realistic as they include more detailed structures than the original ones and thus are closer to clinical reality in terms of the airways and vessels.
Fig. 10.
Small regions of the simulated CT images of the XCAT phantom without (first row) and with (second row) the lung growth model. In the lung regions, the results with the growth model include more detailed airways and pulmonary vasculature and thus are closer to clinical reality.
IV. Discussion
Numerous morphometry studies [14, 18, 20, 33, 35] have investigated the number of generations, branch lengths and diameters, and airway wall thicknesses in conducting airways and pulmonary vessel trees to the level of terminal branches enabling mathematical 3D models of human lung airways [12, 23, 24, 45, 47] and vasculature networks [25, 48]. Some of these models have been successfully used to investigate some lung functions [26–30, 43]. However, there has been no model to include airways and vessels together, to the level of terminal branches in separate lobes, while estimating the wall thickness of the airways and avoiding intersections between branches. It might not be necessary to include all these features for some specific applications. For example, to conduct computational fluid dynamics studies [26–28, 43], 3D models of conducting airways are needed, whereas including vasculature tree would not be necessary. Similarly, in computational blood flow distribution analysis [29, 30] 3D models of the vasculature trees would be sufficient. However, to make the lungs of the XCAT phantoms more representative of human anatomy, they must include continuous and non-intersecting tree networks of airways, arteries, and veins together with close anatomical attributes of what exist in humans. This extension adds essential and anatomically relevant features which pave the way toward the goal of simulating realistic CT images for studies in image quality.
In this study, we used 11 XCAT phantoms with various attributes such as gender, height, weight, and lung volume. However, our proposed algorithm is extendable for creating a larger population of phantoms. Moreover, the prototyped phantoms are flexible in that they can be modeled as both surfaces and voxelized formats to be compatible with multiple available medical imaging simulation packages including CT [40, 49–51], MRI [52–54], and SPECT/PET [55, 56]. Using this approach, medical imaging trials can be conducted virtually when the actual trials are not practical due to financial, time, and ground truth issues. Another advantage of these phantoms is that they can be used as a toolset to evaluate different lung segmentation or registration algorithms where the tree structures are not limited to the big branches, a large cohort of datasets can be synthesized, and the ground truth would be fully known.
In this study, we quantitatively evaluated the geometrical features of the extended XCAT phantoms. Although this essential approach demonstrates the anatomical attributes of the phantoms, it does not quantitatively evaluate the level of realism of the synthesized CT images. Such investigations can be done by both 1) observer studies where radiologists score the level of realism of the simulated images and 2) quantitative measurements of the simulated images to assure that the image quality features (such as noise, contrast, resolution, detectability index, etc.) extracted from the synthesized datasets are close to same features extracted from real images. However, these investigations demand modeling of parenchyma structures as well as having realistic CT simulators. A radiologist would not consider a simulated CT dataset realistic if it does not include the “textured” background of the parenchyma or if the CT simulator does not closely mimic the attributes of a scanner in the clinic. Similarly, while the extracted imaging features are dependent on the modeled non-parenchyma structures, they are also dependent on the parenchyma “texture” and the physics of the CT simulator.
In future work, to further enhance the level of realism, we plan to establish an anatomically based technique to model and incorporate the parenchyma structures as well as pathologies inside the XCAT lung phantoms. We also plan to develop techniques to model heterogeneities within other organs and structures as volumetric textures within the phantoms. Such simulated phantoms will be quantitatively evaluated using both observer studies and image quality based comparisons. These advances, combined with more accurate CT simulators (currently being developed in our laboratory), will enable the XCAT phantoms to generate data close to that of actual patients. With that ability, the XCAT models can become an enabling toolset to virtually evaluate current and emerging medical imaging technologies. This toolset is targeted to be used to conduct lung-related virtual clinical trial studies including quantifying the impact of a CT protocol on image quality and quantitative accuracy for imaging operations with the knowledge of the ground truth.
This study has several limitations. The original XCAT models for the airways and vessels were limited in the initial branches. However, more segmented branches of airways and vessels can make the final phantoms even more anatomically relevant. The proposed growth model extended the gross airways, arteries, and veins based on only two well-known anatomical properties of the non-parenchyma structures: bifurcating and space-filling. While the geometrical measurements from our model were consistent with anatomy and other modeling measurements, the proposed algorithm does not perfectly model an exact human lung non-parenchyma architecture. For example, anatomy studies have shown that the airways and the arteries follow each other while the veins mostly bifurcate independently [14]. To simulate this, our proposed algorithm provided similar growing rules to the airways and vasculature, extending the existing 3D spatial relationship between the initial branches to the higher generations. However, this approach does not guarantee to create the most accurate 3D relationships of these structures in the higher generations.
Another limitation is that the algorithm was applied only to the lung expiration phase. In future work, we plan to incorporate respiratory motion to the lung structures in a manner similar to what we have done previously [2]. This will enable us to study the effects of respiratory motions on image quality.
The growth model also did not consider the effects of gravity which can affect the distribution and the density of pulmonary structures within the lung shape. As such, while gravity does influence the lung structure’s distribution, we consider the effects to be secondary compared to the other geometrical factors. Previously, we have utilized finite element techniques to simulate gravity for different positioning of the breast for breast imaging [57]. These techniques can be similarly used to simulate the gravity in the lungs in different positions such as supine and prone for future work.
Moreover, the growth model generated a variable number of terminal branches across the phantoms due to the existing variability in the phantoms lung volumes and shapes. We were not able to compare this variability against anatomical studies as those studies have not been performed across a population of patients. While this range in our prototyped phantoms might not exactly reflect the true variability across different subjects, it would enable us to test imaging systems across a wide range of lung architectures. Nevertheless, the tree structures can have more uniform number of terminal branches across the phantoms by putting a threshold on the number of terminal branches as a criterion to stop the growth model.
The growth model produced more symmetrical airways than vasculature due to the chosen sequence (airways, arteries, and veins) in the iteration of the model. This could be a departure from reality because in human lungs, each acinus is supplied by a single terminal bronchiole and a single arteriole; therefore, the branching ratio (the metric for asymmetry) is expected to be close for the tree structures. While this does not affect the use of these phantoms in the VCT application (as the tree symmetry is a secondary consideration in CT imaging interpretations), the trees could have closer symmetry by altering the sequence in each iteration.
The resolution of the phantom affects the phantom size (in both mesh and voxel-based formats), growth model runtime, and the CT simulations runtime. Therefore, our study only modeled the branches with diameters greater than 0.25 mm which is about twice finer than a resolution of a current typical commercial CT scanner. With this resolution, the growth model (written in MATLAB) runtime was about an hour per phantom on a 3.30 GHz Core i7 machine. The CT simulation (written in C) runtime was about 30 minutes per phantom where the projections at different angles were spread into multiple computers.
V. Conclusion
Anatomically-based modeling of pulmonary airways, arteries, and veins to the level of interstitial structures provides the XCAT phantoms with more detailed non-parenchyma structures. This essential feature paves the way towards the use of virtual patient models for realistic image quality assessments.
Fig. 9.
Simulated CT images of the XCAT phantom without (first row) and with (second row) the lung growth model.
Acknowledgment
The authors would like to thank Dr. Justin Solomon, Dr. Daniel Schmit, Dr. Angel Zeinginger, and Dr. Anuj Kapadia for their valuable comments and feedback on this project.
This study was supported by a research grant from the National Institutes of Health (2R01EB001838).
Contributor Information
Ehsan Abadi, Carl E. Ravin Advanced Imaging Laboratories, the Department of Electrical and Computer Engineering, and the Department of Radiology, Duke University, Durham, NC, 27705 USA.
William P. Segars, Carl E. Ravin Advanced Imaging Laboratories, the Department of Radiology, the Medical Physics Graduate Program, and the Department of Biomedical Engineering, Duke University, Durham, NC, 27705 USA
Gregory M. Sturgeon, Carl E. Ravin Advanced Imaging Laboratories and the Department of Radiology, Duke University Medical Center, Durham, NC, 27705 USA.
Justus E. Roos, Department of Radiology and Nuclear Medicine, Luzerner Kantonsspital, Luzern, Switzerland.
Carl E. Ravin, Carl E. Ravin Advanced Imaging Laboratories and the Department of Radiology, Duke University Medical Center, Durham, NC, 27705 USA.
Ehsan Samei, Carl E. Ravin Advanced Imaging Laboratories, the Department of Electrical and Computer Engineering, the Department of Radiology, the Department of Biomedical Engineering, the Medical Physics Graduate Program, and the Department of Physics, Duke University, Durham, NC, 27705 USA.
References
- [1].Segars W, Norris H, Sturgeon GM, Zhang Y, Bond J, Minhas A, et al. , “The development of a population of 4D pediatric XCAT phantoms for imaging research and optimization,” Medical physics, vol. 42, pp. 4719–4726, 2015. [DOI] [PMC free article] [PubMed] [Google Scholar]
- [2].Segars W, Sturgeon G, Mendonca S, Grimes J, and Tsui BM, “4D XCAT phantom for multimodality imaging research,” Medical physics, vol. 37, pp. 4902–4915, 2010. [DOI] [PMC free article] [PubMed] [Google Scholar]
- [3].Segars WP, Bond J, Frush J, Hon S, Eckersley C, Williams CH, et al. , “Population of anatomically variable 4D XCAT adult phantoms for imaging research and optimization,” Medical physics, vol. 40, p. 043701, 2013. [DOI] [PMC free article] [PubMed] [Google Scholar]
- [4].Segars WP and Tsui BM, “MCAT to XCAT: The evolution of 4-D computerized phantoms for imaging research,” Proceedings of the IEEE, vol. 97, pp. 1954–1968, 2009. [DOI] [PMC free article] [PubMed] [Google Scholar]
- [5].Li X, Samei E, Segars WP, Sturgeon GM, Colsher JG, Toncheva G, et al. , “Patient-specific radiation dose and cancer risk estimation in CT: Part I. Development and validation of a Monte Carlo program,” Medical physics, vol. 38, pp. 397–407, 2011. [DOI] [PMC free article] [PubMed] [Google Scholar]
- [6].Zhang Y, Li X, Paul Segars W, and Samei E, “Organ doses, effective doses, and risk indices in adult CT: Comparison of four types of reference phantoms across different examination protocols,” Medical physics, vol. 39, pp. 3404–3423, 2012. [DOI] [PMC free article] [PubMed] [Google Scholar]
- [7].Sahbaee P, Segars WP, and Samei E, “Patient-based estimation of organ dose for a population of 58 adult patients across 13 protocol categories,” Medical physics, vol. 41, p. 072104, 2014. [DOI] [PMC free article] [PubMed] [Google Scholar]
- [8].Sahbaee P, Abadi E, Segars WP, Marin D, Nelson RC, and Samei E, “The Effect of Contrast Material on Radiation Dose at CT: Part II—A Systematic Evaluation across 58 Patient Models,” Radiology, p. 152852, 2017. [DOI] [PMC free article] [PubMed] [Google Scholar]
- [9].Brunner CC and Kyprianou IS, “Material-specific transfer function model and SNR in CT,” Physics in medicine and biology, vol. 58, p. 7447, 2013. [DOI] [PubMed] [Google Scholar]
- [10].Solomon J and Samei E, “Quantum noise properties of CT images with anatomical textured backgrounds across reconstruction algorithms: FBP and SAFIRE,” Medical physics, vol. 41, 2014. [DOI] [PubMed] [Google Scholar]
- [11].Solomon J, Wilson J, and Samei E, “Characteristic image quality of a third generation dual-source MDCT scanner: Noise, resolution, and detectability,” Medical physics, vol. 42, pp. 4941–4953, 2015. [DOI] [PubMed] [Google Scholar]
- [12].Garrity JM, Segars WP, Knisley SB, and Tsui BM, “Development of a dynamic model for the lung lobes and airway tree in the NCAT phantom,” Nuclear Science, IEEE Transactions on, vol. 50, pp. 378–383, 2003. [Google Scholar]
- [13].Hsia CC, Hyde DM, Ochs M, and Weibel ER, “An official research policy statement of the American Thoracic Society/European Respiratory Society: standards for quantitative assessment of lung structure,” American journal of respiratory and critical care medicine, vol. 181, pp. 394–418, 2010. [DOI] [PMC free article] [PubMed] [Google Scholar]
- [14].Townsley MI, “Structure and composition of pulmonary arteries, capillaries, and veins,” Comprehensive Physiology, 2012. [DOI] [PMC free article] [PubMed] [Google Scholar]
- [15].Ochs M and Mühlfeld C, “Quantitative microscopy of the lung: a problem-based approach. Part 1: basic principles of lung stereology,” American Journal of Physiology-Lung Cellular and Molecular Physiology, vol. 305, pp. L15–L22, 2013. [DOI] [PubMed] [Google Scholar]
- [16].Rudyanto RD, Kerkstra S, Van Rikxoort EM, Fetita C, Brillet P-Y, Lefevre C, et al. , “Comparing algorithms for automated vessel segmentation in computed tomography scans of the lung: the VESSEL12 study,” Medical image analysis, vol. 18, pp. 1217–1232, 2014. [DOI] [PMC free article] [PubMed] [Google Scholar]
- [17].Van Rikxoort EM and Van Ginneken B, “Automated segmentation of pulmonary structures in thoracic computed tomography scans: a review,” Physics in medicine and biology, vol. 58, p. R187, 2013. [DOI] [PubMed] [Google Scholar]
- [18].Horsfield K and Cumming G, “Morphology of the bronchial tree in man,” Journal of Applied Physiology, vol. 24, pp. 373–383, 1968. [DOI] [PubMed] [Google Scholar]
- [19].Haefeli-Bleuer B and Weibel ER, “Morphometry of the human pulmonary acinus,” The Anatomical Record, vol. 220, pp. 401–414, 1988. [DOI] [PubMed] [Google Scholar]
- [20].Huang W, Yen R, McLaurine M, and Bledsoe G, “Morphometry of the human pulmonary vasculature,” Journal of Applied Physiology, vol. 81, pp. 2123–2133, 1996. [DOI] [PubMed] [Google Scholar]
- [21].Maina JN and van Gils P, “Morphometric characterization of the airway and vascular systems of the lung of the domestic pig, Sus scrofa: comparison of the airway, arterial and venous systems,” Comparative Biochemistry and Physiology Part A: Molecular & Integrative Physiology, vol. 130, pp. 781–798, 2001. [DOI] [PubMed] [Google Scholar]
- [22].Huo Y and Kassab GS, “Intraspecific scaling laws of vascular trees,” Journal of The Royal Society Interface, vol. 9, pp. 190–200, 2012. [DOI] [PMC free article] [PubMed] [Google Scholar]
- [23].Tawhai MH, Pullan A, and Hunter P, “Generation of an anatomically based three-dimensional model of the conducting airways,” Annals of biomedical engineering, vol. 28, pp. 793–802, 2000. [DOI] [PubMed] [Google Scholar]
- [24].Tawhai MH, Hunter P, Tschirren J, Reinhardt J, McLennan G, and Hoffman EA, “CT-based geometry analysis and finite element models of the human and ovine bronchial tree,” Journal of applied physiology, vol. 97, pp. 2310–2321, 2004. [DOI] [PubMed] [Google Scholar]
- [25].Burrowes KS, Hunter PJ, and Tawhai MH, “Anatomically based finite element models of the human pulmonary arterial and venous trees including supernumerary vessels,” Journal of applied physiology, vol. 99, pp. 731–738, 2005. [DOI] [PubMed] [Google Scholar]
- [26].Tawhai MH and Lin CL, “Image-based modeling of lung structure and function,” Journal of Magnetic Resonance Imaging, vol. 32, pp. 1421–1431, 2010. [DOI] [PMC free article] [PubMed] [Google Scholar]
- [27].Tawhai MH, Hoffman EA, and Lin CL, “The lung physiome: merging imaging-based measures with predictive computational models,” Wiley Interdisciplinary Reviews: Systems Biology and Medicine, vol. 1, pp. 61–72, 2009. [DOI] [PMC free article] [PubMed] [Google Scholar]
- [28].Tawhai MH and Ben-Tal A, “Multiscale modeling for the lung physiome,” Cardiovascular Engineering: An International Journal, vol. 4, pp. 19–26, 2004. [Google Scholar]
- [29].Burrowes KS, Hunter PJ, and Tawhai MH, “Investigation of the Relative Effects of Vascular Branching Structure and Gravity on Pulmonary Arterial Blood Flow Heterogeneity via an Image-based Computational Model 1,” Academic radiology, vol. 12, pp. 1464–1474, 2005. [DOI] [PubMed] [Google Scholar]
- [30].Burrowes K, Swan A, Warren N, and Tawhai M, “Towards a virtual lung: multi-scale, multi-physics modelling of the pulmonary system,” Philosophical Transactions of the Royal Society of London A: Mathematical, Physical and Engineering Sciences, vol. 366, pp. 3247–3263, 2008. [DOI] [PMC free article] [PubMed] [Google Scholar]
- [31].Lee T-C, Kashyap RL, and Chu C-N, “Building skeleton models via 3-D medial surface axis thinning algorithms,” CVGIP: Graphical Models and Image Processing, vol. 56, pp. 462–478, 1994. [Google Scholar]
- [32].Kerschnitzki M, Kollmannsberger P, Burghammer M, Duda GN, Weinkamer R, Wagermaier W, et al. , “Architecture of the osteocyte network correlates with bone material quality,” Journal of bone and mineral research, vol. 28, pp. 1837–1845, 2013. [DOI] [PubMed] [Google Scholar]
- [33].Weibel ER, Geometry and dimensions of airways of conductive and transitory zones: Springer, 1963. [Google Scholar]
- [34].Tiddens H, Silverman M, and Bush A, “The role of inflammation in airway disease: remodeling,” American journal of respiratory and critical care medicine, vol. 162, pp. S7–S10, 2000. [DOI] [PubMed] [Google Scholar]
- [35].Montaudon M, Desbarats P, Berger P, De Dietrich G, Marthan R, and Laurent F, “Assessment of bronchial wall thickness and lumen diameter in human adults using multi-detector computed tomography: comparison with theoretical models,” Journal of anatomy, vol. 211, pp. 579–588, 2007. [DOI] [PMC free article] [PubMed] [Google Scholar]
- [36].Horsfield K, “Morphometry of the small pulmonary arteries in man,” Circulation research, vol. 42, pp. 593–597, 1978. [DOI] [PubMed] [Google Scholar]
- [37].Horsfield K and Gordon W, “Morphometry of pulmonary veins in man,” Lung, vol. 159, pp. 211–218, 1981. [DOI] [PubMed] [Google Scholar]
- [38].Horsfield K and Thurlbeck A, “Volume of the conducting airways calculated from morphometric parameters,” Bulletin of mathematical biology, vol. 43, pp. 101–109, 1981. [DOI] [PubMed] [Google Scholar]
- [39].Schoonjans T, Brunetti A, Golosio B, del Rio MS, Solé VA, Ferrero C, et al. , “The xraylib library for X-ray–matter interactions. Recent developments,” Spectrochimica Acta Part B: Atomic Spectroscopy, vol. 66, pp. 776–784, 2011. [Google Scholar]
- [40].Segars W, Mahesh M, Beck T, Frey E, and Tsui B, “Realistic CT simulation using the 4D XCAT phantom,” Medical physics, vol. 35, pp. 3800–3808, 2008. [DOI] [PMC free article] [PubMed] [Google Scholar]
- [41].Sauret V, Halson P, Brown I, Fleming J, and Bailey A, “Study of the three-dimensional geometry of the central conducting airways in man using computed tomographic (CT) images,” Journal of anatomy, vol. 200, pp. 123–134, 2002. [DOI] [PMC free article] [PubMed] [Google Scholar]
- [42].Horsfield K and Cumming G, “Angles of branching and diameters of branches in the human bronchial tree,” The Bulletin of mathematical biophysics, vol. 29, pp. 245–259, 1967. [DOI] [PubMed] [Google Scholar]
- [43].Bordas R, Lefevre C, Veeckmans B, Pitt-Francis J, Fetita C, Brightling CE, et al. , “Development and Analysis of Patient-Based Complete Conducting Airways Models,” PloS one, vol. 10, 2015. [DOI] [PMC free article] [PubMed] [Google Scholar]
- [44].Verbeken E, Cauberghs M, Lauweryns J, and Van de Woestijne K, “Anatomy of membranous bronchioles in normal, senile and emphysematous human lungs,” Journal of Applied Physiology, vol. 77, pp. 1875–1884, 1994. [DOI] [PubMed] [Google Scholar]
- [45].Kitaoka H, Takaki R, and Suki B, “A three-dimensional model of the human airway tree,” Journal of Applied Physiology, vol. 87, pp. 2207–2217, 1999. [DOI] [PubMed] [Google Scholar]
- [46].Krause E, Bandt C, Schulz A, and Schulz H, “Fractal exponents for the upper airways of mammalian lungs,” Computational Statistics & Data Analysis, vol. 20, pp. 583–590, 1995. [Google Scholar]
- [47].Davoodi A and Boozarjomehry RB, “Developmental model of an automatic production of the human bronchial tree based on L-system,” Computer methods and programs in biomedicine, vol. 132, pp. 1–10, 2016. [DOI] [PubMed] [Google Scholar]
- [48].Jimenez-Carretero D, Estepar RSJ, Cacio MD, and Ledesma-Carbayo MJ, “Automatic Synthesis of Anthropomorphic Pulmonary CT Phantoms,” bioRxiv, p. 022871, 2015. [DOI] [PMC free article] [PubMed] [Google Scholar]
- [49].Malusek A, Sandborg M, and Carlsson GA, “CTmod—A toolkit for Monte Carlo simulation of projections including scatter in computed tomography,” Computer methods and programs in biomedicine, vol. 90, pp. 167–178, 2008. [DOI] [PubMed] [Google Scholar]
- [50].De Man B, Basu S, Chandra N, Dunham B, Edic P, Iatrou M, et al. , “CatSim: a new computer assisted tomography simulation environment,” in Proc. SPIE, 2007, p. 65102G. [Google Scholar]
- [51].Fung GS, Stierstorfer K, Segars WP, Taguchi K, Flohr TG, and Tsui BM, “XCAT/DRASIM: a realistic CT/human-model simulation package,” in SPIE Medical Imaging, 2011, pp. 79613D–79613D- 6. [Google Scholar]
- [52].Yoder DA, Zhao Y, Paschal CB, and Fitzpatrick JM, “MRI simulator with object-specific field map calculations,” Magnetic resonance imaging, vol. 22, pp. 315–328, 2004. [DOI] [PubMed] [Google Scholar]
- [53].Benoit-Cattin H, Collewet G, Belaroussi B, Saint-Jalmes H, and Odet C, “The SIMRI project: a versatile and interactive MRI simulator,” Journal of Magnetic Resonance, vol. 173, pp. 97–115, 2005. [DOI] [PubMed] [Google Scholar]
- [54].Jochimsen TH, Schäfer A, Bammer R, and Moseley ME, “Efficient simulation of magnetic resonance imaging with Bloch–Torrey equations using intra-voxel magnetization gradients,” Journal of Magnetic Resonance, vol. 180, pp. 29–38, 2006. [DOI] [PubMed] [Google Scholar]
- [55].Zaidi H, “Relevance of accurate Monte Carlo modeling in nuclear medical imaging,” Medical Physics, vol. 26, pp. 574–608, 1999. [DOI] [PubMed] [Google Scholar]
- [56].Buvat I and Lazaro D, “Monte Carlo simulations in emission tomography and GATE: An overview,” Nuclear Instruments and Methods in Physics Research Section A: Accelerators, Spectrometers, Detectors and Associated Equipment, vol. 569, pp. 323–329, 2006. [DOI] [PMC free article] [PubMed] [Google Scholar]
- [57].Sturgeon GM, Kiarashi N, Lo JY, Samei E, and Segars W, “Finite-element modeling of compression and gravity on a population of breast phantoms for multimodality imaging simulation,” Medical physics, vol. 43, pp. 2207–2217, 2016. [DOI] [PMC free article] [PubMed] [Google Scholar]


