Abstract
Background/Objectives
Patients colonized with toxinogenic strains of Clostridium difficile have an increased risk of subsequent infection. Given the potential role of the gut microbiome in increasing the risk of C. difficile colonization, we assessed the diversity and composition of the gut microbiota among long-term care facility (LTCF) residents with advanced dementia colonized with C. difficile.
Design
Retrospective analysis of rectal samples collected during a prospective observational study.
Setting
Thirty-five nursing homes in Boston, Massachusetts.
Participants
Eighty-seven LTCF residents with advanced dementia.
Measurements
Operational taxonomic units were identified using 16S rRNA sequencing. Samples positive for C. difficile were matched to negative controls in a 1:3 ratio and assessed for differences in alpha diversity, beta diversity, and differentially abundant features.
Results
Clostridium difficile sequence variants were identified among 7/87 (8.04%) residents. No patient had evidence of C. difficile infection. Demographic characteristics and antimicrobial exposure were similar between the seven cases and 21 controls. The overall biodiversity among cases and controls was reduced with a median Shannon index of 3.2 (interquartile range 2.7–3.9), with no statistically significant differences between groups. The bacterial community structure was significantly different among residents with C. difficile colonization versus those without and included a predominance of Akkermansia spp., Dermabacter spp., Romboutsia spp., Meiothermus spp., Peptoclostridium spp., and Ruminococcaceae UGC 009.
Conclusion
LTCF residents with advanced dementia have substantial dysbiosis of their gut microbiome. Specific taxa characterized C. difficile colonization status.
Keywords: Microbiome, Advanced dementia, Colonization, Clostridium difficile
Introduction
In the USA, Clostridium difficile is responsible for approximately 500,000 infections annually, resulting in 15,000 deaths [1] and is included on the urgent threat list of the Centers for Disease Control and Prevention (CDC) [2]. The burden of C. difficile infection (CDI) in long-term care facilities (LTCF) is substantial with a nationwide prevalence rate of 1.85/100 LTCF admissions and increased 3-month mortality [3]. The risk of CDI among residents of LTCFs is sevenfold higher compared to individuals in the community [4]. This increased risk is due to multiple risk factors for CDI in this patient population, including advanced age, frequent antimicrobial exposure, multiple comorbidities, and recurrent hospitalizations [3–5].
Recent advances in the study of the microbiome, the bacteria that colonize the human body, have demonstrated that dysbiosis of this commensal bacterial community structure predisposes to CDI and that restoration to a healthier microbiome, through fecal microbiota transplantation, can prevent disease and recurrences [6–11]. In this study, the diversity and composition of the microbiome were characterized among LTCF residents with advanced dementia, a population whose microbiome has not been previously studied. Furthermore, since C. difficile colonization is a prerequisite for infection and is associated with a sixfold higher risk of CDI, [12] this study focused on the microbiome characteristics of LTCF residents with advanced dementia who were colonized with C. difficile.
Methods
Study Population
From 2009 to 2012, the Study of Pathogen Resistance and Exposure to Antimicrobials in Dementia (SPREAD) was conducted in 35 nursing homes [13, 14]. The goals of this study were to quantify and characterize suspected infections, antimicrobial use, and incidence of multidrug-resistant organisms (MDRO). A total of 362 residents with advanced dementia were enrolled. Patient data, including demographics, comorbidities, Bedford Alzheimer Nursing Severity-Subscale (BANS-S), [15] the Test for Severe Impairment (TSI), [16] antimicrobial use, and suspected infections, were recorded at baseline and every 3 months thereafter for 12 months or until death. To determine acquisition rates of MDRO, rectal samples were also collected during these intervals. Results of this study are reported elsewhere [13]. Suspected infections included the presence of diarrhea. If identified during any interval, data pertaining to clinical symptoms, stool cultures, and C. difficile testing were collected. As part of a subanalysis, rectal samples from 87 SPREAD participants, who received antimicrobials prior to sampling (0–9 months), underwent DNA extraction and 16S rRNA analyses (see below) to characterize the microbiome disruption indices (microbiome disruption indices) associated with MDRO acquisition. For the purpose of this study, these rectal samples were also analyzed for the presence of C. difficile sequences. The microbiome of each positive C. difficile stool sample was then compared to three stool samples in which C. difficile was not identified, matched for interval of sample collection.
Specimen Collection and Fecal DNA Extraction
Rectal samples were obtained using a sterile double-tipped swab (Starswab II; Starplex Scientific Inc., Ontario, Canada) inserted into the anus. All samples were placed in a vial containing 20% glycerol within 1–2 h of collection and then stored at – 80 °C for future analyses. Frozen rectal swabs were then thawed and immediately placed into 96-well microtiter plate. Fecal DNA was extracted using the Pow-erSoil DNA Isolation Kit (MOBIO, West Carlsbad CA) according to the manufacturer’s protocol. The concentration of extracted DNA was determined by Nanodrop 1000 (Thermo Scientific, Watham MA), and DNA was stored at – 20 °C until used.
16S rRNA Gene Library Preparation and High-Throughput Sequencing
All samples were amplified and barcoded for multiplex pyrosequencing using primers targeted to the V4 region of the bacterial 16S rRNA gene under uniform PCR conditions that included 3 min at 94 °C and 45 cycles of 45 s at 94 °C, 60 s at 50 °C, and 90 s at 72 °C with final extension for 10 min at 72 °C [17]. We used forward primer (AAT GAT ACG GCG ACC ACC GAG ATC TAC ACT ATG GTA ATT GTG TGC CAG CMG CCG CGG TAA) that includes a 5’ Illumina adaptor, forward primer pad, 2 bp linker, and the 515F 16S rRNA primer and reverse primer (CAA GCA GAA GAC GGC ATA CGA GAT NNNNNNNNNNNN-AGT CAG TCA G-CC-GGA CTA CHV GGG TWT CTA AT) that includes the Illumina 3’ adapter with a 12-nt error-correcting Golay barcode, reverse primer pad, 2 bp linker, and the 806R 16S rRNA primer. We ran PCR in triplicate using 0.2 μM of the primers, 1 μl of template, and 1X HotMasterMix (5 PRIME, Gaithersburg MD) and cleaned the products using a PCR Purification Kit (Qiagen) after pooling. Cleaned PCR products were quantified using the Qubit dsDNA HS Assay Kit (Invitrogen™, Eugene OR) and then adjusted to an optimal molarity, as described [18]. Sequencing was performed using the Illumina MiSeq platform in the New York University Langone Medical Center (NYULMC) Genome Technology Core.
Statistical and Bioinformatic Analysis
Demultiplexed sequences were curated and analyzed using the DADA2 pipeline [19]. Briefly, all the sequences were filtered to truncate the paired reads to 150 nt. in length and eliminate reads with quality values less than 2. Error rates were estimated and corrected by pooling all the reads from the sequencing run, with default parameters. Taxonomy was assigned using the SILVA 123 database. Resulting operational taxonomic units (OTUs) were analyzed using the Phyloseq package in R [20]. Within-sample diversity (alpha diversity) was estimated by calculating the Shannon diversity index (evenness) and the total number of observed species (richness) and then compared between patients colonized with C. difficile or not using nonparametric testing (Wilcoxon rank-sum test). Between-sample diversity (beta diversity) was determined by estimating UniFrac distances between samples. Between-sample distances were visualized using principal coordinates analysis, and sample-clustering patterns were investigated with the ADONIS test. Differentially abundant features between patients colonized with C. difficile or not were compared using the linear discriminant analysis (LDA) effect size (LEfSe) method [21]. An LDA score of 2.0 and an alpha level of 0.05 were used for non-parametric testing between groups.
Results
Clinical Characteristics
Clostridium difficile sequence variants were identified in seven patients (7/87, 8.04%), of whom none had diarrhea or a diagnosis of C. difficile infection. These seven patients (cases) were matched to 21 patients who did not have C. difficile sequence variants (controls). Among these 28 patients, demographics and clinical characteristics were as follows: mean age 89.3 years, male gender 25%, Caucasian 92.9%, diagnosis of diabetes mellitus, chronic obstructive pulmonary disease and congestive heart failure 21.4, 10.7, and 10.7%, respectively, TSI = 0 42.9%, mean BANS-S score 20.8 ± 2.6, hospice care 14.3%, and do not resuscitate orders 82.1%. There were no statistically significant differences between cases and controls in these characteristics (P > 0.05). There were also no differences in types of antimicrobials received between cases and controls (Table 1).
Table 1.
Antimicrobial exposure among residents colonized and not colonized with Clostridium difficile
| Antimicrobial group N (%) | Controls (C. difficile−) N = 21 |
Cases (C. difficile +) N = 7 |
P value |
|---|---|---|---|
| Penicillins | 1 (5) | 0 | 1.00 |
| Extended spectrum penicillins | 3 (14) | 0 | 0.55 |
| First-generation cephalosporins | 3 (14) | 1 (14) | 1.00 |
| Other cephalosporins | 4 (19) | 3 (43) | 0.32 |
| Carbapenems | 1 (5) | 1 (14) | 0.44 |
| Quinolones | 7 (33) | 0 | 0.14 |
| Azithromycin | 1 (5) | 0 | 1.00 |
| Doxycycline | 0 | 0 | – |
| Trimethoprim-sulfameth-oxazole | 2 (10) | 3 (43) | 0.08 |
| Nitrofurantoin | 4 (19) | 1 (14) | 1.00 |
| Gentamicin | 0 | 0 | – |
| Vancomycin | 2 (10) | 0 | 1.00 |
| Linezolid | 0 | 0 | – |
Sequencing Output
A total of seven cases and 21 controls were included in the analysis, yielding a total of 471,689 sequences with a median (IQR) of 17,501.5 (3986). A total of 1602 unique OTUs were identified. C. difficile sequence variants retrieved from cases represented an extremely small proportion of the gut microbiome, with a mean relative abundance of 0.09% ± 0.29.
Alpha Diversity
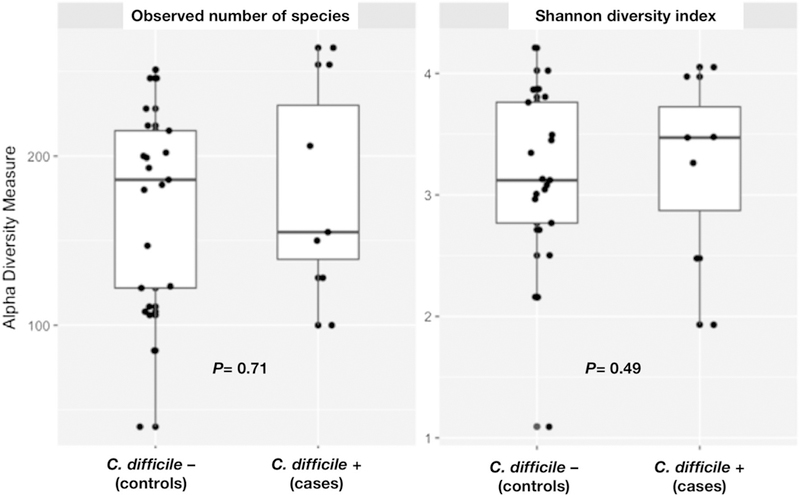
Microbial diversity defined by species richness (number of observed species) and relative abundance within individual samples (evenness) was similar between cases and controls (P > 0.05). Figure 1 shows the comparison of the Shannon diversity index and the total number of observed species (evenness and richness indicators, respectively) between the study groups. The overall median Shannon index was 3.2 (interquartile range [IQR] 2.7–3.9). The index was not significantly different between cases (3.47 [IQR 1.93–4.05]) and controls (3.12 [IQR 1.09–4.2], P = 0.49).
Fig. 1.

Alpha diversity metrics among nursing home residents with and without Clostridium difficile colonization
Beta Diversity
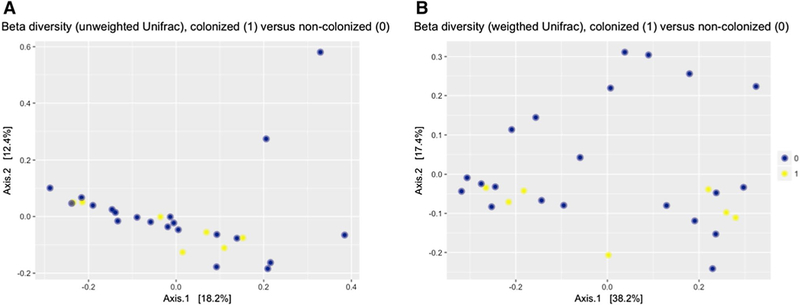
The differences in the fecal microbiome composition among samples belonging to each patient group were similar to the differences observed when comparing the composition of the samples between groups, indicating that no distinct community structure characterized the microbiome of residents colonized with C. difficile or the microbiome of controls. As shown in Fig. 2, no specific sample-clustering patterns were observed when comparing samples grouped according to C. difficile colonization status (P value for weighted and unweighted UniFrac = 0.56 and 0.97, respectively).
Fig. 2.

Beta diversity metrics (unweighted [qualitative] a, weighted b [quantitative]), among nursing home residents with and without Clostridium difficile colonization
Compositional Assessment and Identification of Differentially Abundant Features
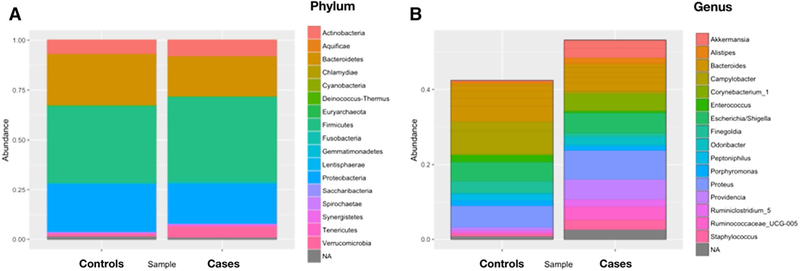
The composition of bacterial taxa at the phylum level did not differ between cases and controls (P > 0.05). In both groups, members of the phylum Firmicutes dominated the fecal microbiota (cases: 42.7%, controls: 38.8%), followed by Bacteroidetes (cases: 20.4%, controls: 26.3%), Proteo- bacteria (cases: 20.8%, controls: 24.9%), and Actinobacteria (cases: 8%, controls: 6.8%). Among the overall population, the more abundant genera (> 5%) were Bacteroides spp. (14.7% ± 15.9), followed by Proteus spp. (6.7% ± 15.6), Campylobacter spp. (6.2% ± 11.5), Corynebacterium spp. (5.9% ± 18.9), and Escherichia/Shigella spp. (5.3% ± 11.4).
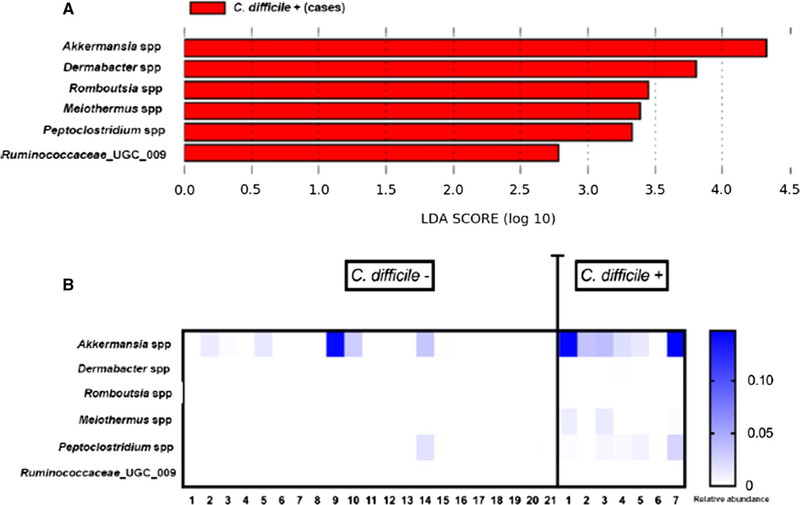
The analysis of differentially abundant features showed that patients colonized with C. difficile had a significantly higher relative abundance of Akkermansia spp., Dermabacter spp., Romboutsia spp., Meiothermus spp., Peptoclostridium spp., and Ruminococcaceae UGC 009 (Fig. 3). Figure 4 shows the composition of the fecal microbiota by C. difficile colonization status at the phylum and genus levels. In the latter, only taxa representing ≥ 1% relative abundance are shown.
Fig. 3.

Analyses of differentially abundant features among nursing home residents with and without Clostridium difficile colonization (LDA score a, heat map b)
Fig. 4.

Comparison of microbiome composition among nursing home residents with and without Clostridium difficile colonization (phylum level a, genus level b)
Discussion
The present study investigated the microbiome diversity and composition of the unique patient population of LTCF residents with advanced dementia, according to C. difficile colonization status. The main findings were that among this patient population, the overall microbiome diversity was substantially reduced and specific compositional characteristics of the microbiome were associated with C. difficile colonization.
Patients with advanced dementia are characterized by increased frailty, multiple comorbidities, and frequent infections [22]. In turn, these characteristics are associated with microbiome dysbiosis and reduced diversity [23, 24]. Thus, it is not surprising that microbiome diversity, as measured by the Shannon index, was substantially reduced in the study population with a value of 3.2, which is substantially lower than reported values of 4.5 among healthy controls [25]. In addition, antimicrobial exposure further contributes to reduced microbial diversity [26]. LTCF residents with advanced dementia are frequently exposed to antimicrobials, with up to 66% receiving at least one course of antimicrobials over a 1-year period [27]. In this study, all subjects were exposed to antimicrobials, further explaining the reduced diversity in the commensal community structure of the microbiome. Differences in diversity were not detected between subjects who were colonized with C. difficile compared to those who were not colonized. The absence of significant differences likely reflects the presence of a severely dysbiotic microbiome in the population of advanced dementia patients who have substantial antimicrobial exposure.
At the phylum level, the composition of the microbi-ome did not differ with regard to C. difficile colonization status, with the majority of taxa belonging to four phyla: Bacteroidetes, Firmicutes, Actinobacteria, and Proteobac-teria. These phyla are also the most common among healthy controls [26]. At the genus level, however, specific differences between subjects who were colonized with C. difficile and controls were identified. The gut microbiome among patients with C. difficile colonization was characterized by a predominance of Akkermansia spp., Dermabacter spp., Romboutsia spp., Meiothermus spp., Peptoclostridium spp., and Ruminococcaceae UGC 009. These taxa may identify a subset of subjects at higher risk of C. difficile colonization. The predominance of Ruminococcaceae spp. is an interesting finding as the depletion of these bacteria has been associated with CDI [28, 29]. Members of this genus produce butyrate, and depletion of which may result in epithelial dysfunction and increased susceptibility to CDI [29]. Since colonized subjects in this study did not develop CDI, Rumi-nococcaceae spp. may have protected against subsequent infection. Validation of this concept, however, will require a longitudinal study of the microbiome composition among C. difficile-colonized subjects, with CDI as the outcome of interest.
Several studies have addressed the microbiome indices associated with C. difficile among LTCF residents or hospitalized patients [25, 30–34]. Comparable to the results of this study, reduced biodiversity of the microbiome in these patient populations was reported. Specific compositional signatures were also identified among subjects with CDI, which differed from the present study [25, 30–34]. However, differences in patient populations and antimicrobial exposure, as well as the fact that our study only investigated colonization with C. difficile, limit the scope for valid comparisons between the microbial community structure characterized in this study and previous reports. Studies are needed to better characterize the microbiome changes that accompany colonization and infection with C. difficile in the high-risk population of LTCF residents with advanced dementia and substantial antimicrobial exposure.
Certain limitations should be considered before interpreting the present findings. First, the sample size was small and data from larger patient cohorts are needed to confirm our findings. Second, C. difficile colonization was determined by 16S sequencing, and not by standard testing. This may raise concerns for a possible misclassification bias as the use of 16S sequencing for this indication has not been formally validated. However, 16S sequencing is a well-standardized technique, and sequences were analyzed using the DADA2 pipeline, which has sufficient resolution for detecting taxa at the species level [19]. Third, for the microbiome analyses, rectal samples were used instead of the more commonly used fecal samples. However, several studies have shown that data obtained from either sampling method are comparable [35, 36].
Preventing C. difficile colonization and CDI would have important implications toward the improvement of outcomes among all LTCF residents. Reconstituting the fecal bacterial community structure to one which represents a healthy microbiome can reduce the risk of recurrence in patients with CDI [10, 11]. The findings of this study suggest that specific microbiome disruption indices may be able to identify subjects at high risk of C. difficile colonization and may assist in the formulation of targeted preventive and therapeutic strategies in the LTCF setting [10, 11].
Acknowledgments
Funding This work has been supported by the National Institute of Allergy and Infectious Diseases (K24 AI119158 [EMCD]), the Centers for Disease Control and Prevention’s investments to combat antibiotic resistance under Award Number 200–2016-91939 (EMCD and RA), NIH-NIA R01 AG032982 (SM, EMCD), and NIH-NIA K24AG033640 (SM).
Footnotes
Compliance with ethical standards
Conflict of interest Juan Ugalde is an employee of uBiome Inc and has received stock options as well as other compensation.
References
- 1.Clostridium difficile infection in 2015. Centers for Disease Control and Prevention (CDC) Available at: https://www.cdc.gov/media/releases/2015/p0225-clostridium-difficile.html. Accessed July 3, 2017. [Google Scholar]
- 2.Antimicrobial resistance. Centers for Disease Control and Prevention (CDC) Available at: https://www.cdc.gov/drugresistance/biggest_threats.html. Accessed July 3, 2017. [Google Scholar]
- 3.Ziakas PD, Joyce N, Zacharioudakis IM, et al. Prevalence and impact of Clostridium difficile infection in elderly residents of long-term care facilities, 2011: a nationwide study. Medicine (Baltimore). 2016;95:e4187. [DOI] [PMC free article] [PubMed] [Google Scholar]
- 4.Karanika S, Grigoras C, Flokas ME, et al. The attributable burden of Clostridium difficile infection to long-term care facilities stay: a Clinical Study. J Am Geriatr Soc. 2017;65:1733–1740. [DOI] [PubMed] [Google Scholar]
- 5.Ziakas PD, Zacharioudakis IM, Zervou FN, et al. Asymptomatic carriers of toxigenic C. difficile in long-term care facilities: a meta-analysis of prevalence and risk factors. PLoS ONE. 2015;10:e0117195. [DOI] [PMC free article] [PubMed] [Google Scholar]
- 6.Vincent C, Manges AR. Antimicrobial use, human gut microbiota and Clostridium difficile colonization and infection. Antibiotics (Basel). 2015;4:230–253. [DOI] [PMC free article] [PubMed] [Google Scholar]
- 7.Theriot CM, Young VB. Interactions between the gastrointestinal microbiome and Clostridium difficile. Annu Rev Microbiol. 2015;69:445–461. [DOI] [PMC free article] [PubMed] [Google Scholar]
- 8.Manges AR, Labbe A, Loo VG, et al. Comparative metagen-omic study of alterations to the intestinal microbiota and risk of nosocomial Clostridum difficile-associated disease. J Infect Dis. 2010;202:1877–1884. [DOI] [PubMed] [Google Scholar]
- 9.Vincent C, Stephens DA, Loo VG, et al. Reductions in intestinal Clostridiales precede the development of nosocomial Clostridium difficile infection. Microbiome. 2013;1:18. [DOI] [PMC free article] [PubMed] [Google Scholar]
- 10.Girotra M, Garg S, Anand R, et al. Fecal microbiota transplantation for recurrent Clostridium difficile infection in the elderly: long-Term outcomes and microbiota changes. Dig Dis Sci. 2016;61:3007–3015. [DOI] [PubMed] [Google Scholar]
- 11.Seekatz AM, Aas J, Gessert CE, et al. Recovery of the gut microbiome following fecal microbiota transplantation. MBio. 2014;5:e00893–00814. [DOI] [PMC free article] [PubMed] [Google Scholar]
- 12.Zacharioudakis IM, Zervou FN, Pliakos EE, et al. Colonization with toxinogenic C. difficile upon hospital admission, and risk of infection: a systematic review and meta-analysis. Am J Gastroenterol. 2015;110:381–390. (quiz 391). [DOI] [PubMed] [Google Scholar]
- 13.Mitchell SL, Shaffer ML, Kiely DK, et al. The study of pathogen resistance and antimicrobial use in dementia: study design and methodology. Arch Gerontol Geriatr. 2013;56:16–22. [DOI] [PMC free article] [PubMed] [Google Scholar]
- 14.Mitchell SL, Shaffer ML, Loeb MB, et al. Infection management and multidrug-resistant organisms in nursing home residents with advanced dementia. JAMA Intern Med. 2014;174:1660–1667. [DOI] [PMC free article] [PubMed] [Google Scholar]
- 15.Volicer L, Hurley AC, Lathi DC, et al. Measurement of severity in advanced Alzheimer’s disease. J Gerontol. 1994;49:M223–M226. [DOI] [PubMed] [Google Scholar]
- 16.Albert M, Cohen C. The Test for Severe Impairment: an instrument for the assessment of patients with severe cognitive dysfunction. J Am Geriatr Soc. 1992;40:449–453. [DOI] [PubMed] [Google Scholar]
- 17.Caporaso JG, Kuczynski J, Stombaugh J, et al. QIIME allows analysis of high-throughput community sequencing data. Nat Methods. 2010;7:335–336. [DOI] [PMC free article] [PubMed] [Google Scholar]
- 18.Iizumi T, Taniguchi T, Yamazaki W, et al. Effect of antibiotic pre-treatment and pathogen challenge on the intestinal microbiota in mice. Gut Pathog. 2016;8:60. [DOI] [PMC free article] [PubMed] [Google Scholar]
- 19.Callahan BJ, McMurdie PJ, Rosen MJ, et al. DADA2: high-resolu-tion sample inference from Illumina amplicon data. Nat Methods. 2016;13:581–583. [DOI] [PMC free article] [PubMed] [Google Scholar]
- 20.McMurdie PJ, Holmes S. phyloseq: an R package for reproducible interactive analysis and graphics of microbiome census data. PLoS ONE. 2013;8:e61217. [DOI] [PMC free article] [PubMed] [Google Scholar]
- 21.Segata N, Izard J, Waldron L, et al. Metagenomic biomarker discovery and explanation. Genome Biol. 2011;12:R60. [DOI] [PMC free article] [PubMed] [Google Scholar]
- 22.Mitchell SL. Advanced dementia. N Engl J Med. 2015;373:1276–1277. [DOI] [PMC free article] [PubMed] [Google Scholar]
- 23.Claesson MJ, Jeffery IB, Conde S, et al. Gut microbiota composition correlates with diet and health in the elderly. Nature. 2012;488:178–184. [DOI] [PubMed] [Google Scholar]
- 24.Lewis BB, Pamer EG. Microbiota-based therapies for Clostridium difficile and antibiotic-resistant enteric infections. Annu Rev Microbiol. 2017;71:157–178. [DOI] [PubMed] [Google Scholar]
- 25.Antharam VC, Li EC, Ishmael A, et al. Intestinal dysbiosis and depletion of butyrogenic bacteria in Clostridium difficile infection and nosocomial diarrhea. J Clin Microbiol. 2013;51:2884–2892. [DOI] [PMC free article] [PubMed] [Google Scholar]
- 26.Kim S, Covington A, Pamer EG. The intestinal microbiota: antibiotics, colonization resistance, and enteric pathogens. Immunol Rev. 2017;279:90–105. [DOI] [PMC free article] [PubMed] [Google Scholar]
- 27.D’ Agata E, Mitchell SL. Patterns of antimicrobial use among nursing home residents with advanced dementia. Arch Intern Med. 2008;168:357–362. [DOI] [PMC free article] [PubMed] [Google Scholar]
- 28.Lee YJ, Arguello ES, Jenq RR, et al. Protective factors in the intestinal microbiome against Clostridium difficile infection in recipients of allogeneic hematopoietic stem cell transplantation. J Infect Dis. 2017;215:1117–1123. [DOI] [PMC free article] [PubMed] [Google Scholar]
- 29.Lawley TD, Walker AW. Intestinal colonization resistance. Immunology. 2013;138:1–11. [DOI] [PMC free article] [PubMed] [Google Scholar]
- 30.Schubert AM, Rogers MA, Ring C, et al. Microbiome data distinguish patients with Clostridium difficile infection and non-C. difficile-associated diarrhea from healthy controls. MBio. 2014;5:e01021–01014. [DOI] [PMC free article] [PubMed] [Google Scholar]
- 31.Zhang L, Dong D, Jiang C, et al. Insight into alteration of gut microbiota in Clostridium difficile infection and asymptomatic C. difficile colonization. Anaerobe. 2015;34:1–7. [DOI] [PubMed] [Google Scholar]
- 32.Milani C, Ticinesi A, Gerritsen J, et al. Gut microbiota composition and Clostridium difficile infection in hospitalized elderly individuals: a metagenomic study. Sci Rep. 2016;6:25945. [DOI] [PMC free article] [PubMed] [Google Scholar]
- 33.Rea MC, O’Sullivan O, Shanahan F, et al. Clostridium difficile carriage in elderly subjects and associated changes in the intestinal microbiota. J Clin Microbiol. 2012;50:867–875. [DOI] [PMC free article] [PubMed] [Google Scholar]
- 34.Chang JY, Antonopoulos DA, Kalra A, et al. Decreased diversity of the fecal Microbiome in recurrent Clostridium difficile-associated diarrhea. J Infect Dis. 2008;197:435–438. [DOI] [PubMed] [Google Scholar]
- 35.Bassis CM, Moore NM, Lolans K, et al. Comparison of stool versus rectal swab samples and storage conditions on bacterial community profiles. BMC Microbiol. 2017;17:78. [DOI] [PMC free article] [PubMed] [Google Scholar]
- 36.Budding AE, Grasman ME, Eck A, et al. Rectal swabs for analysis of the intestinal microbiota. PLoS ONE. 2014;9:e101344. [DOI] [PMC free article] [PubMed] [Google Scholar]


