Abstract
Purpose:
To evaluate the role of PPARγ in regulating meibocyte differentiation and lipid synthesis in a human meibomian gland epithelial cell line (hMGEC).
Methods:
HMGEC were exposed to the PPARγ agonist, Rosiglitazone, from 10–50 μM. Cultures were also exposed to specific PPARγ antagonist, T0070907, to block PPARγ receptor signaling. Cells were then stained with Ki-67 and LipidTox to determine the effects on cell cycling and lipid synthesis, respectively. Expression of meibocyte differentiation related proteins, ADFP, PPARγ, ELOVL4, and FABP4, were evaluated by quantitative PCR and western blotting. A human corneal epithelial cell line (hTCEpi) was used as a control.
Result:
Rosiglitazone significantly decreased Ki-67 staining within 2 days in a dose-dependent manner (P = 0.003) and increased lipid accumulation in hMGEC in a dose dependent manner. T0070907 suppressed both lipid droplet synthesis and cell cycle exit. Rosiglitazone significantly upregulated expression of ADFP, PPARγ, ELOVL4, and FABP4 by 9.6, 2.7, 2.6, and 3.3 fold on average (all P < 0.05 except for FABP4, P = 0.057) in hMGEC. T0070907 significantly abrogated rosiglitazone-induced upregulation of these genes when treated prior to rosiglitazone treatment (all P < 0.05). The observed lipogenic differentiation response was not duplicated in hTCEpi after exposure to rosiglitazone.
Conclusion:
Rosiglitazone induced cell cycle exit and upregulation of lipogenic gene expression leading to lipid accumulation in hMGEC. These effects were suppressed by PPARγ antagonist indicating that PPARγ signaling specifically directs lipogenesis in hMGEC. These findings suggest that PPARγ plays a critical role in meibocyte differentiation.
Keywords: PPAR, MGD, Meibocyte, Meibomian gland
1. Introduction
Meibomian glands (MG) are modified sebaceous, holocrine glands that excrete a lipid rich meibum onto the ocular surface to form the lipid layer of the tear film [1,2]. Alterations in the quantity and/or quality of meibum have been linked to instability of tearfilm, although the causes have yet to be clearly established [3]. Furthermore, the cellular and molecular mechanisms controlling meibocyte differentiation and meibogenesis are poorly understood. Recently, our lab has shown that peroxisome proliferator activator receptor-γ (PPARγ) agonist, rosiglitazone, triggers differentiation and lipogenesis in cultured mouse meibocytes [4]. PPARγ is a lipid sensitive nuclear receptor that is implicated in regulating adipocyte and sebocyte differentiation, as well as lipogenesis [5,6]. Previous studies have documented that downregulation of PPARγ is associated with decreased lipid accumulation and gland atrophy in aged mice and human meibomian glands, suggesting that PPARγ signaling may be involved in modulating meibocyte differentiation [7–9].
Recently, Sullivan and coworkers have established an immortalized human meibomian gland epithelial cell line (hMGEC) [10], which has been used by many investigators to study regulatory mechanisms controlling lipid synthesis in the meibomian gland. Previous studies have shown increased lipid production by hMGEC after treatment with serum [10–12], azithromycin [13], and omega-3/omega-6 fatty acid [14,15]. However, the mechanisms regulating hMGEC differentiation have yet to be identified.
In this study we tested the hypothesis that PPARγ signaling controlled meibocyte differentiation and lipogenesis in hMGEC. We report that PPARγ agonist upregulates lipogenic gene expression leading to lipogenesis in hMGEC, and show that these effects are mediated by specific PPARγ receptor signaling, which can be blocked by treatment with known PPARγ receptor antagonist. Based on these findings, we propose that further understanding of the role of PPARγ receptor signaling in the initiation and induction of meibocyte differentiation may provide new insights into the development of MGD and the elucidation of novel therapeutic strategies to treat dry eye disease.
2. Materials and methods
2.1. Cultivation and differentiation of hMGEC
Immortalized hMGEC, a generous gift from Dr. Sullivan (Schepens Eye Research Institute), was grown in KSFM media (Invitrogen-Gibco, Grand Island, NY) as previously described [10]. At 80% confluency, differentiation was induced by DMEM-F12 (Gibco, Grand Island, NY) supplemented with Epidermal Growth Factor (EGF, 10 ng/ml, Sigma) and various concentrations of PPARγ agonist, rosiglitazone (10–50 μM, Sigma, St. Louis, MO). After determining the maximum dose that induced lipogenesis and meibocyte differentiation, 30 μM rosiglitazone was used to induce meibocyte differentiation to measure gene expression and effects of PPARγ antagonists. Culture media was changed every other day and differentiation conditions were maintained for 1–6 days depending on analysis. For PPARγ signaling studies, a specific PPARγ antagonist, 10 μM of T0070907 (Tocris, Minneapolis, MN) was added 1 h prior to rosiglitazone treatment. As a comparison, gene expression and lipid synthesis following rosiglitazone exposure were also investigated in a human telomerized corneal epithelial cell line (hTCEpi), which were maintained in KGM media (Lonza Walkersville, Inc., Walkersville, MD) as previously described [16].
2.2. Assessment of cell cycling and lipid production
For immunostaining, hMGEC were cultured on a glass coverslip, which were pre-coated with 10% bovine collagen I (Purecol, Advanced BioMatrix, Carlsbad, CA) for 1 h. At 80% confluency, cells were differentiated with 10, 30, and 50 μM rosiglitazone for 2 and 4 days and then stained with Ki-67 to determine the effect on the cell cycling and LipidTox (Invitrogen, Carlsbad, CA) to assess lipid droplet synthesis as previously described [8]. Briefly, after fixation with 2% paraformaldehyde samples were blocked with 1% BSA for 30 min at 37 °C and then incubated with rabbit polyclonal anti-Ki67 antibody (Abcam, Cambridge, MA) for 1 h at 37 °C. Samples were then washed with PBS and incubated with FITC conjugated goat anti-Rabbit IgG (Invitrogen, Carlsbad, CA) for 1 h. For neutral lipid droplet staining, cells were incubated in HCS LipidTox solution (1:500) for 30 min at room temperature. All samples were counterstained with DAPI (300 nM) for 15 min and then imaged with Leica DMI6000B fluorescence microscope. A total of 9 random images from the triplicated coverslip were digitized and then analyzed using Metamorph Image Processing Software (Molecular Devices, Downington, PA). Each image was made by stitching of 4 images covering a 1 mm2 area and 3 areas per coverslip were included for analysis. The number of nuclei positively stained with Ki67 was marked and the total number of nuclei was counted using the cell count subroutine in Metamorph Image Processing Software (Molecular Devices). The labeling index was calculated by dividing the number of positive Ki67 cell nuclei by the total number of cells and multiplying by 100. To calculate the lipid content per cell in each image, the thresholded lipid pixel area was divided by the total number of cells in each image. All coverslips from each experiment were stained and evaluated on the same day to reduce the effects of random variations in staining intensity and imaging.
2.3. RNA isolation and analysis of lipogenic gene expression
mRNA expression of 4 lipogenic genes (ADFP, Adipocyte related differentiation protein, NM_001122.3; ELOVL4, elongation of very long chain fatty acid 4, NM_022726.3; PPARγ, peroxisome proliferator activated receptor gamma, NM_138712.3; FABP4; fatty acid binding protein 4, NM_001442.2) were evaluated using the quantitative real-time PCR as described previously [4]. Briefly, RNA was isolated using the RNeasy Mini Kit following the manufacturer’s instructions (Qiagen, Valencia, CA). RNA quantity and quality was checked with Nanodrop (Thermo Scientific, Wilmington, DE), and 1 μg of RNA was reverse transcribed using oligo dT and random primers as supplied in the QuantiTect Reverse Transcription Kit (Qiagen). Real time PCR was performed using FastStart Essential DNA green master (Roche, Indianapolis, IN) with a Lightcycler 96 system (Roche) and predesigned SYBR green real time PCR primers (KSPQ12012, https://www.sigmaaldrich.com/catalog/product/sigma/kspq12012). Products were evaluated by melt curve analysis and sizing on agarose gels. Relative quantification was performed using the Comparative CT method using both GAPDH and beta actin as the normalizing housekeeper genes.
2.4. Protein extraction and western blotting
Cells were lysed on ice using the Pro-prep™ protein extraction kit (Intron Biotechnology, Korea), and western blot analysis was performed as described previously [4]. Briefly, 20 μg of protein lysates was resolved by 10% Mini-PROTEAN TGX gels (Bio-Rad, Hercules, CA) and transferred to a PVDF membrane (Invitrogen). The membrane was blocked for 1 h in PBS containing 5% skim milk and 0.2% Tween-20 and incubated overnight with primary antibodies for ADFP (Progen biotechnik GmbH, Heidelberg, Germany, Cat# 610102, 1:500 dilution), PPARγ (Thermofisher, Cat# PA3–821A, 1:1000 dilution), ELOVL4 (Proteintech, Rosemont, IL, Cat# 55023–1-AP, 1:500 dilution), and FABP4 (Sigma, Cat# HPA002188, 1:250 dilution). Antibody-reactive proteins were detected by means of the appropriate HRP-conjugated secondary antibodies and an enhanced chemiluminescent substrate (SuperSignal West Pico Chemiluminescent Substrate, Thermos scientific). Immunostained bands were imaged and analyzed with ChemiDoc MP (Bio-Rad) and relative quantitation was done after normalization to GAPDH band in same blots.
2.5. Statistical analysis
All numeric results are reported as mean ± standard error. Differences between groups were assessed by Kruskal-Wallis one-way analysis of variance on ranks and Tukey multiple comparisons (Sigma Stat version 3.11, Systat Software Inc, Point Richmond, CA). All experiments were repeated at least 3 times.
3. Results
3.1. Rosiglitazone a PPARγ agonist induces cell cycle exit in hMGEC
Since cell differentiation requires cell cycle exit, we evaluated Ki-67 labelling after treatment of rosiglitazone to determine if rosiglitazone induced the exit of hMGEC from the cell cycle. Ki-67 is a nuclear protein that is present during all active phases of the cell cycle (G1, S, G2, and mitosis), but is absent from resting cells (G0), and therefore can be used as a marker of the cells undergoing cell division [17]. As shown in Fig. 1, many hMGEC cells cultured in control, differentiation media containing DMEM/F12 with EGF showed positive labelling by Ki-67 (Fig. 1A). By comparison, cells treated with the same media containing rosiglitazone showed almost complete loss of Ki-67 labelling after 4 days in culture (Fig. 1B), and a specific PPARγ antagonist, T0070907, suppressed cell cycle exit (Fig. 1C and D), indicating that activation of PPARγ signaling by rosiglitazone induced cell cycle exit. Quantitation of Ki-67 labeling of hMGEC at different days in culture showed that there was a significant reduction of Ki-67 labeling (P < .001) that ranged from 77%, 86% and 96% following 2 days of treatment with 10 μM, 30 μM and 50 μM respectively (Fig. 1E) that continued to decrease by day 4 after treatment.
Fig. 1.
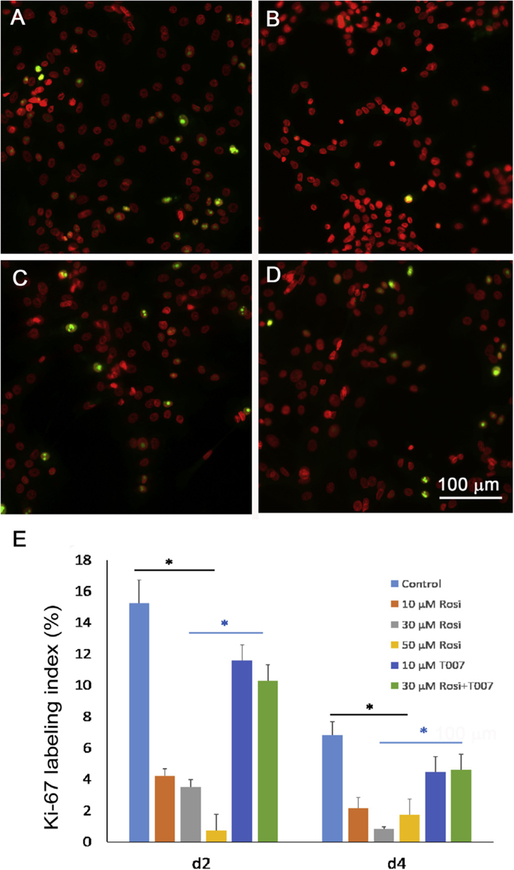
Effect of rosiglitazone on Ki-67 labeling in cultured hMGEC. (A) Control cells, which were grown in DMEM/F12 with EGF for 4d showed about 15% positive labeling (green) and (B) cells treated with rosiglitazone showed almost complete loss of Ki67 labeling. (C) Cells treated with a PPARγ antagonist T0070907 showed about 11% positive labeling and (D) cells treated with T0070907 and rosiglitazone showed similar labelling. (E) Bar graph showing labeling index for cells treated with different concentrations (10, 30, and 50 μM) of rosiglitazone, T0070907, and T0070907 plus rosiglitazone (30 μM) for 2d to 4d. There was a significant decrease in Ki-67 labeling at 2d to 4d after treatment with rosiglitazone in a time and concentration dependent manner. Cells treated with T0070907 showed significantly greater positive labeling than cells treated with rosiglitazone (P < 0.05).
3.2. Rosiglitazone induced lipid droplet accumulation via PPARγ signaling in hMGEC
To determine the optimal concentration of rosiglitazone required to induce lipid droplet formation, we compared lipid production in cells cultured with various concentration of rosiglitazone (10–50 μM) for 6d (Fig. 2). Cells grown under DMEM/F12/EGF media showed only few lipid droplets (Fig. 2A), and there was a significant increase of lipid production in cells treated with rosiglitazone (Fig. 2B:10 μM, 2C: 30 μM, 2D: 50 μM) as compared to control. As shown in Fig. 2E, there was a dose-dependent increase of lipid production by cells treated with rosiglitazone that peaked at 30 μM with no further increase at higher concentrations.
Fig. 2.
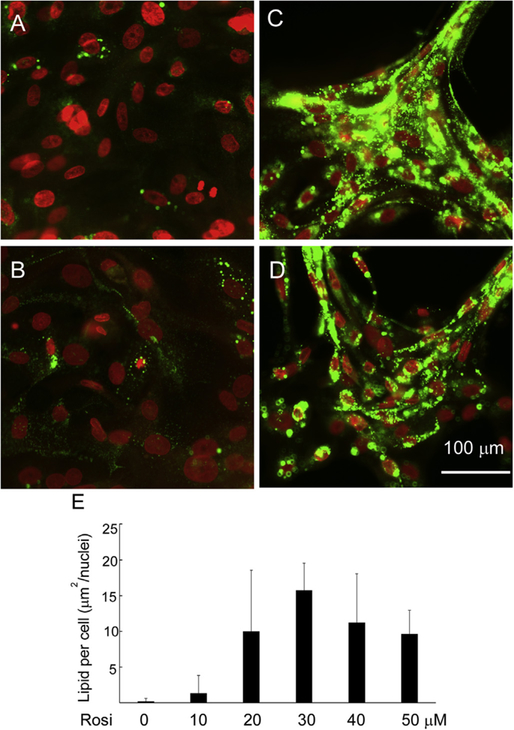
Effect of concentration of rosiglitazone on lipid synthesis in hMGEC. (A) Cultured in DMEM/F12/EGF, (B) Cultured in DMEM/F12/EGF with 10 μM Rosiglitazone, (C) Cultured in DMEM/F12/EGF with 30 μM Rosiglitazone, (D) Cultured in DMEM/F12/EGF with 50 μM Rosiglitazone, (E) Bar graph showing a significant increase of lipid synthesis in cells cultured in DMEM/F12/EGF with rosiglitazone in a concentration dependent manner with a peak response at 30 μM. There was no further increase of lipid droplet production in cells treated with 40 μM and 50 μM of rosiglitazone.
We compared effects of different differentiation conditions on lipid droplet formation after 2d to 6d in culture. As shown in Fig. 3, cells cultured in DMEM/F12 supplemented with EGF showed only few positive lipid droplets mainly around isolated nuclei (A–C). Adding 10% serum a previously described differentiation media, did not induce a significant increase in lipid droplet formation (D–F). Furthermore, there was no increase of lipid production over time in cells cultured in serum containing differentiation media. By comparison, cells cultured with DMEM/F12 supplemented with EGF and 30 μM rosiglitazone showed a remarkable accumulation of lipid droplets, which significantly increased in number of lipid droplets over time (G–I).
Fig. 3.
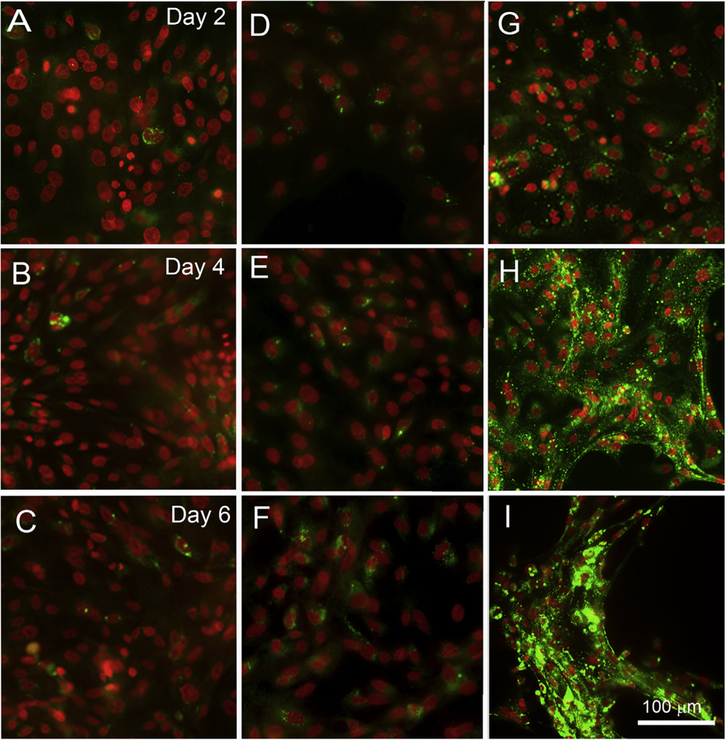
Comparison of lipid droplet formation in hMGEC cultured with various differentiation conditions. (A–C) Cultured in DMEM/F12 with EGF, (D–F) Cultured in DMEM/F12/EGF +10% FBS, and (G–I) Cultured in DMEM/F12/EGF with 30 μM Rosiglitazone. Cells grown under 10% FBS media showed little lipid production, and did not increase lipid production from 2d to 6d culture (D–F). By comparison, a remarkable increase in production of lipid droplets over time was observed in cells treated with rosiglitazone (G–I).
To evaluate whether this process was dependent on PPARγ signaling, cells were treated with PPARγ antagonist, T0070907. As shown in Fig. 4, rosiglitazone significantly increased the production of lipid droplets, while T0070907 alone showed no lipid production. Interestingly, pretreatment with T0070907 followed by rosiglitazone did not increase lipid droplet formation, indicating that enhanced lipid synthesis was due to specific PPARγ signaling. Fig. 4E shows that there was a significant difference in lipid production between cells treated with rosiglitazone and all other conditions (P < 0.001).
Fig. 4.
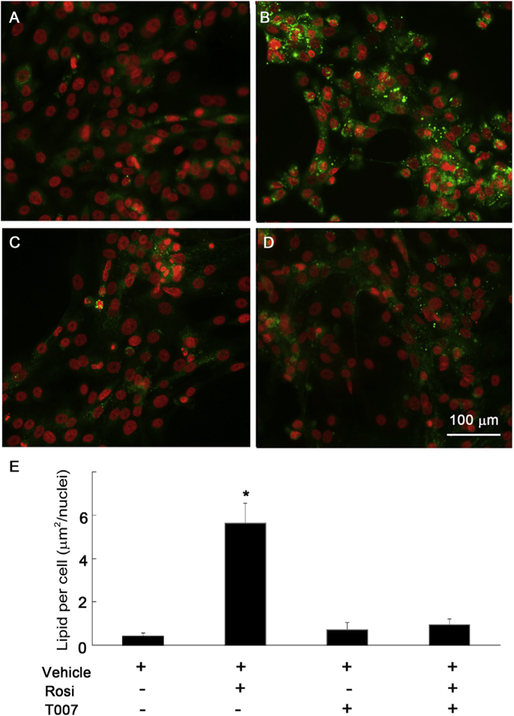
Effect of PPARγ signaling on lipid production after 4d in culture. (A) Control cells cultured in DMEM/F12 with EGF. (B) Cells treated with rosiglitazone (30 μM) alone produced a marked increase in lipid droplets. (C) Cells treated with T0070907 (10 μM), a specific PPARγ antagonist showed no lipid droplets. (D) Cells treated with T0070907 and rosiglitazone showed a significant suppression of lipid droplet accumulation. (E) Bar graphs showing that there was a significant difference in lipid production between cells treated with rosiglitazone and cells cultured under all other condition (*: P < 0.001 for comparison between cells cultured with rosiglitazone and all other conditions).
3.3. Rosiglitazone induces expression of lipogenic genes and proteins via PPARγ signaling in hMGEC, but not in hTCEpi
We evaluated expression of four PPARγ responsive genes using quantitative real time PCR after treatment with rosiglitazone and PPARγ antagonist T0070907. As shown in Fig. 5, rosiglitazone significantly upregulated mRNAs in hMGEC encoding ADFP (Fig. 5A), PPARG (Fig. 5B), ELOVL4 (Fig. 5C), and FABP4 (Fig. 5D) by 9.6, 2.7, 2.6, and 3.3 folds on average, respectively (all P < 0.05 except for FABP4, which was P = 0.057). Treatment of HMGEC with PPARγ antagonist, T0070907, significantly abrogated the PPARγ-induced upregulation of all four of these genes while having no significant effect on basal gene expression. These findings indicated that transcriptional upregulation of these genes are directly induced by PPARγ receptor signaling. By comparison, rosiglitazone treatment of hTCEpi cells increased mRNA encoding ADFP (Fig. 5E), but this upregulation was not suppressed by PPARγ antagonist, suggesting a non-PPARγ signaling response. For other PPARγ dependent response genes, there was no significant effect on the expression by rosiglitazone (Fig. 5F–H) and lipid synthesis (data not shown). This data indicates that upregulation of lipid synthesis by PPARγ signaling is specific for hMGEC and not for other ocular epithelial cells. To evaluate whether PPARγ signaling also induced expression of meibocyte related proteins, we conducted western blotting for ADFP, PPARγ, ELOVL4, and FABP4 proteins after cells were treated with PPARγ agonist or antagonist for 2d. Expression of ADFP, PPARγ, ELOVL4, and FABP4 proteins were significantly upregulated after treatment with rosiglitazone by 2.8, 1.7, 1.6, and 1.9 folds, respectively, and this upregulation was suppressed when cells were treated with the specific PPARγ antagonist, T0070907 (Fig. 6).
Fig. 5.
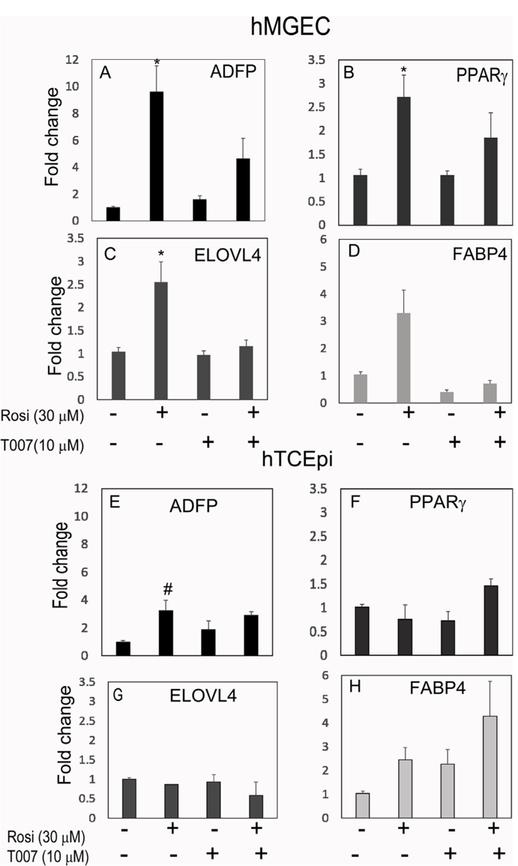
Effect of PPARγ signaling on mRNA expressions of ADFP, PPARγ, ELOVL4, and FABP4 in hMGEC (A–D) and in hTCEpi (E–H). Rosiglitazone significantly upregulated expression of (A) ADFP, (B) PPARγ, (C) ELOVL4, and (D) FABP4 by 9.6, 2.7, 2.6, and 3.3 folds on average, respectively (all P < 0.05 except for FABP4, P = 0.057) in hMGEC. A PPARγ antagonist T0070907 significantly abrogated rosiglitazone-induced upregulation of these genes to the similar level with control group when treated prior to rosiglitazone treatment. (E–H) This PPARγ responsive regulation was not observed in hTCEpi. Rosiglitazone increased mRNA of ADFP (#: P = 0.027), but this upregulation was not suppressed by T0070907 (A–D; n = 9 and E–H; n = 6).
Fig. 6.
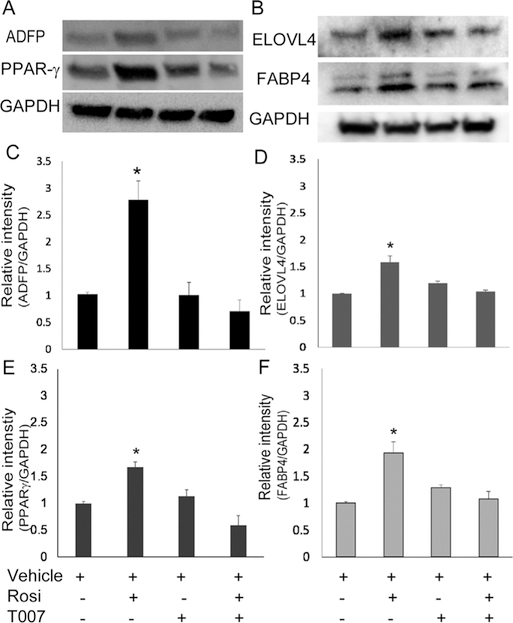
Effect of PPARγ signaling on ADFP, PPARγ, ELOVL4 and FABP4 protein expression. (A, B) Western blotting showed that rosiglitazone upregulated ADFP, PPARγ, ELOVL4, and FABP4 protein expression in hMGEC and T0070907 significantly abrogated upregulation of these proteins induced by activation of PPARγ signaling when treated prior to rosiglitazone. (C–F) Bar graphs showed that rosiglitazone significantly upregulated expression of ADFP, PPARγ, ELOVL4, and FABP4 proteins by 2.8, 1.7, 1.6, and 1.9 folds on average (all P < 0.05), which were significantly decreased in cells treated with PPARγ antagonist T0070907 similar to control cells (n = 4).
4. Discussion
PPARγ signaling, which was originally identified as an antidiabetic pathway, has since been implicated in numerous cellular functions such as adipocyte differentiation, sebocyte differentiation, anti-inflammation, and anti-proliferation [18–20]. Previously, our group has identified altered PPARγ localization and post-translational modification in aged mice and human meibomian glands, suggesting a role for PPARγ signaling in the modulation of meibomian gland differentiation and function during aging [7–9]. A recent study using cultured mouse meibocytes has also shown that PPARγ receptor signaling induced by PPARγ agonists regulates lipid production and post-translational modification of PPARγ [4]. The current study extends these findings to a human telomerized meibomian gland epithelial cell line and further defines the role of PPARγ signaling in controlling meibocyte differentiation and lipid production through regulating meibocyte cell cycle exit and expression of specific meibocyte genes involved in lipid synthesis. Our findings further establish that specific PPARγ receptor signaling initiates lipid synthesis by meibocytes as indicated by the observation that PPARγ receptor antagonists block lipid accumulation and gene upregulation related with lipid production. Finally, these effects appear to be specific for hMGEC since treatment of corneal epithelial cells by PPARγ agonists does not result in lipid synthesis or upregulation of PPARγ response genes.
Research on meibocytes and meibogenesis has been accelerated over a past decade, due in part to immortalization and characterization of a human meibomian gland cell line, hMGEC [10]. In vivo, meibocytes differentiate from basal acinar cells and accumulate lipid. During the maturation process, meibocytes continue to accumulate lipid vesicles and then undergo cellular disintegration and the release of a lipidrich, meibum that is excreted onto the ocular surface through meibomian gland duct [2,21]. For in vitro analyses of meibocyte differentiation, this process must be simulated. Previous studies have used a DMEM/F12, EGF and serum to induce meibocyte differentiation and lipid accumulation in hMGEC [12], but recent studies that have evaluated the lipid profile of serum stimulated hMGEC show sparse accumulation of lipid and the synthesis of non-meibum specific lipid classes [2,22,23]. Furthermore, Hampel et al. reported that serum increased expression cytokeratin 1, 5, and 6, concluding that serum culture transforms hMGEC to keratinizing epithelial cells [22]. Lack of response to sex hormone has also been raised [24]. Many different culture protocols have been tested to enhance lipid accumulation and differentiation, and some factors such as omega-3 fatty acid (eicosahexanoic acid, EPA) and azithromycin added to serum have shown increased lipid production [13–15], indicating that lipid production and meibocyte differentiation could be modulated in culture by exogenous factors. However, our knowledge of the signaling pathway that is associated with meibocyte differentiation and lipid production are very limited. Micro mRNA array analysis revealed significant alteration of genes from various signaling pathways such as Janus kinase (JAK)-signal transducer and activator of transcription (stat) cascades and mammalian target of rapamycin (mTOR), Wnt, and PPAR-signaling, but none of these pathways have been investigated in detail [12,25]. A recent paper reported an important role of Notch signaling in hMGEC in serum-derived differentiation process [26].
In this study we have investigated the role of PPARγ signaling in modulating differentiation and lipid production in hMGEC. Our findings strongly suggest that PPARγ plays a critical role in lipid production and meibocyte differentiation in hMGEC. Activation of PPARγ signaling by PPARγ agonist significantly enhanced lipid production in both a time and dose dependent manner, and upregulation and downregulation of selected PPAR responsive genes by PPARγ agonist and antagonist further confirmed the modulating role of PPARγ signaling in the process of meibocyte differentiation and lipid production.
The adipose differentiation related protein (ADFP) was first characterized as molecule that is expressed early in adipocyte differentiation and has served as a marker of lipid accumulation in diverse cell types [4]. ELOVL4 is the component of the fatty acid (FA) elongation system and it is known to be highly expressed in the tarsal plate of human and mice [2]. Considering that meibum lipids consist of very long chain FA, modulation of ELOVL4 expression by PPARγ signaling could have clinical implications in the development of MGD. Fatty acid binding protein 4 (FABP4) or adipocyte FABP, was first detected in adipose tissue. Expression of FABP4 is known to be highly induced during adipocyte differentiation and transcriptionally controlled by PPARγ agonists. Fatty acid binding proteins are a family of small, highly conserved, cytoplasmic proteins that bind long-chain fatty acids and other hydrophobic ligands. It is thought that FABP’s role includes fatty acid uptake, transport, and metabolism [27]. PPARG encodes PPARγ, nuclear receptor that binds peroxisome proliferators such as hypolipidemic drugs and fatty acids. Once activated by a ligand, the nuclear receptor binds to DNA specific PPAR response elements (PPRE) and modulates the transcription of its target genes [5]. It is a key regulator of adipocyte differentiation and glucose homeostasis.
Our qPCR and WB results demonstrated that expression of these mRNAs and proteins were upregulated or downregulated by modulating PPARγ signaling, and this was in agreement with findings of lipid production. Interestingly, PPARγ activation stimulates lipid droplet accumulation in hMGEC, but not in hTCEpi as assessed by LipidTox staining (data not shown). Furthermore, PPARγ responsive mRNA regulations were not duplicated in hTCEpi cell line indicating that these findings are specific to hMGEC and potentially to meibocyte differentiation rather than a general response that is observed in all epithelial cells.
5. Conclusion
Our data demonstrated that rosiglitazone, a PPARγ agonist, induces cell cycle exit and upregulation of lipogenic gene expression leading to lipid accumulation in hMGEC. These effects were suppressed by PPARγ antagonist indicating that PPARγ signaling specifically directs lipogenesis in hMGEC. Based on these findings, we hypothesize that PPARγ is a pivotal regulator in meibocyte differentiation. Identifying the major upstream and downstream modifiers of PPARγ signaling may provide novel approaches for treating MGD.
Acknowledgements
Funding
This work was supported in part by NIH/NEI EY021510, an Unrestricted Grant from Research to Prevent Blindness, Inc. RPB-203478, and the Skirball program in Molecular Ophthalmology and basic science research program through the National Research Foundation of Korea funded by the Ministry of Education, Science and Technology (2017R1D1A3B03036549).
Footnotes
Disclosure
The authors have no commercial interest in any concept or product discussed in this article.
References
- [1].Knop E, Knop N, Millar T, Obata H, Sullivan DA. The international workshop on meibomian gland dysfunction: report of the subcommittee on anatomy, physiology, and pathophysiology of the meibomian gland. Invest Ophthalmol Vis Sci 2011;52:1938–78. [DOI] [PMC free article] [PubMed] [Google Scholar]
- [2].Butovich IA. Meibomian glands, meibum, and meibogenesis. Exp Eye Res 2017;163:2–16. [DOI] [PMC free article] [PubMed] [Google Scholar]
- [3].Willcox MDP, Argueso P, Georgiev GA, Holopainen JM, Laurie GW, Millar TJ, et al. TFOS DEWS II tear film report. Ocul Surf 2017;15:366–403. [DOI] [PMC free article] [PubMed] [Google Scholar]
- [4].Jester JV, Potma E, Brown DJ. PPARgamma regulates mouse meibocyte differentiation and lipid synthesis. Ocul Surf 2016;14:484–94. [DOI] [PMC free article] [PubMed] [Google Scholar]
- [5].Janani C, Ranjitha Kumari BD. PPAR gamma gene–a review. Diabetes, Metab. Syndrome 2015;9:46–50. [DOI] [PubMed] [Google Scholar]
- [6].Dozsa A, Dezso B, Toth BI, Bacsi A, Poliska S, Camera E, et al. PPARgamma-mediated and arachidonic acid-dependent signaling is involved in differentiation and lipid production of human sebocytes. J Invest Dermatol 2014;134:910–20. [DOI] [PubMed] [Google Scholar]
- [7].Nien CJ, Massei S, Lin G, Nabavi C, Tao J, Brown DJ, et al. Effects of age and dysfunction on human meibomian glands. Arch Ophthalmol 2011;129:462–9. [DOI] [PMC free article] [PubMed] [Google Scholar]
- [8].Nien CJ, Paugh JR, Massei S, Wahlert AJ, Kao WW, Jester JV. Age-related changes in the meibomian gland. Exp Eye Res 2009;89:1021–7. [DOI] [PMC free article] [PubMed] [Google Scholar]
- [9].Jester JV, Brown DJ. Wakayama Symposium: peroxisome proliferator-activated receptor-gamma (PPARgamma) and meibomian gland dysfunction. Ocul Surf 2012;10:224–9. [DOI] [PMC free article] [PubMed] [Google Scholar]
- [10].Liu S, Hatton MP, Khandelwal P, Sullivan DA. Culture, immortalization, and characterization of human meibomian gland epithelial cells. Invest Ophthalmol Vis Sci 2010;51:3993–4005. [DOI] [PMC free article] [PubMed] [Google Scholar]
- [11].Liu S, Kam WR, Ding J, Hatton MP, Sullivan DA. Effect of growth factors on the proliferation and gene expression of human meibomian gland epithelial cells. Invest Ophthalmol Vis Sci 2013;54:2541–50. [DOI] [PMC free article] [PubMed] [Google Scholar]
- [12].Sullivan DA, Liu Y, Kam WR, Ding J, Green KM, Shaffer SA, et al. Serum-induced differentiation of human meibomian gland epithelial cells. Invest Ophthalmol Vis Sci 2014;55:3866–77. [DOI] [PMC free article] [PubMed] [Google Scholar]
- [13].Liu Y, Kam WR, Ding J, Sullivan DA. Effect of azithromycin on lipid accumulation in immortalized human meibomian gland epithelial cells. JAMA ophthalmology 2014;132:226–8. [DOI] [PMC free article] [PubMed] [Google Scholar]
- [14].Liu Y, Kam WR, Sullivan DA. Influence of omega 3 and 6 fatty acids on human meibomian gland epithelial cells. Cornea 2016;35:1122–6. [DOI] [PMC free article] [PubMed] [Google Scholar]
- [15].Hampel U, Kruger M, Kunnen C, Garreis F, Willcox M, Paulsen F. In vitro effects of docosahexanoic and eicosahexanoic acid on human meibomian gland epithelial cells. Exp Eye Res 2015;140:139–48. [DOI] [PubMed] [Google Scholar]
- [16].Robertson DM, Li L, Fisher S, Pearce VP, Shay JW, Wright WE, et al. Characterization of growth and differentiation in a telomerase-immortalized human corneal epithelial cell line. Invest Ophthalmol Vis Sci 2005;46:470–8. [DOI] [PubMed] [Google Scholar]
- [17].Bruno S, Darzynkiewicz Z. Cell cycle dependent expression and stability of the nuclear protein detected by Ki-67 antibody in HL-60 cells. Cell Prolif 1992;25:31–40. [DOI] [PubMed] [Google Scholar]
- [18].Zinman B PPAR gamma agonists in type 2 diabetes: how far have we come in ‘preventing the inevitable’? A review of the metabolic effects of rosiglitazone. Diabetes Obes Metabol 2001;3(1):S34–43. [PubMed] [Google Scholar]
- [19].Michalik L, Wahli W. Peroxisome proliferator-activated receptors (PPARs) in skin health, repair and disease. Biochim Biophys Acta 2007;1771:991–8. [DOI] [PubMed] [Google Scholar]
- [20].Krishnan A, Nair SA, Pillai MR. Biology of PPAR gamma in cancer: a critical review on existing lacunae. Curr Mol Med 2007;7:532–40. [DOI] [PubMed] [Google Scholar]
- [21].Hwang HS, Parfitt GJ, Brown DJ, Jester JV. Meibocyte differentiation and renewal: insights into novel mechanisms of meibomian gland dysfunction (MGD). Exp Eye Res 2017;163:37–45. [DOI] [PMC free article] [PubMed] [Google Scholar]
- [22].Hampel U, Schroder A, Mitchell T, Brown S, Snikeris P, Garreis F, et al. Serum-induced keratinization processes in an immortalized human meibomian gland epithelial cell line. PLoS One 2015;10 e0128096. [DOI] [PMC free article] [PubMed]
- [23].Hampel U, Garreis F. The human meibomian gland epithelial cell line as a model to study meibomian gland dysfunction. Exp Eye Res 2017;163:46–52. [DOI] [PubMed] [Google Scholar]
- [24].Schroder A, Abrar DB, Hampel U, Schicht M, Paulsen F, Garreis F. In vitro effects of sex hormones in human meibomian gland epithelial cells. Exp Eye Res 2016;151:190–202. [DOI] [PubMed] [Google Scholar]
- [25].Khandelwal P, Liu S, Sullivan DA. Androgen regulation of gene expression in human meibomian gland and conjunctival epithelial cells. Mol Vis 2012;18:1055–67. [PMC free article] [PubMed] [Google Scholar]
- [26].Gidfar S, Afsharkhamseh N, Sanjari S, Djalilian AR. Notch signaling in meibomian gland epithelial cell differentiation. Invest Ophthalmol Vis Sci 2016;57:859–65. [DOI] [PMC free article] [PubMed] [Google Scholar]
- [27].Furuhashi M, Saitoh S, Shimamoto K, Miura T. Fatty acid-binding protein 4 (FABP4): pathophysiological insights and potent clinical biomarker of metabolic and cardiovascular diseases. Clin Med Insights Cardiol 2014;8:23–33. [DOI] [PMC free article] [PubMed] [Google Scholar]


