Abstract
Objective:
To evaluate CT texture analysis (CTTA) for non-invasively staging of hepatic fibrosis (stages F0-F4) in a cohort of patients with hepatitis C virus (HCV).
Methods:
Quantitative texture analysis of the liver was performed on abdominal multidimensional CT scans. Single slice region of interest measurements of the total liver, Couinaud segments IV–VIII and segments I–III were made. CT texture parameters were tested against stage of hepatic fibrosis in segments IV–VIII on the portal venous phase. Texture parameters were correlated with biopsy performed within 1 year for all cases with intermediate fibrosis (F0–F3).
Results:
CT scans of 556 adults (360 males, 196 females; mean age, 49.8 years), including a healthy control group (F0, n = 77) and patients with hepatitis C virus and Stage 0 disease (n = 49), and patients with increasing stages of fibrosis (F1, n = 80; F2 n = 99; F3 n = 87; F4 n = 164) were evaluated. Mean gray level intensity increased with increasing fibrosis. For significant fibrosis (≥F2), mean showed receiver operatingcharacteristic area under the curve (AUC) of 0.80 with sensitivity and specificity of 74 and 75% using a threshold of 0.44, with similar receiver operatingcharacteristic AUC and sensitivity/specificity for advanced fibrosis (≥F3). Skewness and kurtosis were inversely associated with hepatic fibrosis, most prominently in cirrhotic patients. A multivariate model combining these four texture features (mean, mpp, skewness and kurtosis) showed slightly improved performance with AUC of 0.82, 0.82 and 0.86 for any fibrosis (F0 vs F1–F4), significant fibrosis (F0–1 vs F2–4) and advanced fibrosis (F0–2 vs F3–4) respectively.
Conclusion:
CT texture features may be associated with hepatic fibrosis and have utility in staging fibrosis, particularly at advanced levels.
Advances in knowledge:
CTTA may be helpful in detecting and staging hepatic fibrosis, particularly at advanced levels. CT measures like CTTA can be retrospectively evaluated without special equipment.
Introduction
CT is a workhouse modality for a spectrum of abdominal imaging indications where liver disease may or may not be suspected.1 Given the growing interest in non-invasive biomarkers for liver disease, the widespread incidence of liver disease, and the sheer number of CTs performed, there has been an emergence of a variety of CT imaging biomarkers for evaluating the presence and extent of hepatic fibrosis.2–15 A variety of non-invasive techniques exist for the assessment of hepatic fibrosis, most notably elastography techniques which can be performed on ultrasoundS and MRI, which assess hepatic stiffness as a surrogate for fibrosis and have been shown to be accurate for significant and advanced fibrosis. However, these require prospective acquisition, often with specific equipment, and with failure rates up to 15% even in expert hands.16–22 Many of the reported CT imaging parameters can be easily retrospectively performed without special equipment, and allow more objective quantification of known morphologic changes in liver disease.23–28 For example, it is well known that liver surface nodularity develops in patients with cirrhosis, but historically this has been challenging to capture and quantify, particularly in early stages of disease. A novel tool has emerged that allows quantification of liver surface nodularity, and several studies have shown that this is useful in stratifying stages of fibrosis (including earlier stages of fibrosis) and can predict decompensation in patients with cirrhosis.13–15
CT texture analysis (CTTA) is another non-invasive tool that has shown some promise in the assessment of liver disease in pooled cause cohorts.4,12 In these prior studies, CT texture parameters, including mean gray level intensity, showed some association with intermediate stages of fibrosis, with an area under the curve (AUC) of 0.78 for detection of the presence of any fibrosis (F0 vs F1–F4) and increased with increasing fibrosis.12 CTTA is a tool used to quantify spatial heterogeneity within a given region of interest, which can be difficult to identify visually. Within the region of interest, an analysis of the distribution and relationship of pixel or voxel gray levels in the image are assessed and quantified based on the pixel histogram.29–32 It is easily applied retrospectively to CT images. With the recent advances in treatment now available for hepatitis C, there is a growing demand for non-invasive ways to assess hepatic fibrosis in this cohort, both prior to and following treatment. There is also some suggestion that the morphology of the liver may be different with different underlying causes of liver disease. The purpose of this study is a natural extension of prior work in pooled-cause cohorts, to apply texture analysis to a hepatitis C virus (HCV) specific population, where the results may be highly applicable, to assess efficacy in identifying fibrosis, particularly intermediate stage fibrosis in this group of patients.
Methods and Materials
This retrospective study was HIPAA compliant and IRB approved. The requirement for signed informed consent was waived.
Patient population
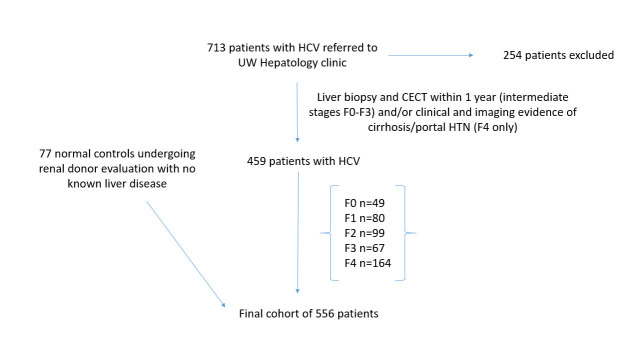
A retrospective search of the institutional Hepatology database and medical record review yielded approximately 713 consecutive patients with known hepatitis C virus who were evaluated at the University of Wisconsin Hospital and Clinics. Inclusion criteria included adult patients with HCV, with both a liver biopsy and contrast enhanced CT performed within 1 year for intermediate stages of fibrosis (F0–F3). For the F4 group, either a liver biopsy or imaging and electronic medical review by an experienced abdominal radiologist demonstrating clear imaging evidence of cirrhosis and portal hypertension, defined cause/risk factors for liver disease, and complication of liver disease (hepatic encephalopathy, variceal bleed) . A total of 459 patients with hepatitis C virus met these criteria and were included. In addition, normal controls derived from consecutive patients undergoing CT evaluation for renal donation with no known liver disease were included (Figure 1). The final cohort consisted of 556 adult patients (360 M, 196 F, mean age 49.8 years). This cohort included patients with varying stages of hepatic fibrosis (METAVIR stages F0-F4),33 ranging from normal controls (F0, n = 77) and patients with HCV and stage 0 disease (n = 49) through intermediate stages of fibrosis (F1, n = 80; F2, n = 99; F3, n = 67) to end stage cirrhosis (F4, n = 164). Of the cirrhotic cohort, 78 had a liver biopsy within a year of CT and 86 had definitive clinical and imaging findings of cirrhosis and/or portal hypertension as outlined above and based on our institutional criteria. Variable portions of this cohort participated in separate investigations of hepatosplenic volume changes, surface nodularity and a pooled CTTA assessment of liver disease from multiple causes.5,11,12,15,34 In this cohort, aside from the normal group, all patients had known HCV based on HCV screening with ELISA antibody testing followed by confirmation with serum HCV PNA PCR.
Figure 1.
Flowchart for patient inclusion in the study. CECT, contrast enhanced CT; HCV, hepatitis C virus. UW, University of Wisconsin.
MDCT technique
All CT scans were obtained on multidimensional CT scanners (16–64 detector). The specific CT protocol may have varied slightly based on the indication (i.e. triphasic liver for transplant evaluation, routine portal venous exam for variety of indications, multiphasic exam for renal donor evaluation). However, images from different phase of contrast were not pooled. For the texture analysis measurement, portal venous phase images only were used from all of the exams, using patient size based scan parameters (auto-mA, kV 100–140). Images were reconstructed with 5 mm slice thickness at 3 mm intervals in almost all cases. A subgroup of patients had non-contrast CT studies or both non-contrast and portal venous studies (Table 1) but given the paucity of intermediate stage fibrosis in these groups, only those with portal venous phase images were analyzed. The radiation dose associated with the CT performed was variable based on patient size and CT protocol, but were all kept as low as reasonably achievable. The risk of the radiation dose associated with a single CT (not present with MR and ultrasound elastography techniques) is considered very low and is likely outweighed by potential diagnosis and staging of liver disease in adults.35,36
Table 1.
Demographic characteristics and fibrosis stage of the cohort by CT technique
| Pooled cohort | Portal venous phase | Non-contrast phase | Both | |
| M | 360 | |||
| F | 196 | |||
| Mean age | 49.8 years | |||
| Metavir fibrosis stage | ||||
| 4 | 164 | 194 | 51 | 48 |
| 3 | 87 | 86 | 12 | 10 |
| 2 | 99 | 96 | 9 | 6 |
| 1 | 80 | 77 | 6 | 3 |
| 0 | 49 | 47 | 5 | 3 |
| Normal | 77 | 77 | 77 | 77 |
| Total | 556 | 543 | 160 | 147 |
CT texture analysis
CTTA was performed and analyzed in the liver as detailed previously by our group.12 Texture analysis was performed by single trained reader under the supervision of two abdominal radiologists (10 years, 20 years experience respectively). Single slice images selected at the level of the porta hepatis were transferred to a commercially available texture analysis program (TexRAD Ltd, Somerset, UK). A region of interest (ROI) was manually delineated on a single slice at the level of the hepatic hilum to include the entire liver (but exclude the major vessels) for a total liver measurement (Figure 1). A second ROI was drawn around the left lateral lobe and caudate (Couinaud segments I–III) with a third drawn around the medial left lobe and right lobe (Couinaud segments IV–VIII). This geographic evaluation of segments I–III v s IV–VIII was based on the subjective morphologic patterns of hypertrophy and atrophy respectively seen in cirrhosis and prior work quantifying these segmental changes (liver segmental volume ratio).5,37 Based on prior work looking at CTTA for hepatic fibrosis, analysis was largely focused on the evaluation of segments IV–VIII.38 Although the ROI is manually drawn, much of the subsequent analysis is automated and performed by the software as detailed below.
The way the software extracts texture features has been described in detail in other studies.39 The software utilizes an initial filtration step using Laplacian of Gaussian spatial band-pass filter to selectively extract features of different sizes and intensity variation.40 This produces a series of derived images that show features ranging from fine (spatial scaling factor, ssf, 0–2, approximately 4 pixels in width, object radius approximately 2 mm) to coarse (ssf 5–6, approximately 12 pixels in width, object radius approximately 6 mm) texture (Figure 2).32,41 The software output includes a variety of histogram characteristics including mean gray level intensity, standard deviation of the pixel histogram (SD), entropy, mean of the positive pixels (mpp), skewness (asymmetry) of the pixel histogram, and kurtosis (pointedness) of pixel histogram at each spatial scaling factor. These values were recorded for each study and subsequently analyzed. Texture features were then evaluated for associations with METAVIR fibrosis stage.
Figure 2.
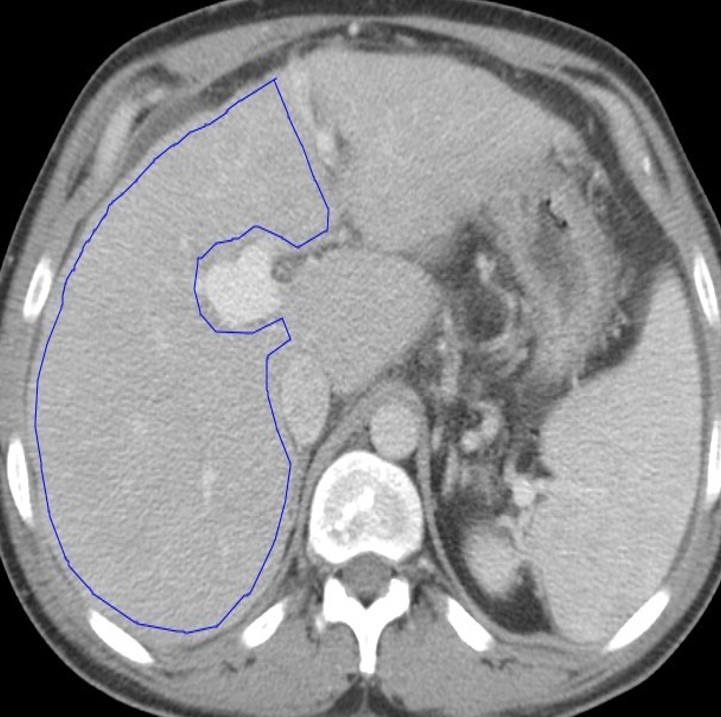
CT texture analysis measurements: A single slice ROI was drawn around the total liver, segments I–III (not shown), and segments IV–VIII (A). The analysis was performed on data from segments IV–VIII based on prior work. Texture maps were generated, where pink and red dots represent positive pixels and blue and purple dots represent negative pixel. The software used has a filtration step that allows features to be grouped into fine (B), medium (C), and coarse (D) sizes based on spatial scaling factors. A pixel histogram is also generated for the ROI and analyzed. ROI, region of interest.
Lab values within the 1 year window including the biopsy and CT were collected where available, in a total of 467 patients. Lab values collected included AST, ALT, platelet count, and were used to calculate APRI and FIB-4 scores.42–49
Statistical analysis
Examination of boxplots and Spearman rank correlations were used as a data reduction step to select features which are most highly associated with fibrosis stage. Prior evaluation of CT texture features in a pooled cohort38 was also used for identifying candidate variables. Summary statistics (mean, SD, median and interquartile range) for the selected features were calculated separately for each patient cohort according to stage of hepatic fibrosis. A Kruskal–Wallis test was used to assess differences in texture characteristics among the discrete F0–F4 cohorts. The most clinically relevant cut-offs for significant hepatic fibrosis (≥F2), advanced fibrosis (≥F3) and cirrhosis (≥F4) were also evaluated. Receiver operating characteristic curves were obtained for each candidate metric and AUC was calculated with DeLong 95% CI. Exploratory cut-offs for fibrosis categories were derived from receiver operatingcharacteristic analysis. A multivariable logistic regression model was fit using the selected variables to examine the performance in a multivariate setting. A value of p < 0.05 (two-sided) was the criteria for statistical significance. All statistical analyses were performed with the R program (v. 3.3.1, R Core Team 2016).
Results
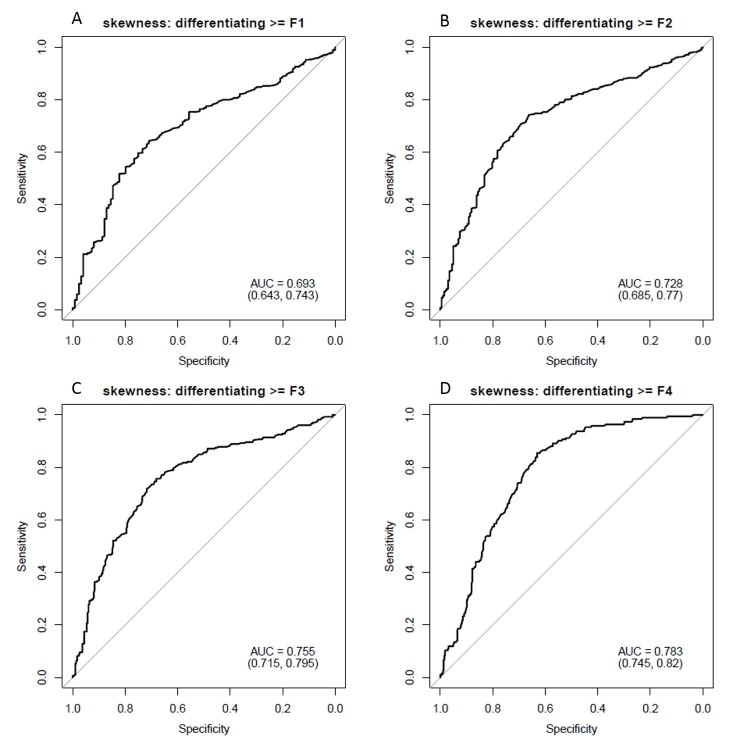
The demographic details of the cohort and stages of fibrosis are included in Table 1. Mean gray level intensity of the pixel histogram in segments IV–VIII on portal venous phase imaging increased with increasing degree of hepatic fibrosis (Figure 3). Although this was seen across all spatial scaling factors and feature sizes, it was most prominent with medium-sized features (ssf 3). Mean gray level values for ssf3 were 0.20 ± 0.41, 0.51 ± 0.67, 0.54 ± 0.69, 0.75 ± 0.69, and 2.07 ± 1.61 for F0–F4 fibrosis stages respectively (p < 0.05). When detecting the presence of any fibrosis (F0 vs F1–F4), it showed an AUC of 0.81 (0.77, 0.85). Using a threshold of 0.3, a sensitivity of 78% and specificity of 73% was seen. For detecting significant fibrosis (≥F2), and AUC of 0.8 (0.76, 0.83) was seen and with a threshold of 0.44, sensitivity and specificity was 74 and 75% respectively. For advanced fibrosis (≥F3), an AUC of 0.82 with sensitivity/specificity of 78%/73% at a threshold of 0.54 was noted (Figure 4). A similar but slightly less strongly associated trend was seen with mean of the positive pixels (mpp) and entropy. Entropy was more strongly associated with fibrosis in the previously reported pooled cohort, but here seemed to delineate the presence of any fibrosis (F0 vs F1–F4) best. As noted previously in the pooled cohort, skewness and to a lesser extent kurtosis was inversely related to the presence of fibrosis (decreasing skewness and kurtosis with increasing degree of fibrosis, Figure 5). The average skewness in the F4 group was 0.32 ± 1.5, significantly lower than the F0–F3 group which showed an average skewness of 1.48 ± 1.30 (p < 0.001). For skewness, an AUC of 0.73 was seen for significant fibrosis (≥F2) and 0.76 for advanced fibrosis (≥F3). For advanced fibrosis, a threshold of 1.44 yielded a sensitivity of 76% and specificity of 68% (Figure 6) (Table 2).
Figure 3.
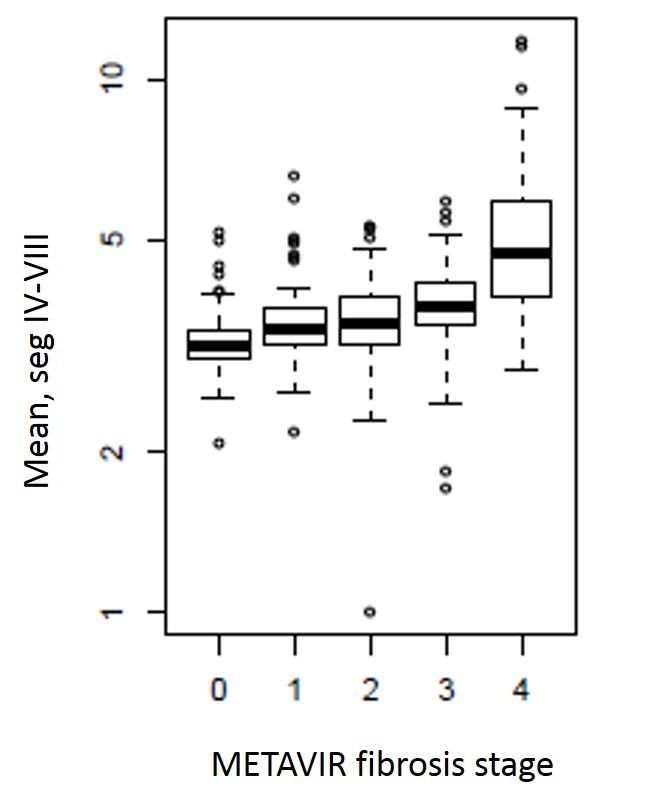
Box and whisker plot showing mean gray level intensity values on the y-axis and METAVIR fibrosis stage on the x-axis. Measurements were obtained in the portal venous phase in segments IV–VIII, and values of mean gray level intensity increase with increasing stage of fibrosis. This relationship was seen across all spatial scaling factors, but was strongest for medium-sized features (ssf 3, shown here).
Figure 4.
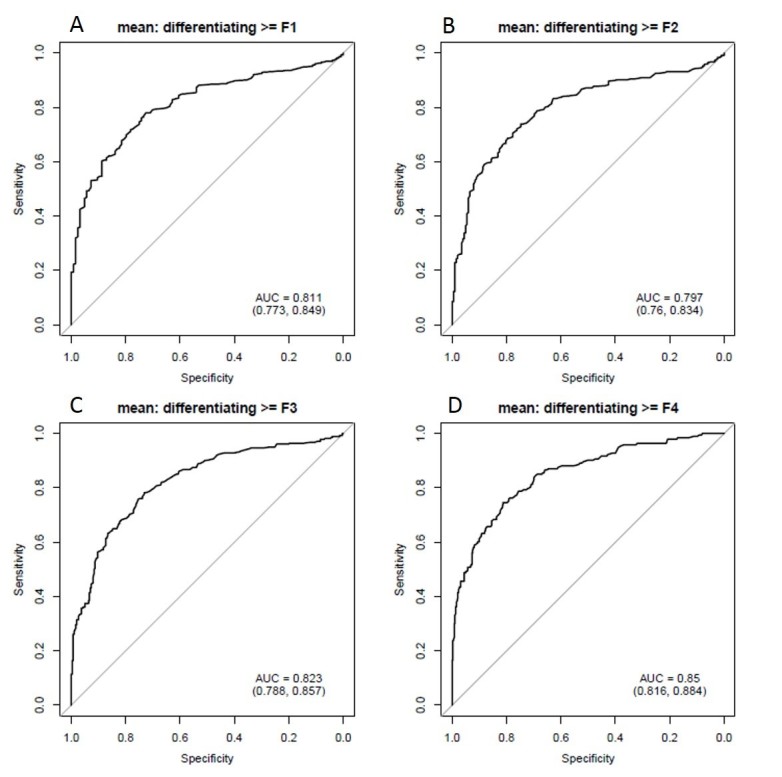
Diagnostic performance of mean gray level intensity for identifying hepatic fibrosis on portal venous phase images in segments IV–VIII. ROC AUC plots for mean gray level intensity in predicting hepatic fibrosis. Top left panel (A) demonstrates detection of any fibrosis (AUC 0.81), top right (B) shows significant fibrosis (≥F2, AUC 0.8), lower left (C) shows advanced fibrosis (≥F3, AUC 0.82) and bottom right (D) shows cirrhosis (0.85). AUC, area under the curve; ROC, receiver operatingcharacteristic.
Figure 5.
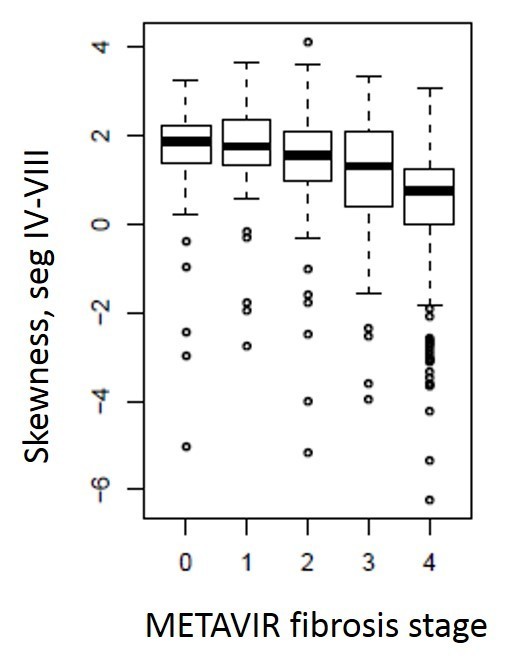
Box and whisker plot of METAVIR fibrosis stage as stratified by skewness values measured in the portal venous phase in segments IV-VIII. Skewness values decrease with increasing fibrosis. Although this trend was seen at all feature sizes, it was strongest in the coarse filters (ssf 6, shown here).
Figure 6.
Diagnostic performance of skewness in predicting degree of hepatic fibrosis. ROC AUCs demonstrate values of 0.69 for identifying any fibrosis (top left panel, (A), 0.73 for significant fibrosis (≥F2, top right panel, (B), 0.76 for advanced fibrosis (≥F3, lower left panel, (C), and 0.78 for cirrhosis (lower right panel, (D). This association was most prominent at coarse filter levels (ssf 6, shown here). AUC, area under the curve; ROC, receiver operatingcharacteristic.
Table 2.
Diagnostic performance of texture features in predicting stage of liver fibrosis
| Texture parameter | Fibrosis stage | Threshold | Sensitivity | Specificity | AUC | Lower CI | Upper CI |
| Mean (ssf 3) | F0 vs F1-F4 | 0.3 | 0.78 | 0.73 | 0.81 | 0.77 | 0.85 |
| F0-1 vs F2-4 | 0.44 | 0.74 | 0.75 | 0.80 | 0.76 | 0.83 | |
| F0-2 vs F3-4 | 0.54 | 0.78 | 0.73 | 0.82 | 0.79 | 0.86 | |
| F0-3 vs F4 | 0.9 | 0.75 | 0.81 | 0.85 | 0.82 | 0.88 | |
| Mpp | F0 vs F1-F4 | 98.4 | 0.3 | 0.9 | 0.58 | 053 | 0.63 |
| F0-1 vs F2-4 | 100.3 | 0.35 | 0.87 | 0.62 | 0.58 | 0.67 | |
| F0-2 vs F3-4 | 107.2 | 0.55 | 0.76 | 0.67 | 0.63 | 0.72 | |
| F0-3 vs F4 | 106.4 | 0.54 | 0.71 | 0.63 | 0.58 | 0.68 | |
| Skewness | F0 vs F1-F4 | 1.5 | 0.64 | 0.71 | 0.69 | 0.64 | 0.74 |
| F0-1 vs F2-4 | 1.6 | 0.74 | 0.66 | 0.73 | 0.68 | 0.77 | |
| F0-2 vs F3-4 | 1.4 | 0.76 | 0.68 | 0.76 | 0.71 | 0.80 | |
| F0-3 vs F4 | 1.4 | 0.85 | 0.63 | 0.78 | 0.75 | 0.82 | |
| Kurtosis | F0 vs F1-F4 | 4.5 | 0.4 | 0.87 | 0.61 | 0.56 | 0.65 |
| F0-1 vs F2-4 | 5.7 | 0.54 | 0.79 | 0.65 | 0.60 | 0.69 | |
| F0-2 vs F3-4 | 4.6 | 0.51 | 0.82 | 0.66 | 0.61 | 0.70 | |
| F0-3 vs F4 | 4.6 | 0.61 | 0.79 | 0.71 | 0.66 | 0.76 |
AUC, area under the curve; CI, confidence interval;
All measurements were performed in the portal venous phase in segments IV-VIII. Mean at spatial scaling factor 3 (medium filter), mpp at ssf 0, skewness and kurtosis at ssf 6 (coarse filter).
Multivariable logistic regression was used to create a model combining mean, mpp, skewness and kurtosis to predict hepatic fibrosis. For detection of any fibrosis, this group of texture parameters demonstrated an AUC 0f 0.82, for significant fibrosis (≥F2) an AUC of 0.82 and for advanced fibrosis (≥F3) an AUC of 0.86, improved over any individual texture feature alone (Table 3).
Table 3.
Diagnostic performance of Multivariate texture model including mean, mpp and skewness for predicting stage of fibrosis
| Variable | Fibrosis stage | AUC | CI, lower | CI, upper |
| Mean, mpp, skewness | F0 vs F1-F4 | 0.81 | 0.78 | 0.85 |
| F0-1 vs F2-4 | 0.81 | 0.78 | 0.85 | |
| F0-2 vs F3-4 | 0.86 | 0.82 | 0.89 | |
| F0-3 vs F4 | 0.88 | 0.85 | 0.91 |
AUC, area under the curve; CI, confidence interval;
All measurements were performed in the portal venous phase, segments IV–-VIII. Mean at spatial scaling factor 3 (medium), mpp at ssf 0, skewness at ssf 6 (coarse).
The majority of patients had laboratory values obtained during the prescribed time frame (1 year period with CT, biopsy and liver function tests) and APRI and FIB-4 scores were calculated. The mean APRI score was 5.31 ± 9.2 (median 2.3, range 0.3–82.6) and mean FIB-4 score was 2.5 ± 6.6 (median 0.9, range 0–96.4) in this cohort. The APRI score had an AUC of 0.68 for detecting any fibrosis, 0.72 for significant fibrosis (≥F2), and 0.78 for advanced fibrosis (≥F3). FIB-4 performed slightly better, with AUCs of 0.73, 0.75 and 0.81 for any fibrosis, significant fibrosis and advanced fibrosis respectively (Figure 7, Table 4).
Figure 7.
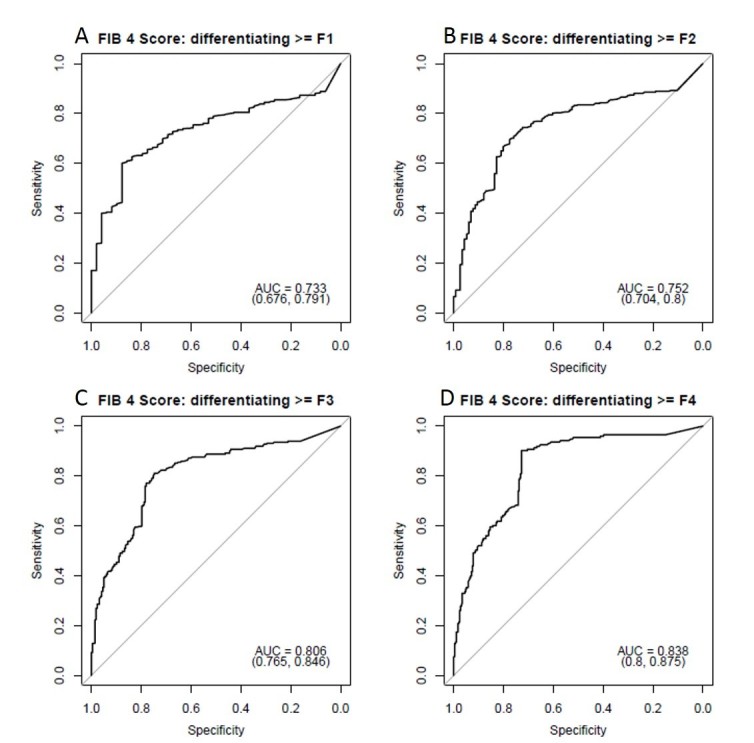
Diagnostic performance of FIB-4 lab score for predicting hepatic fibrosis. ROC AUC values for FIB-4 scores were 0.73 for identifying any fibrosis (A), 0.75 for significant fibrosis (≥F2, (B), 0.81 for advanced fibrosis (≥F3, (C) and 0.84 for cirrhosis (D). The FIB-4 score performed slightly better than the APRI score. AUC, area under the curve; ROC, receiver operatingcharacteristic.
Table 4.
Diagnostic performance of FIB-4 and APRI scores for predicting stage of liver fibrosis
| Lab test | Fibrosis Stage | Threshold | Sensitivity | Specificity | AUC | CI, lower | CI, upper |
| FIB-4 | F0 vs F1-F4 | 89.5 | 0.6 | 0.88 | 0.73 | 0.68 | 0.79 |
| F0-1 vs F2-4 | 82.5 | 0.70 | 0.78 | 0.75 | 0.70 | 0.80 | |
| F0-2 vs F3-4 | 89.5 | 0.81 | 0.75 | 0.81 | 0.77 | 0.85 | |
| F0-3 vs F4 | 105.5 | 0.9 | 0.73 | 0.84 | 0.80 | 0.88 | |
| APRI | F0 vs F1-4 | 65.5 | 0.56 | 0.82 | 0.68 | 0.62 | 0.74 |
| F0-1 vs F2-4 | 78.5 | 0.58 | 0.79 | 0.72 | 0.67 | 0.76 | |
| F0-2 vs F3-4 | 89.5 | 0.66 | 0.82 | 0.78 | 0.74 | 0.82 | |
| F0-3 vs F4 | 90.5 | 0.79 | 0.77 | 0.83 | 0.79 | 0.87 |
AUC, area under the curve; CI, confidence interval;
Discussion
CTTA is a tool that is easily retrospectively applied to CT images that shows some promise in identifying and quantifying hepatic fibrosis. The results of this study in an HCV-specific population are similar to those seen in prior pooled-cause cohorts. The assessment of significant fibrosis (≥F2) is particularly important in the HCV cohort as this threshold is used to determine who is eligible for treatment. A non-invasive test to determine whether significant fibrosis is present would be of high clinical utility, particularly if it can be retrospectively performed, and may spare the patient a more invasive and expensive test like biopsy. This may expedite treatment for many patients and it is possible these types of tests could be used to monitor treatment response, an area of potential future research. CT texture features including mean gray level intensity and to a lesser extent entropy increase with increasing level of fibrosis, and show an AUC of 0.8 for detecting significant fibrosis with a sensitivity and specificity of 74 and 75% respectively using a threshold of 0.44 for mean gray level intensity. Skewness and kurtosis were seen to decrease with increasing levels of fibrosis, particularly with more advanced disease. In a model combining the four most promising texture features (mean gray level intensity, mean of the positive pixels, skewness and kurtosis), the AUC was slightly improved to 0.82 for detecting significant fibrosis. Although this is slightly below the diagnostic accuracy reported for MR elastography techniques (0.88–0.98 in meta-analyses),18,50,51 CT is often lower cost, faster, more accessible and does not require a prospective technique or special equipment. Previous CT scans can be retrieved and compared for changes over time. CTTA performs as well or better than a battery of lab tests that are currently seeing routine clinical use as noted in our current cohort. Although morphologic changes can be subjectively assessed, these tend to occur most prominently in later stages of fibrosis, making subjective reader assessment generally less reproducible and accurate than objective quantifiable measures, particularly in intermediate stages of fibrosis.
Similarly, CTTA does not perform quite as well as some other CT metrics currently being explored. Liver surface nodularity showed an AUC of 0.90 for detecting significant fibrosis with a sensitivity and specificity of 80 and 80% respectively using a threshold of 2.3815 with similar results seen in an HCV-specific cohort.34 However, liver surface nodularity is more limited in the detection of very early disease (F0-F1), where CTTA may have added utility. Similarly, measurements looking at regional hepatic volume changes, such as liver segmental volume ratio showed an AUC of 0.85 for detecting significant fibrosis, which improved to 0.91 when it was taken in combination with splenic volume.11 Since each of these can easily be retrospectively measured, it makes sense to combine what may be complementary indices in a multiparametric approach, which is an area of ongoing and future work.52 For patients who have CT and elastography evaluation, comparison and/or combination of these results into a multimodality, multiparametric evaluation could also be performed.
In both the HCV specific cohort and the pooled cohort, it seemed that mean gray level intensity and mean of the positive pixels increased with increasing fibrosis. It makes sense that particularly on post-contrast images, fibrosis, collagen and increased extracellular space may show increased attenuation values compared to normal hepatic parenchyma.2,53 Similarly, entropy may increase as there is more heterogeneity of the tissue (fibrous tissue interspersed with normal parenchyma). The decrease in kurtosis may be due to this increase in heterogeneity, with more pixels of varying attenuations present, flattening the curve. Similarly, a negatively skewed pixel distribution is shifted in the direction of the positive pixels, which goes along with these proposed changes.12,32
As above, while CT images can be retrospectively, CT does require utilization of ionizing radiation and in our study, iodinated contrast. Although the risk for harm is low and likely outweighed by the potential benefits of identifying and staging liver disease, these factors should be taken into consideration when choosing a non-invasive modality to stage liver disease.
There are limitations to this study. For the commercial software used, only a single slice of the liver could be assessed, rather than a multislice or volumetric measurement. Although there are data to suggest that this is sufficient, it has been suggested by some that more data may be better.54,55 Similarly, the statistical analysis of a large data set can be challenging, and because of the volume of data, can lead to increased risk of type I error. However, the recurrence of the same themes in this cohort compared to the prior pooled cohort suggest that these associations may be real.12 Finally, in a cohort this size, there is some small heterogeneity in the CT technique, which could affect texture parameters. All patients analyzed had images obtained in the portal venous phase of contrast, but there was mild variability in the scanner vendor and kV in some cases. The software tool used has a filtration step which is meant to filter out some of the differences in technique and emphasize biologic heterogeneity, but this is not fail proof and it is not entirely clear how much different factors impact texture measurements or which texture features are most resistant to differences in technique. This needs to be an area of continued investigation to identify which texture features are most robust and reproducible. In addition, biopsy and pathologic result were used as the gold-standard in this study. There can be sampling error, making this an imperfect reference standard. Although many of these patients also had standard lab values, many did not have other tests such as Fibroscan or elastography for comparison. This type of comparison could be an additional area of future work.
In conclusion, CTTA shows some promise in identifying significant hepatic fibrosis in an HCV-specific cohort, performing better than combined serum tests currently in use, but slightly below some other CT-based metrics. However, CTTA is easily retrospectively obtained and may be complementary to these other CT metrics. In the future, a multiparametric CT approach may be best.
Contributor Information
Meghan G Lubner, Email: MLubner@uwhealth.org.
Daniel Jones, Email: djones35@wisc.edu.
John Kloke, Email: kloke@biostat.wisc.edu.
Adnan Said, Email: axs@medicine.wisc.edu.
Perry J Pickhardt, Email: ppickhardt2@uwhealth.org.
REFERENCES
- 1. Moreno CC, Hemingway J, Johnson AC, Hughes DR, Mittal PK, Duszak R. Changing abdominal imaging utilization patterns: perspectives from medicare beneficiaries over two decades. J Am Coll Radiol 2016; 13: 894–903. doi: 10.1016/j.jacr.2016.02.031 [DOI] [PubMed] [Google Scholar]
- 2. Bandula S, Punwani S, Rosenberg WM, Jalan R, Hall AR, Dhillon A, et al. Equilibrium contrast-enhanced CT imaging to evaluate hepatic fibrosis: initial validation by comparison with histopathologic sampling. Radiology 2015; 275: 136–43. doi: 10.1148/radiol.14141435 [DOI] [PubMed] [Google Scholar]
- 3. Bonekamp D, Bonekamp S, Geiger B, Kamel IR. An elevated arterial enhancement fraction is associated with clinical and imaging indices of liver fibrosis and cirrhosis. J Comput Assist Tomogr 2012; 36: 681–9. doi: 10.1097/RCT.0b013e3182702ee3 [DOI] [PubMed] [Google Scholar]
- 4. Daginawala N, Li B, Buch K, Yu H, Tischler B, Qureshi MM, et al. Using texture analyses of contrast enhanced CT to assess hepatic fibrosis. Eur J Radiol 2016; 85: 511–7. doi: 10.1016/j.ejrad.2015.12.009 [DOI] [PubMed] [Google Scholar]
- 5. Furusato Hunt OM, Lubner MG, Ziemlewicz TJ, Muñoz Del Rio A, Pickhardt PJ. The Liver Segmental Volume Ratio for Noninvasive Detection of Cirrhosis: Comparison With Established Linear and Volumetric Measures. J Comput Assist Tomogr 2016; 40: 478–84. doi: 10.1097/RCT.0000000000000389 [DOI] [PMC free article] [PubMed] [Google Scholar]
- 6. Giorgio A, Amoroso P, Lettieri G, Fico P, de Stefano G, Finelli L, et al. Cirrhosis: value of caudate to right lobe ratio in diagnosis with US. Radiology 1986; 161: 443–5. doi: 10.1148/radiology.161.2.3532188 [DOI] [PubMed] [Google Scholar]
- 7. Gülberg V, Haag K, Rössle M, Gerbes AL. Hepatic arterial buffer response in patients with advanced cirrhosis. Hepatology 2002; 35: 630–4. doi: 10.1053/jhep.2002.31722 [DOI] [PubMed] [Google Scholar]
- 8. Guo SL, Su LN, Zhai YN, Chirume WM, Lei JQ, Zhang H, et al. The clinical value of hepatic extracellular volume fraction using routine multiphasic contrast-enhanced liver CT for staging liver fibrosis. Clin Radiol 2017; 72: 242–6. doi: 10.1016/j.crad.2016.10.003 [DOI] [PubMed] [Google Scholar]
- 9. Lamb P, Sahani DV, Fuentes-Orrego JM, Patino M, Ghosh A, Mendonça PR. Stratification of patients with liver fibrosis using dual-energy CT. IEEE Trans Med Imaging 2015; 34: 807–15. doi: 10.1109/TMI.2014.2353044 [DOI] [PubMed] [Google Scholar]
- 10. Lv P, Lin X, Gao J, Chen K. Spectral CT: preliminary studies in the liver cirrhosis. Korean J Radiol 2012; 13: 434–42. doi: 10.3348/kjr.2012.13.4.434 [DOI] [PMC free article] [PubMed] [Google Scholar]
- 11. Pickhardt PJ, Malecki K, Hunt OF, Beaumont C, Kloke J, Ziemlewicz TJ, et al. Hepatosplenic volumetric assessment at MDCT for staging liver fibrosis. Eur Radiol 2017; 27: 3060–8. doi: 10.1007/s00330-016-4648-0 [DOI] [PubMed] [Google Scholar]
- 12. Lubner MG, Malecki K, Kloke J, Ganeshan B, Pickhardt PJ. Texture analysis of the liver at MDCT for assessing hepatic fibrosis. Abdom Radiol 2017; 42: 2069–78. doi: 10.1007/s00261-017-1096-5 [DOI] [PubMed] [Google Scholar]
- 13. Smith AD, Branch CR, Zand K, Subramony C, Zhang H, Thaggard K, et al. Liver Surface Nodularity Quantification from Routine CT Images as a Biomarker for Detection and Evaluation of Cirrhosis. Radiology 2016; 280: 771–81. doi: 10.1148/radiol.2016151542 [DOI] [PubMed] [Google Scholar]
- 14. Smith AD, Zand KA, Florez E, Sirous R, Shlapak D, Souza F, et al. Liver Surface Nodularity Score Allows Prediction of Cirrhosis Decompensation and Death. Radiology 2017; 283: 711-722. doi: 10.1148/radiol.2016160799 [DOI] [PubMed] [Google Scholar]
- 15. Pickhardt PJ, Malecki K, Kloke J, Lubner MG. Accuracy of Liver Surface Nodularity Quantification on MDCT as a Noninvasive Biomarker for Staging Hepatic Fibrosis. AJR Am J Roentgenol 2016; 207: 1194–9. doi: 10.2214/AJR.16.16514 [DOI] [PubMed] [Google Scholar]
- 16. Friedrich-Rust M, Nierhoff J, Lupsor M, Sporea I, Fierbinteanu-Braticevici C, Strobel D, et al. Performance of Acoustic Radiation Force Impulse imaging for the staging of liver fibrosis: a pooled meta-analysis. J Viral Hepat 2012; 19: e212–e219. doi: 10.1111/j.1365-2893.2011.01537.x [DOI] [PubMed] [Google Scholar]
- 17. Friedrich-Rust M, Ong MF, Martens S, Sarrazin C, Bojunga J, Zeuzem S, et al. Performance of transient elastography for the staging of liver fibrosis: a meta-analysis. Gastroenterology 2008; 134: 960–74. doi: 10.1053/j.gastro.2008.01.034 [DOI] [PubMed] [Google Scholar]
- 18. Singh S, Venkatesh SK, Wang Z, Miller FH, Motosugi U, Low RN, et al. Diagnostic performance of magnetic resonance elastography in staging liver fibrosis: a systematic review and meta-analysis of individual participant data. Clin Gastroenterol Hepatol 2015; 13: 440–51. doi: 10.1016/j.cgh.2014.09.046 [DOI] [PMC free article] [PubMed] [Google Scholar]
- 19. Srinivasa Babu A, Wells ML, Teytelboym OM, Mackey JE, Miller FH, Yeh BM, et al. Elastography in Chronic Liver Disease: Modalities, Techniques, Limitations, and Future Directions. Radiographics 2016; 36: 1987–2006. doi: 10.1148/rg.2016160042 [DOI] [PMC free article] [PubMed] [Google Scholar]
- 20. Tang A, Cloutier G, Szeverenyi NM, Sirlin CB. Ultrasound Elastography and MR Elastography for Assessing Liver Fibrosis: Part 2, Diagnostic Performance, Confounders, and Future Directions. AJR Am J Roentgenol 2015; 205: 33–40. doi: 10.2214/AJR.15.14553 [DOI] [PMC free article] [PubMed] [Google Scholar]
- 21. Tsochatzis EA, Gurusamy KS, Ntaoula S, Cholongitas E, Davidson BR, Burroughs AK. Elastography for the diagnosis of severity of fibrosis in chronic liver disease: a meta-analysis of diagnostic accuracy. J Hepatol 2011; 54: 650–9. doi: 10.1016/j.jhep.2010.07.033 [DOI] [PubMed] [Google Scholar]
- 22. Wagner M, Corcuera-Solano I, Lo G, Esses S, Liao J, Besa C, et al. Technical Failure of MR Elastography Examinations of the Liver: Experience from a Large Single-Center Study. Radiology 2017; 284: 401–412. doi: 10.1148/radiol.2016160863 [DOI] [PMC free article] [PubMed] [Google Scholar]
- 23. Dodd GD. 3rd, Baron RL, Oliver JH, 3rd, Federle MP. Spectrum of imaging findings of the liver in end-stage cirrhosis: part I, gross morphology and diffuse abnormalities. AJR American journal of roentgenology 1999; 173: 1031–6. [DOI] [PubMed] [Google Scholar]
- 24. Harbin WP, Robert NJ, Ferrucci JT. Diagnosis of cirrhosis based on regional changes in hepatic morphology: a radiological and pathological analysis. Radiology 1980; 135: 273–83. doi: 10.1148/radiology.135.2.7367613 [DOI] [PubMed] [Google Scholar]
- 25. Huber A, Ebner L, Montani M, Semmo N, Roy Choudhury K, Heverhagen J, et al. Computed tomography findings in liver fibrosis and cirrhosis. Swiss Med Wkly 2014; 144: w13923. doi: 10.4414/smw.2014.13923 [DOI] [PubMed] [Google Scholar]
- 26. Ito K, Mitchell DG, Kim MJ, Awaya H, Koike S, Matsunaga N. Right posterior hepatic notch sign: a simple diagnostic MR finding of cirrhosis. J Magn Reson Imaging 2003; 18: 561–6. doi: 10.1002/jmri.10387 [DOI] [PubMed] [Google Scholar]
- 27. Tan KC. Enlargement of the hilar periportal space. Radiology 2008; 248: 699–700. doi: 10.1148/radiol.2482060463 [DOI] [PubMed] [Google Scholar]
- 28. Torres WE, Whitmire LF, Gedgaudas-McClees K, Bernardino ME. Computed tomography of hepatic morphologic changes in cirrhosis of the liver. J Comput Assist Tomogr 1986; 10: 47–50. doi: 10.1097/00004728-198601000-00009 [DOI] [PubMed] [Google Scholar]
- 29. Lubner MG, Smith AD, Sandrasegaran K, Sahani DV, Pickhardt PJ. CT Texture Analysis: Definitions, Applications, Biologic Correlates, and Challenges. Radiographics 2017; 37: 1483–503. doi: 10.1148/rg.2017170056 [DOI] [PubMed] [Google Scholar]
- 30. Davnall F, Yip CS, Ljungqvist G, Selmi M, Ng F, Sanghera B, et al. Assessment of tumor heterogeneity: an emerging imaging tool for clinical practice? Insights Imaging 2012; 3: 573–89. doi: 10.1007/s13244-012-0196-6 [DOI] [PMC free article] [PubMed] [Google Scholar]
- 31. Ganeshan B, Miles KA. Quantifying tumour heterogeneity with CT. Cancer Imaging 2013; 13: 140–9. doi: 10.1102/1470-7330.2013.0015 [DOI] [PMC free article] [PubMed] [Google Scholar]
- 32. Miles KA, Ganeshan B, Hayball MP. CT texture analysis using the filtration-histogram method: what do the measurements mean? Cancer Imaging 2013; 13: 400–6. doi: 10.1102/1470-7330.2013.9045 [DOI] [PMC free article] [PubMed] [Google Scholar]
- 33. Bedossa P, Poynard T. An algorithm for the grading of activity in chronic hepatitis C. The METAVIR Cooperative Study Group. Hepatology 1996; 24: 289–93. doi: 10.1002/hep.510240201 [DOI] [PubMed] [Google Scholar]
- 34. Lubner MG, Jones D, Said A, Kloke J, Lee S, Pickhardt PJ. Accuracy of liver surface nodularity quantification on MDCT for staging hepatic fibrosis in patients with hepatitis C virus. Abdom Radiol 2018. doi: 10.1007/s00261-018-1572-6 [DOI] [PubMed] [Google Scholar]
- 35. Brenner DJ. Radiation risks potentially associated with low-dose CT screening of adult smokers for lung cancer. Radiology 2004; 231: 440–5. doi: 10.1148/radiol.2312030880 [DOI] [PubMed] [Google Scholar]
- 36. Brenner DJ, Georgsson MA. Mass screening with CT colonography: should the radiation exposure be of concern? Gastroenterology 2005; 129: 328–37. doi: 10.1053/j.gastro.2005.05.021 [DOI] [PubMed] [Google Scholar]
- 37. Pickhardt PJ, Malecki K, Hunt OF, Beaumont C, Kloke J, Ziemlewicz TJ, Lubner MG, et al. Hepatosplenic volumetric assessment at MDCT for staging liver fibrosis. Eur Radiol 2017; 27: 3060-3068 Accepted.. doi: 10.1007/s00330-016-4648-0 [DOI] [PubMed] [Google Scholar]
- 38. Lubner MG, Malecki K, Kloke J, Ganeshan B, Pickhardt PJ. Texture analysis of the liver at MDCT for assessing hepatic fibrosis. Abdom Radiol (NY. 2017;. [DOI] [PubMed]
- 39. Ng F, Ganeshan B, Kozarski R, Miles KA, Goh V. Assessment of primary colorectal cancer heterogeneity by using whole-tumor texture analysis: contrast-enhanced CT texture as a biomarker of 5-year survival. Radiology 2013; 266: 177–84. doi: 10.1148/radiol.12120254 [DOI] [PubMed] [Google Scholar]
- 40. Goh V, Ganeshan B, Nathan P, Juttla JK, Vinayan A, Miles KA. Assessment of response to tyrosine kinase inhibitors in metastatic renal cell cancer: CT texture as a predictive biomarker. Radiology 2011; 261: 165–71. doi: 10.1148/radiol.11110264 [DOI] [PubMed] [Google Scholar]
- 41. Ganeshan B, Miles KA, Young RC, Chatwin CR. Texture analysis in non-contrast enhanced CT: impact of malignancy on texture in apparently disease-free areas of the liver. Eur J Radiol 2009; 70: 101–10. doi: 10.1016/j.ejrad.2007.12.005 [DOI] [PubMed] [Google Scholar]
- 42. Martínez SM, Crespo G, Navasa M, Forns X. Noninvasive assessment of liver fibrosis. Hepatology 2011; 53: 325–35. doi: 10.1002/hep.24013 [DOI] [PubMed] [Google Scholar]
- 43. Adams LA, Bulsara M, Rossi E, DeBoer B, Speers D, George J, et al. Hepascore: an accurate validated predictor of liver fibrosis in chronic hepatitis C infection. Clin Chem 2005; 51: 1867–73. doi: 10.1373/clinchem.2005.048389 [DOI] [PubMed] [Google Scholar]
- 44. Calès P, Oberti F, Michalak S, Hubert-Fouchard I, Rousselet MC, Konaté A, et al. A novel panel of blood markers to assess the degree of liver fibrosis. Hepatology 2005; 42: 1373–81. doi: 10.1002/hep.20935 [DOI] [PubMed] [Google Scholar]
- 45. Forns X, Ampurdanès S, Llovet JM, Aponte J, Quintó L, Martínez-Bauer E, et al. Identification of chronic hepatitis C patients without hepatic fibrosis by a simple predictive model. Hepatology 2002; 36(4 Pt 1): 986–92. doi: 10.1053/jhep.2002.36128 [DOI] [PubMed] [Google Scholar]
- 46. Imbert-Bismut F, Ratziu V, Pieroni L, Charlotte F, Benhamou Y, Poynard T, et al. Biochemical markers of liver fibrosis in patients with hepatitis C virus infection: a prospective study. Lancet 2001; 357: 1069–75. doi: 10.1016/S0140-6736(00)04258-6 [DOI] [PubMed] [Google Scholar]
- 47. Sterling RK, Lissen E, Clumeck N, Sola R, Correa MC, Montaner J, et al. Development of a simple noninvasive index to predict significant fibrosis in patients with HIV/HCV coinfection. Hepatology 2006; 43: 1317–25. doi: 10.1002/hep.21178 [DOI] [PubMed] [Google Scholar]
- 48. Wai CT, Greenson JK, Fontana RJ, Kalbfleisch JD, Marrero JA, Conjeevaram HS, et al. A simple noninvasive index can predict both significant fibrosis and cirrhosis in patients with chronic hepatitis C. Hepatology 2003; 38: 518–26. doi: 10.1053/jhep.2003.50346 [DOI] [PubMed] [Google Scholar]
- 49. Rosenberg WM, Voelker M, Thiel R, Becka M, Burt A, Schuppan D, et al. Serum markers detect the presence of liver fibrosis: a cohort study. Gastroenterology 2004; 127: 1704–13. doi: 10.1053/j.gastro.2004.08.052 [DOI] [PubMed] [Google Scholar]
- 50. Tang A, Cloutier G, Szeverenyi NM, Sirlin CB. Ultrasound Elastography and MR Elastography for Assessing Liver Fibrosis: Part 1, Principles and Techniques. AJR Am J Roentgenol 2015; 205: 22–32. doi: 10.2214/AJR.15.14552 [DOI] [PMC free article] [PubMed] [Google Scholar]
- 51. Wang QB, Zhu H, Liu HL, Zhang B. Performance of magnetic resonance elastography and diffusion-weighted imaging for the staging of hepatic fibrosis: A meta-analysis. Hepatology 2012; 56: 239–47. doi: 10.1002/hep.25610 [DOI] [PubMed] [Google Scholar]
- 52. Pickhardt PJ GP, Said A, Jones D, Malecki K, Welsh B, Zea R et al. Multi-parametric CT for Noninvasive Staging of Liver Fibrosis from HCV: Correlation with the. Scottsdale, AZ: The British Institute of Radiology.; 2018. [Google Scholar]
- 53. Yoon JH, Lee JM, Klotz E, Jeon JH, Lee KB, Han JK, et al. Estimation of hepatic extracellular volume fraction using multiphasic liver computed tomography for hepatic fibrosis grading. Invest Radiol 2015; 50: 290–6. doi: 10.1097/RLI.0000000000000123 [DOI] [PubMed] [Google Scholar]
- 54. Ng F, Kozarski R, Ganeshan B, Goh V. Assessment of tumor heterogeneity by CT texture analysis: can the largest cross-sectional area be used as an alternative to whole tumor analysis? Eur J Radiol 2013; 82: 342–8. doi: 10.1016/j.ejrad.2012.10.023 [DOI] [PubMed] [Google Scholar]
- 55. Lubner MG, Stabo N, Lubner SJ, del Rio AM, Song C, Halberg RB, et al. CT textural analysis of hepatic metastatic colorectal cancer: pre-treatment tumor heterogeneity correlates with pathology and clinical outcomes. Abdom Imaging 2015; 40: 2331–2337. doi: 10.1007/s00261-015-0438-4 [DOI] [PubMed] [Google Scholar]


