

Abstract
Background:
Obesity treatment focuses primarily on reducing overall caloric intake with limited focus on improving diet quality. The Dietary Approaches to Stop Hypertension (DASH) dietary pattern is effective in managing hypertension and other chronic conditions; yet it is not clear whether behavioral weight control interventions improve DASH adherence. We conducted a post hoc analysis of a behavioral weight loss intervention that did not emphasize diet quality and examined whether the intervention impacted DASH adherence in medically vulnerable community health center patients.
Methods:
Participants (n=306) were enrolled in Track; a randomized controlled weight loss intervention for patients with elevated cardiovascular risk. The trial compared usual care to an intervention with weekly self-monitoring, tailored feedback on diet and exercise goals, and dietitian and provider counseling in community health centers. Dietary intake was measured using the Block Food Frequency Questionnaires collected at baseline and 12 months. DASH adherence was determined using previously validated scoring indices that assessed adherence based on recommended nutrient or food group targets. Total scores for both indices ranged from 0–9, with higher scores indicating greater DASH adherence.
Results:
The mean (SD) age of participants was 51.1 (8.8) years and the mean (SD) body mass index (BMI) was 35.9 (3.9) kg/m2. Most were female (69%) and Black (51%); 13% were Hispanic. Half (51%) had an annual income <$25,000 and 33% had both diabetes and hypertension. At baseline, the mean (SD) DASH nutrient score was 1.81 (1.42) with 6% achieving at least a score of 4.5. Similar scores were seen for the DASH foods index. The intervention group saw significantly greater, albeit small, improvements in mean (SD) DASH nutrient score [intervention: 1.28 (1.5) vs control: 0.20 (1.3); p<.001] and there was no difference in DASH food score between study arms. There were no significant predictors of change in DASH score and no association between DASH adherence and changes in blood pressure. Within the intervention arm, improvements in DASH nutrient score were associated with greater weight loss (r=−.28; p=.003).
Conclusion:
Although the intervention was not designed to increase adoption of DASH, the Track intervention produced significant weight loss and small improvements in DASH adherence. Despite these small improvements, overall adoption of DASH was poor among the medically vulnerable patients enrolled in Track. To further reduce chronic disease burden, weight loss interventions should also include a focus on both caloric restriction and increasing diet quality.
Keywords: DASH diet, hypertension, weight loss, diet quality, primary care
Trial Registration:
This study was registered at ClinicalTrials.gov, NCT01827800, on April 3, 2013.
Introduction:
Chronic diseases such as hypertension and diabetes are among the most costly and preventable of all health problems. Over 100 million adults have hypertension and 30 million adults have diabetes;1 recent estimates show 78% of people with diabetes also have hypertension.2Hypertension is a primary risk factor for heart disease and stroke, the leading cause of death in the U.S.3 The coexistence of these two chronic non-communicable diseases is likely due to their shared common risk factors such as obesity and poor diet quality.4 Moreover, obesity and the associated chronic conditions are disproportionately burdensome to socioeconomically disadvantaged individuals and racial/ethnic minorities.5 As such, efforts are needed to reduce these health disparities.
Focusing on modifiable risk factors such as diet can help reduce chronic disease burden. There is a significant amount of evidence supporting the benefits of behavioral weight loss interventions on reducing obesity, increasing physical activity, and reducing blood pressure and blood glucose,6 yet there are limited data of the effect of weight loss interventions on adoption of dietary patterns associated with chronic disease reduction.7,8 The Dietary Approaches to Stop Hypertension (DASH) dietary pattern is a proven method to improve diet quality and lower cardiometabolic risk factors independent of weight loss or physical activity changes.9 The DASH diet emphasizes nutrients such as potassium, magnesium, fiber and protein through fruits, vegetables, whole grains, beans and low-fat dairy products, and limits total fat, saturated fat, and cholesterol.10 Numerous trials have shown the blood pressure lowering effects of DASH across subgroups of men, women, racial/ethnic minorities, whites, and in both hypertensive and non-hypertensive participants.11 Effects are greater when DASH and sodium reduction are combined.9 Similarly, trials have shown positive effects of DASH on glycemic control12 and weight control.13 Because of its proven health benefits, DASH has been included in the Dietary Guidelines for Americans (DGAs) since 2005.14 However, national rates of DASH adoption are poor, and little has changed even after incorporation of the DASH dietary pattern into the DGAs.15–17 DASH has the potential to address chronic disease burden and disparities by reducing the incidence and severity of the major cardiovascular and metabolic risk factors. Yet, efforts are needed to understand how to improve adoption of DASH, particularly among groups most burdened by hypertension and diabetes.18
Many behavioral lifestyle interventions to reduce obesity and the associated comorbidities focus on creating a caloric deficit through reducing caloric intake and increasing caloric expenditure.8,19,20 These interventions focus on achieving a set calorie intake goal and suggestions are made on how to achieve that goal, such as reducing sugary drinks or other high calorie processed foods and reducing portions.18,19 However, there is less emphasis on adopting a high quality dietary pattern such as DASH. Despite not emphasizing diet quality, improvements may occur because of the recommended dietary strategies to promote weight loss (e.g., replace high calorie snack foods with fruits and vegetables). The only behavioral weight loss study we are aware of that has examined diet quality outcomes in detail is the PREMIER trial.21,22 PREMIER compared a weight loss intervention with and without an emphasis on DASH and found increases in DASH adherence among those instructed to follow the DASH diet, but little to no improvements in diet quality among those receiving a standard behavioral weight loss intervention without DASH guidance.23 The current study aims to add to our understanding of the effects of behavioral weight loss interventions on improving diet quality. Our specific aims are to examine: 1) the effect of a behavioral weight loss intervention (Track) among low-income, medically vulnerable adults on changes in diet quality as measured by DASH adherence scores; 2) whether DASH adherence score varies by sociodemographic characteristics and diagnosis of type 2 diabetes and/or hypertension; and 3) whether there is any association between DASH adherence score and changes in weight and blood pressure. Although the intervention did not encourage adoption of the DASH diet, we hypothesize that improvements in diet quality will occur as a result of the intervention because of the intervention’s emphasis on promoting healthy diet and exercise behaviors for weight loss.
Methods
Design and procedures
The data examining the aims of the current analysis are from the Track study.24,25 Track was a 12-month randomized controlled trial of a digital health weight loss intervention in a community health center system. Detailed design and methods have been published elsewhere.24 Briefly, Track participants were randomized to usual primary care, or a 12-month intervention consisting of algorithm-generated tailored behavior change goals (e.g., no sugary drinks, walk 10,000 steps per day, no fast food, no salty snacks), self-monitoring of these goals via mobile technologies, daily self-weighing using a network-connected scale, skills training materials, 18 weight loss coaching phone calls with a Track registered dietitian, and weight loss counseling from primary care providers. The Track intervention was not designed to improve adoption of the DASH dietary pattern. The current analysis is a post hoc analysis of the effects of the Track intervention on diet quality as measured by DASH adherence. Participants were followed over 12 months, with study visits at baseline, 6, and 12 months. Anthropometric data, blood pressure, and self-administered surveys were collected at each study visit.
Participants
Track participants (N=351) were men and women aged 21 to 65 years with a baseline body mass index (BMI) of 30–45 kg/m2. Participants were eligible if they had at least one obesity-related comorbidity (hypertension, diabetes, and/or hyperlipidemia) and were patients from four federally-qualified community health centers (CHCs) of Piedmont Health Services, Inc. (Piedmont). All study activities were approved by the university’s institutional review board and the community health system’s advisory board; all participants provided written informed consent. Recruitment and randomization began on June 18, 2013 and recruitment was completed in September 2014. Final assessments were completed on September 10, 2015. Data analysis was conducted in 2016–2018. The study achieved 90% retention for the main outcome of weight loss at 12 months and 13 participants became ineligible throughout the study period, resulting in an analytic sample of 338 participants.25 For the current analysis using dietary data as the primary outcome, we included participants with complete and valid diet data. This is defined using the calorie criteria set by Willet et al., for what is considered plausible.26 Data from women who had a mean kilocaloric intake <600 or >3500 and men who had a kilocaloric intake <800 or >4200 were considered invalid.26 At baseline, 306 participants had valid dietary data (91% of eligible participants). At 12 months, 267 participants had valid data (79% of eligible participants), and 240 participants (71% of eligible participants) had valid data at both time points.
Dietary Measures
At baseline and 12 months, study participants completed the 110-item Block Food Frequency Questionnaire (FFQ) to assess usual dietary intake.15 Responses to items from the FFQ generate a nutrient and food analysis for each participant based on reported portion size and frequency of consumption. Level of DASH adherence was measured using two previously determined indices calculating adherence based on recommended levels of nutrients and/or food groups.27 These indices have been shown to be a comparable measure of diet quality to the Healthy Eating Index (HEI)28 and have similar associations with health outcomes as the HEI.29 The nutrient-based index (DASH nutrients) was created by Mellen and colleagues.16 The nutrients included are protein, total fat, saturated fat, cholesterol, fiber, magnesium, calcium, potassium, and sodium. Nutrient targets can be found in Table 1 and are standardized to total calorie intake. A score of 1 is applied if the recommended level of intake is met, a score of 0.5 if intake is intermediate, and a score of 0 if intake is suboptimal. Individual nutrient scores were summed to calculate a total DASH adherence score. As such, the score range is 0–9, with higher scores indicative of greater adherence and nine indicating full adherence to the DASH diet. Using the Mellen et al scoring criteria, we also created a categorical outcome comparing those who achieved at least a score of 4.5 compared to those who reported a lower score to determine moderate adherence to DASH nutrients or “half DASH.”16 We also used the index by Dixon and colleagues to assess DASH adherence using primarily food groups as outlined in the 2005 Dietary Guidelines for Americans 30 (see Table 1 for component targets). The Dixon index includes 8 food group components (fruits, vegetables, whole grains, dairy, nuts, seeds, and legumes, meat, added sugar, and alcohol) and 1 nutrient component (saturated fat). A score of 1 is applied if the target number of servings for each food group is met and 0 if the target is not met. A total score is then calculated based on the sum of the 9 components with a score range of 0–9. Higher scores are indicative of greater adherence.
Table 1.
DASH* diet components and score targets by scoring index in participants in the Track study (N=306)
| Individual components |
|||
|---|---|---|---|
| Dixon’s DASH index Sex-specific† |
Mellen’s DASH index‡ | ||
| DASH Score Target | Intermediate Target | ||
| Men/Women | Same standards for men and women | ||
| Dietary components for which greater intake receives a higher score | |||
| Total fruit | 4 servings/d§ | — | — |
| Total vegetables | 4/3 servings/d§ | — | — |
| Whole grains | 4.7/4 servings/d§,¶ | — | — |
| Total dairy products | 2 servings/d§ | — | — |
| Nuts, seeds, legumes | 4/3 servings/d§ | — | — |
| Protein, g | — | 18% of total daily kcal | 16.5% of total daily kcal |
| Fiber, g | — | 14.8 g/1000 kcal per day | 9.5 g/1000 kcal per day |
| Magnesium, mg | — | 238 mg/1000 kcal per day | 158 mg/1000 kcal per day |
| Calcium, mg | — | 590 mg/1000 kcal per day | 402 mg/1000 kcal per day |
| Potassium, mg | — | 2238 mg/1000 kcal per day | 1534 mg/1000 kcal per day |
| Dietary components for which lower intake receives a higher score | |||
| Meat/meat equivalents, oz | 6 oz/d§ | — | — |
| Added sugar, g | 3% of total daily kcal | — | — |
| Alcoholic beverages | 2/1 drink/d§ | — | — |
| Total fat, g | — | 27% of total daily kcal | 32% of total daily kcal |
| Saturated fat, g | 5% of total daily | 6% of total daily | 11% of total daily |
| Cholesterol, mg | — | 71.4 mg/1000 kcal per day | 107.1 mg/1000 kcal per day |
| Sodium, mg* | — | 2400 mg per day | 3000 mg per day |
| Total score (points) | 0–9 | 0–9 | |
DASH, Dietary Approaches to Stop Hypertension.
Participants receive 1 point for meeting the recommendation and zero points for not; standards are sex-specific.
Participants receive 1 point for meeting the target, 0.5 points for meeting the intermediate target, and 0 points for meeting neither target.
Servings are based on the 2005 Dietary Guidelines for Americans sex-specific eating plan, i.e. 2000 kcal/d for men and 1600 kcal/d for women.
A total of 4.7 servings for men and 4 servings for women were based on the Dietary Guidelines recommendation for most grains to be whole, which Dixon et al.30 defined as 67%.
Other relevant measures
At baseline, sociodemographic variables were measured using standard questions and are available in detail as previously published.24 Diagnoses of the relevant chronic diseases were also measured at baseline using active problem codes in the electronic health record for diabetes, hypertension and hyperlipidemia. At baseline and 12 months, body weight was measured in clinic to the nearest 0.1 kg using a portable electronic scale (Seca Model 876). Participants were weighed shoeless, in hospital gowns. Blood pressure was also measured at the same time points using the Omron HEM 907XL, a microprocessor-controlled device that automatically measures systolic pressure, diastolic pressure, and pulse rate for adults. The protocol included measuring blood pressure three times at 1-min intervals after 1–2 min of quiet sitting. Participants were advised not to exercise, smoke or to consume any caffeine within 30 min prior to their study visits. At both baseline and 12 months, the 8-item Patient Health Questionnaire evaluated the presence of depressive symptoms with scores ranging from 0 to 24. Scores above 10 indicate moderate depression.31
Data Analysis
We used descriptive statistics to characterize participants using baseline sociodemographic variables. Characteristics were summarized using frequencies and proportions for categorical variables and mean and standard deviation (SD) for continuous variables. Bivariate analyses were conducted to determine the association between baseline characteristics and changes in DASH scores using independent t-tests for continuous data, and analysis of variance (ANOVA) models for categorical data. With the ANOVA analyses, a post-hoc Tukey test was applied to compare adherence within sociodemographic characteristics. To examine the effect of treatment group over time on DASH adherence, controlling for baseline levels of DASH adherence, linear regression models were conducted assessing changes in DASH scores and DASH component values by study arm. Pairwise Pearson correlation tests were conducted to assess the association between change in weight and change in blood pressure with change in DASH scores. To assess sociodemographic predictors associated with a change in DASH score, we conducted independent t-tests for continuous predictors and ANOVA models for categorical data with a post-hoc Tukey test. All analyses were conducted using Stata 14 for Mac with an alpha<0.05 to assess statistical significance.32
Results:
Baseline characteristics
Participants had a mean (SD) age of 51.1 (8.8) years and the mean (SD) body mass index (BMI) was 35.9 (3.9) kg/m2. Most were Female (68.6%), non-Hispanic Black (51.3%) or non-Hispanic White (29.7%), and 13.4% were Hispanic. Participants were mostly employed (67.3%), half (50.7%) had an annual income less than $25,000 and 33.2% received Supplemental Nutrition Assistance Program (SNAP) benefits. Less than half of participants (48.7%) had health insurance and 17.7% had moderate depression as measured by the PHQ-8. Eighty percent (80.7%) of the sample had hypertension and 33.3% had diabetes and hypertension. There were no significant differences in these characteristics between study arms at baseline, however, at 12 months, participants who were male or married were more likely to not have completed the FFQ (p=.029 and p=.042, respectively).
DASH adherence by baseline characteristics
There were no differences between study arms in baseline DASH adherence. Combining study arms together at baseline, the mean (SD) DASH nutrient score was 1.81 (1.42) with 6% achieving at least a score of 4.5 (half DASH). The mean (SD) DASH food score was 2.38 (0.71) and 92% of participants achieved a DASH food score less than 4. At baseline, no participants reported a score indicative of full DASH adherence using either scoring index. As reported in Table 2, baseline DASH adherence varied by gender within both indices, with males reporting lower mean (SD) scores than females [(DASH nutrient score: 1.44 (1.21) vs 1.98 (1.48); p=.002) and (DASH food score: 2.19 (0.69) vs 2.46 (0.70); p=002)].
Table 2.
DASH adherence at baseline by sociodemographic characteristics in both study arms among participants enrolled in the Track study (N=306).**
| Variable (n) | DASH Nutrients Score16 |
DASH Foods Score30 |
|||
|---|---|---|---|---|---|
| Mean | SD | Mean | SD | ||
| Overall | 1.81 | (1.42) | 2.38 | (0.71) | |
| Gender | Female (n=210) | 1.98 | (1.48)* | 2.46 | (0.70)* |
| Male (n=96) | 1.44 | (1.21)* | 2.19 | (0.69)* | |
| Race | Non-Hispanic Black (n=157) | 1.68 | (1.26) | 2.34 | (0.70) |
| Non-Hispanic White (n=91) | 1.84 | (1.58) | 2.40 | (0.66) | |
| Hispanic (n=41) | 2.28 | (1.62) | 2.46 | (0.81) | |
| Non-Hispanic Other (n=17) | 1.74 | (1.31) | 2.41 | (0.71) | |
| Education | Less than high school graduate (n=43) | 1.93 | (1.61) | 2.26 | (0.69) |
| High school graduate (n=111) | 1.61 | (1.25) | 2.39 | (0.68) | |
| Trade or vocational school, some college or associate’s degree (n=119) | 2.03 | (1.54) | 2.34 | (0.68) | |
| College degree or higher (n=33) | 1.55 | (1.19) | 2.64 | (0.86) | |
| Annual household income |
0 - $24,999 (n=155) | 1.77 | (1.45) | 2.28 | (0.65) |
| $25,000 - $34,999 (n=46) | 2.11 | (1.46) | 2.57 | (0.75) | |
| $35,000 - $49,999 (n=43) | 1.62 | (1.36) | 2.47 | (0.67) | |
| ≥ $50,000 (n=62) | 1.83 | (1.38) | 2.40 | (0.80) | |
| Marital status | Married or living with partner (n=156) | 1.78 | (1.36) | 2.33 | (0.68) |
| Not married or living with partner (n=149) | 1.85 | (1.49) | 2.42 | (0.73) | |
| Current employment |
Yes, full- or part-time (n=206) | 1.74 | (1.37) | 2.38 | (0.73) |
| No (n=94) | 1.99 | (1.56) | 2.38 | (0.62) | |
| Health insurance |
Yes (n=157) | 1.68 | (1.40) | 2.41 | (0.70) |
| No (n=149) | 1.94 | (1.44) | 2.34 | (0.71) | |
| Comorbidity | Diabetes only (n=29) | 2.43 | (1.53) | 2.62 | (0.68) |
| Hypertension only (n=145) | 1.73 | (1.39) | 2.31 | (0.66) | |
| Diabetes and hypertension (n=102) | 1.73 | (1.40) | 2.46 | (0.77) | |
| Neither diabetes nor hypertension (n=30) | 1.85 | (1.47) | 2.17 | (0.65) | |
| SNAP† | Yes (n=101) | 1.67 | (1.33) | 2.31 | (0.70) |
| No (203) | 1.89 | (1.47) | 2.41 | (0.71) | |
| Depression‡ | Yes (n=54) | 1.90 | (1.44) | 2.37 | (0.71) |
| No (n=252) | 1.79 | (1.42) | 2.38 | (0.71) | |
Denotes significance within the category within each index, based on t test for dichotomous variables and ANOVA for categorical with adjustment for multiple comparisons (Tukey’s test), P<.05.
N’s vary based on available data
Supplemental Nutrition Assistance Program
Using the PHQ-8 scale with scores ranging from 0 to 24. Scores ≥ 10 are indicative of moderate depression.
Changes in DASH adherence over time
As shown in Table 3, the intervention group saw a significantly greater increase in mean (SD) DASH nutrient score compared to usual care [1.28 (1.51) vs 0.20 (1.32); p<.001]. A significantly greater proportion of participants in the intervention group achieved “half DASH” at 12 months compared to usual care (20.4% vs 8.7%; p=.010). There were no significant differences between the mean (SD) change in DASH foods scores at 12 months between the intervention arm and usual care groups [−0.06 (0.71) vs 0.05 (0.72) p=.099].
Table 3.
Summary of DASH adherence scores and component scores by scoring index for Track participants at baseline with statistical comparison of changes in scores at 12 months between study arms (n=306)*
| Individual components** | Scores, mean (sd) | P value† | |||
|---|---|---|---|---|---|
| Control | Intervention | ||||
| Baseline (n=150) | Change(n=127) | Baseline (n=156) | Change(n=113) | ||
| DASH nutrients score | 1.89 (1.46) | 0.20 (1.32) | 1.74 (1.38) | 1.28 (1.51) | <.001 |
| Calcium, mg/1000 kcal | 414.52 (135.83) | 19.20 (113.32) | 383.05 (113.05) | 55.10 (122.47) | .05 |
| Cholesterol, mg/1000 kcal | 158.38 (65.26) | 8.70 (61.27) | 163.68 (61.56) | 4.00 (75.16) | .93 |
| Fiber, g/1000 kcal | 9.07 (3.22) | 0.46 (2.95) | 9.08 (3.25) | 2.54 (3.38) | <.001 |
| Magnesium, mg/1000 kcal | 156.25 (41.37) | 6.10 (41.97) | 150.63 (40.63) | 28.67 (41.32) | <.001 |
| Potassium, mg/1000 kcal | 1355.50 (338.03) | 48.38 (296.14) | 1322.86 (312.92) | 279.20 (350.02) | <.001 |
| Sodium, mg‡ | 3204.67 (1237.42) | −240.72 (1127.94) | 3315.94 (1463.31) | −977.86 (1229.09) | <.001 |
| Protein, % total kcal | 16.11 (3.15) | 0.46 (3.18) | 15.94 (2.70) | 1.51 (3.34) | .013 |
| Saturated fat, % total kcal | 12.05 (2.28) | 0.26 (2.03) | 12.31 (2.40) | −0.99 (2.55) | <.001 |
| Total fat, % total kcal | 38.64 (5.86) | 0.73 (5.06) | 40.57 (5.88) | −2.10 (5.99) | .02 |
| DASH foods score | 2.40 (0.75) | 0.05 (0.72) | 2.35 (0.66) | −0.06 (0.71) | .10 |
| Fruit, servings/day | 1.01 (0.82) | 0.02 (0.78) | 0.91 (0.74) | 0.27 (0.09) | .06 |
| Vegetables, servings/day | 2.87 (1.87) | 0.10 (1.82) | 3.12 (2.07) | 0.17 (1.83) | .51 |
| Whole grains, servings/day | 0.63 (0.88) | −0.01 (0.68) | 0.61 (0.84) | −0.09 (0.80) | .30 |
| Dairy, servings/day | 1.02 (0.75) | −0.07 (0.60) | 0.83 (0.68) | −0.24 (0.58) | .002 |
| Nuts, seeds, legumes, servings/day | 0.67 (0.85) | 0.03 (0.86) | 0.70 (0.82) | −0.34 (0.86) | <.001 |
| Meat, ounces/day | 2.79 (1.40) | −0.18 (1.30) | 2.99 (1.75) | −0.84 (1.42) | .001 |
| Added sugar, % total kcal | 11.93 (6.47) | −1.23 (5.38) | 10.90 (6.33) | −1.69 (6.44) | .06 |
| Alcohol, drinks/day | 0.50 (1.33) | −0.18 (0.92) | 0.47 (1.30) | −0.09 (0.75) | .82 |
| Saturated fat, % total kcal | 12.05 (2.28) | 0.26 (2.03) | 12.31 (2.40) | −0.99 (2.55) | <.001 |
kcal = kilocalories
Sample size includes participants with complete and accurate diet data (women: <600 and >3500 kilocalories/day; men: <800 and >4200 calories/day); sample size at follow up includes those with complete and accurate data at both baseline and 12 months (n=240).
All models controlled for baseline scores.
Sodium intake was not standardized to kilocalories as recommendations are standard regardless of caloric intake.
Table 3 also compares changes in individual DASH score components over time by study arm. Except for calcium and cholesterol, the intervention group saw significant mean changes in all other DASH nutrient score components as compared to usual care. Although there was no overall difference in DASH food score, the intervention group saw significant mean changes in servings per day of dairy, nut, seeds, and legumes, and meat and changes in percent of total calories from saturated fat. There were no significant differences between study arms in servings per day of fruit, vegetables, or grains, percent of total calories from added sugar, or number of alcohol drinks per day.
There were no association between the baseline characteristics in Table 2 describing sociodemographic and psychosocial variables, and diagnosis of hypertension, diabetes or both and change in DASH score using either scoring index
Change in DASH score and weight
Details on the weight outcomes from the Track trial can be found elsewhere.25 Briefly, at 12 months the intervention group had a weight change of −4.0 kg (95% CI, −4.9 to −3.0 kg) compared to a weight change of −0.1 kg (95% CI, −1.0 to 0.8 kg) in the usual care group (adjusted mean difference, −3.8 kg; 95% CI, −5.1 to −2.5 kg; p < .0001). As there was little to no weight change or change in DASH score within the usual care group, we examined the association between DASH score change for both indices and weight change within the intervention arm only. As is depicted in Figure 1, there was a significant correlation between change in weight and change in DASH nutrient score (r=−0.28; p=.003) among intervention participants. Controlling for baseline DASH nutrient score, a 1-point increase in DASH nutrient score was associated with a 1.37 kg decrease in weight (p=.002) (Figure 1). There were no significant differences in mean (SD) weight loss among intervention participants who achieved a DASH nutrient score of at least 4.5 or “half DASH” at 12 months compared to those who achieved a lower score [−5.6 (6.8) vs. −4.0 (6.7); p=.227]. No association between weight and DASH food score was found. There was also no association between DASH score and changes in diastolic or systolic blood pressure using either scoring index.
Figure 1:
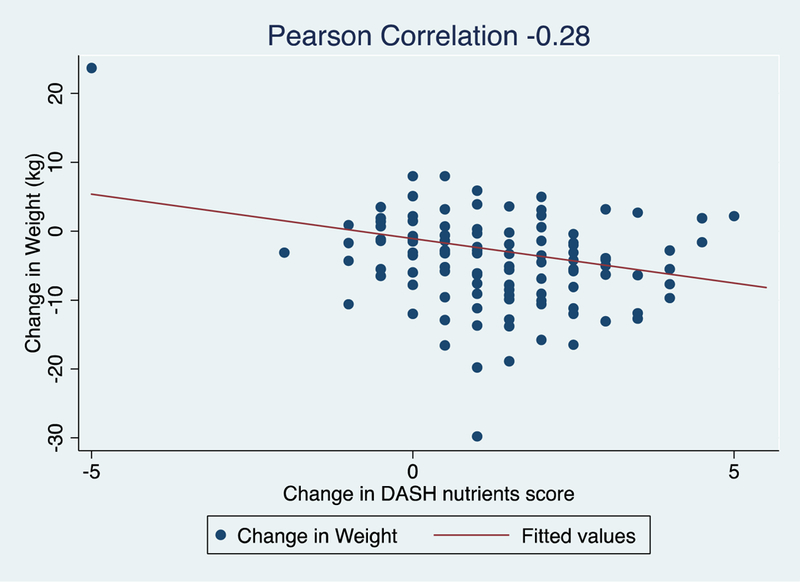
Scatterplot showing the correlation between change in weight and change in DASH nutrient score among intervention participants with complete data enrolled in the Track study (n=113)
Discussion
The DASH dietary pattern, designed to lower blood pressure, has been proven effective in reducing chronic disease burden.33 Despite more than 20 years of evidence and integration of DASH into the Dietary Guidelines for Americans, adherence to DASH remains poor at a national level.15–17 Efforts are needed to understand how to increase adoption of the DASH dietary pattern. The current study examined whether a digital behavioral weight loss intervention designed for medically vulnerable community health center patients with obesity and the associated comorbidities impacted adoption of the DASH diet. The intervention was not designed to improve DASH adherence and we did not message on improving diet quality specifically. Rather, the intervention promoted adoption of diet and physical activity behaviors known to produce the caloric deficit needed to produce weight loss.24 DASH adherence was measured using indices that calculated recommended nutrient targets or intake of specific DASH recommended foods. Indeed, consistent with national levels,15–17 adoption of DASH was poor at baseline, and the intervention led to small, but significant improvements in self- reported dietary intake of DASH nutrients. No participants were fully DASH adherent and only 20% of intervention participants achieved “half DASH” (DASH nutrient score of 4.5 or more).
Although Track did not emphasize DASH, many of the behaviors promoted in the study - no fast food, reduce sugary drinks, increase fruits and vegetables - are consistent with recommendations in the DASH diet. Despite participants adopting these behaviors and losing weight, DASH diet score measured through adoption of DASH friendly foods did not increase. The reason for this discrepancy remains unclear, however, it may be that participants achieved a greater caloric deficit from dietary changes that are not consistent with DASH or measured via the DASH foods index. For example, participants may have reduced portions overall, which resulted in a reduced caloric deficit but not necessarily greater intake of fruits and vegetables or dairy. This does not necessarily explain why we found an increase in DASH nutrient score but no change in DASH foods score. We can speculate that perhaps there was an increase in nutrients that did not equate to meeting the DASH food targets. Indeed, the intervention led to reductions in total fat, saturated fat and sodium and increases in key important nutrients for blood pressure control such as fiber, magnesium and potassium. These improvements were reflected in the DASH nutrient scoring index because it includes an intermediate target. The DASH food scoring index does not have an intermediate target and using a dichotomous scoring schema may have misclassified improvements in adoption of DASH friendly foods as no change. Other examinations of diet quality changes within weight loss interventions have found significant results,34–36 primarily examining changes in diet quality using scoring indices that focus on intake of certain foods. The Look AHEAD trial - one of the gold standard weight loss interventions - found that the intervention led to increases in the consumption of fruits, vegetables, dairy, and fewer servings of fats, oils and sweets per day as compared to the control group.34 These results are promising and show that weight loss interventions can also improve diet quality, although none of these trials examined adoption of the DASH dietary pattern.
These trials also found a significant association between weight loss and improvements in diet quality.34–36 The current study found an association between DASH adherence, as measured by the DASH nutrient index, and weight loss, which suggests that either those who lost weight consumed a greater amount of the nutrients promoted in DASH or that those who adopted DASH lost more weight. Other evidence supports this latter point that a DASH friendly diet with and without caloric restriction can be effective for weight loss.13 Despite this positive association with weight change, there was no significant association between DASH score and blood pressure in the current analysis. Others have proposed that the relationship between blood pressure and DASH score is linear. Epstein and colleagues found that 2-point increases in DASH score resulted in significant reductions in blood pressure. This finding was from a study that specifically promoted DASH in free-living individuals.37 Moreover, Epstein et al., used a different index to evaluate DASH adherence and found a greater number of individuals who achieved higher DASH scores37. The lack of association in the current study may be because there was a limited number of individuals who achieved a high enough DASH score that could impact blood pressure. It may be that DASH scores need to achieve a certain threshold (e.g., half DASH) to be effective. It may be that a 2-point increase is only effective with a baseline score of 4 and an increase from 1–3 may not be enough of a dose to lower blood pressure. Understanding threshold effects of blood pressure and DASH score is an important area that requires further research.
Although the Track intervention led to improvements in DASH score, recommended targets were not achieved. The lack of reaching DASH concordant levels of these nutrients signals that interventions focusing on healthful eating to promote calorie restriction and weight loss may not do enough to improve adoption of DASH. To better improve diet and reduce chronic disease risk, we need interventions focused specifically on promoting adherence to the DASH diet pattern in addition to weight loss. The PREMIER study did just that by testing the effectiveness of a weight loss intervention with standard lifestyle recommendations for lowering blood pressure (e.g. sodium restriction, increasing physical activity) with and without recommendations to adopt DASH. Both groups lost weight and lowered blood pressure, yet there was no significant difference between the two groups.38 The DASH group, however, reported greater consumption of foods consistent with the DASH diet (i.e. fruits, vegetables, dairy) compared to the group receiving no DASH recommendations.23 These improvements were not enough to promote full adherence to the DASH nutrient targets and improve blood pressure reduction above and beyond standard lifestyle practices.23 Despite showing greater improvements in DASH-specific nutrient targets compared to the current study in Track, the PREMIER study’s multiple behavior approach may have been too overwhelming for participants to lead to full DASH adoption. Greater emphasis on how to equally promote caloric restriction and DASH adoption is important for further decreasing chronic disease burden.
A strength of this paper is that we were able to address the question of adherence to the DASH diet pattern in a medically vulnerable, racial/ethnic minority population - a relatively understudied population. Differences in health care and chronic disease prevalence among racial/ethnic minority groups have been well documented with non-Hispanic Blacks having a disproportionate obesity and chronic disease burden.39 We found no differences in adoption of the DASH diet by race/ethnicity or income level, suggesting that increases in DASH are possible despite socioeconomic disadvantage. Despite this increase, access to high quality healthy foods tends to be limited in lower-income communities,40,41 and improving DASH adoption, although possible,18 in these high-risk populations may require greater food availability.
Our study has some limitations worth noting. First, the study used the Block Food Frequency Questionnaire to analyze usual intake and diet pattern. Although the FFQ is a preferred method of dietary intake data collection given the low cost and ease of administering the questionnaire, it does rely on assumptions regarding source, type, preparation and amount when estimating nutrient content. It also relies on cognitive processes to recall intake and lacks cultural sensitivity.42 However, previous studies have used FFQs to measure DASH and to predict outcomes based on DASH adherence.37,43 Second, the DASH indices used in this study had scores that ranged from 0–9 and most participants scored lower than a 4. This limits our ability to detect differences in outcomes between different levels of DASH adherence.
Conclusion
Poor dietary habits and obesity are known risk factors for chronic diseases, which disproportionately affect low income and racial/ethnic minority populations. In our study we found that DASH adoption in community health center patients was poor. The Track intervention produced weight loss, and small, but significant increases in adoption of DASH recommended nutrients. Interestingly, some positive changes were seen in adoption of DASH friendly foods, but these changes were not enough to reach DASH recommended levels. These findings signal that weight loss interventions, even successful ones, should also consider an emphasis on diet quality. Including content on diet quality in addition to calorie restriction can increase the potential to reduce chronic disease risk. These findings also continue to highlight the need for more research on how to improve adoption of the DASH diet, particularly in populations with the highest risk. We have known for 20 years that DASH is the most evidence-based diet to reduce chronic disease risk, yet dissemination remains a challenge.44 Innovative research testing interventions that focus solely on improving adherence to DASH are needed.
Acknowledgments
We express deep gratitude to the administration and staff of Piedmont Health for their continued collaboration and participation in the Track trial. In particular, we would like to thank Brian Toomey, MSW, Abigail DeVries, MD, Heather Miranda, MHA, RD, LDN, Marni Holder, RN, FNP-BC, Ashley Brewer, RD, LDN, Kristen Norton, MA, RD, LDN, Diane Butler, RD, Jennifer Cunningham, and staff at the Piedmont Health centers for their support. We would like to especially thank the women and men who participated in Track. We have received permission from those named above in the Acknowledgements section.
Funding
This trial is funded by the National Institutes of Health (NIH), National Institute of Diabetes and Digestive and Kidney Diseases, [R01DK093829]. Dr. Steinberg is supported by the National Institutes of Health Building Interdisciplinary Research Careers in Women’s Health (BIRCWH) Career Development Grant (K12HD043446). The funders had no role in study design, data collection, data analysis and interpretation of data, in the writing of the report, and in the decision to submit the article for publication.
IRB Approval: All study activities were approved by the Duke University Institutional Review Board on May 20, 2012.
Footnotes
Declaration of conflicting interests and financial disclosure
Dr. Steinberg is a consultant with Omada Health. Gary Bennett holds equity in Coeus Health and serves on the scientific advisory boards of Nutrisystem and Interactive Health. These organizations had no role in study design, data collection, data analysis and interpretation of data, in the writing of the report, or in the decision to submit the article for publication. The remaining authors declare that they have no conflicting interests.
Research Snapshot:
Research Question: Can a behavioral weight loss intervention, as compared to usual care, influence DASH diet adherence?
Key Findings: Within a randomized controlled trial examining a digital health weight loss intervention (Track) among patients with obesity-related comorbidities (e.g., diabetes and hypertension), the intervention produced weight loss and significant, but small, improvements in DASH adherence as compared to usual care. Although Track led to small unintended improvements in DASH adherence, to reduce chronic disease burden, weight loss interventions should emphasize both caloric restriction and diet quality.
Publisher's Disclaimer: This is a PDF file of an unedited manuscript that has been accepted for publication. As a service to our customers we are providing this early version of the manuscript. The manuscript will undergo copyediting, typesetting, and review of the resulting proof before it is published in its final citable form. Please note that during the production process errors may be discovered which could affect the content, and all legal disclaimers that apply to the journal pertain.
References:
- 1.Benjamin EJV, SS CC, et al. Heart Disease and Stroke Statistics—2018 Update: A report from the American Heart Association. Circulation. 2018;137(12):e67–e492. [DOI] [PubMed] [Google Scholar]
- 2.Wang G, Zhou X, Zhuo X, Zhang P. Annual total medical expenditures associated with hypertension by diabetes status in U.S. adults. Am JPrevMed. 2017;53(6S2):S182–S189. [DOI] [PMC free article] [PubMed] [Google Scholar]
- 3.Mozaffarian D, Benjamin EJ, Go AS, et al. Heart disease and stroke statistics—2015 Update: A report from the American Heart Association. Circulation. 2014;131(4):e29–322. [DOI] [PubMed] [Google Scholar]
- 4.Micha R, Peñalvo JL, Cudhea F, Imamura F, Rehm CD, Mozaffarian D. Association between dietary factors and mortality from heart disease, stroke, and type 2 diabetes in the United States. JAMA. 2017;317(9):912–924. [DOI] [PMC free article] [PubMed] [Google Scholar]
- 5.Abeyta IM, Tuitt NR, Byers TE, Sauaia A. Effect of community affluence on the association between individual socioeconomic status and cardiovascular disease risk factors, Colorado, 2007–2008. Prev Chronic Dis. 2012;9:E115. [DOI] [PMC free article] [PubMed] [Google Scholar]
- 6.Wing RR, Lang W, Wadden TA, et al. Benefits of modest weight loss in improving cardiovascular risk factors in overweight and obese individuals with type 2 diabetes. Diabetes Care. 2011;34(7):1481–1486. [DOI] [PMC free article] [PubMed] [Google Scholar]
- 7.Wadden TA, Webb VL, Moran CH, Bailer BA. Lifestyle modification for obesity: new developments in diet, physical activity, and behavior therapy. Circulation. 2012;125(9):1157–1170. [DOI] [PMC free article] [PubMed] [Google Scholar]
- 8.Butryn ML, Webb V, Wadden TA. Behavioral treatment of obesity. Psychiatr Clin North Am. 2011; 34(4):841–859. [DOI] [PMC free article] [PubMed] [Google Scholar]
- 9.Appel LJ, Moore TJ, Obarzanek E, et al. A clinical trial of the effects of dietary patterns on blood pressure. DASH Collaborative Research Group. N Engl J Med. 1997;336(16): 1117–1124. [DOI] [PubMed] [Google Scholar]
- 10.Sacks FM, Obarzanek E, Windhauser MM, et al. Rationale and design of the Dietary Approaches to Stop Hypertension trial (DASH). A multicenter controlled-feeding study of dietary patterns to lower blood pressure. Ann Epidemiol. 1995;5(2): 108–118. [DOI] [PubMed] [Google Scholar]
- 11.Saneei P, Salehi-Abargouei A, Esmaillzadeh A, Azadbakht L. Influence of Dietary Approaches to Stop Hypertension (DASH) diet on blood pressure: a systematic review and metaanalysis on randomized controlled trials. Nutr Metab Cardiovasc Dis. 2014;24(12):1253–1261. [DOI] [PubMed] [Google Scholar]
- 12.Shirani F, Salehi-Abargouei A, Azadbakht L. Effects of Dietary Approaches to Stop Hypertension (DASH) diet on some risk for developing type 2 diabetes: a systematic review and meta-analysis on controlled clinical trials. Nutrition. 2013;29(7–8):939–947. [DOI] [PubMed] [Google Scholar]
- 13.Soltani S, Shirani F, Chitsazi MJ, Salehi-Abargouei A. The effect of Dietary Approaches to Stop Hypertension (DASH) diet on weight and body composition in adults: a systematic review and meta-analysis of randomized controlled clinical trials. Obes Rev. 2016;17(5):442–454. [DOI] [PubMed] [Google Scholar]
- 14.U.S. Department of Health and Human Services and U.S. Department of Agriculture. 2015 – 2020 Dietary Guidelines for Americans: 8th Edition, health.gov. https://health.gov/dietaryguidelines/2015/guidelines/ Published December 2015. [Google Scholar]
- 15.Kim H, Andrade FC. Diagnostic status of hypertension on the adherence to the Dietary Approaches to Stop Hypertension (DASH) diet. Prev Med Rep. 2016;4:525–531. [DOI] [PMC free article] [PubMed] [Google Scholar]
- 16.Mellen PB, Gao SK, Vitolins MZ, Goff DC. Deteriorating dietary habits among adults with hypertension: DASH dietary accordance, NHANES 1988–1994 and 1999–2004. Arch Intern Med. 2008;168(3):308–314. [DOI] [PubMed] [Google Scholar]
- 17.Powell-Wiley TM, Miller PE, Agyemang P, Agurs-Collins T, Reedy J. Perceived and objective diet quality in US adults: a cross-sectional analysis of the National Health and Nutrition Examination Survey (NHANES). Public Health Nutr. 2014;17(12):2641–2649. [DOI] [PMC free article] [PubMed] [Google Scholar]
- 18.Young CM, Batch BC, Svetkey LP. Effect of socioeconomic status on food availability and cost of the Dietary Approaches to Stop Hypertension (DASH) dietary pattern. J Clin Hypertens (Greenwich). 2008;10(8):603–611. [DOI] [PMC free article] [PubMed] [Google Scholar]
- 19.Diabetes Prevention Program (DPP) Research Group. The Diabetes Prevention Program (DPP): description of lifestyle intervention. Diabetes Care. 2002;25(12):2165–2171. [DOI] [PMC free article] [PubMed] [Google Scholar]
- 20.Unick JL, Beavers D, Jakicic JM, et al. Effectiveness of lifestyle interventions for individuals with severe obesity and type 2 diabetes: results from the Look AHEAD trial. Diabetes Care. 2011; 34(10): 2152–2157. DC_110874. [DOI] [PMC free article] [PubMed] [Google Scholar]
- 21.Svetkey LP, Harsha DW, Vollmer WM, et al. Premier: a clinical trial of comprehensive lifestyle modification for blood pressure control: rationale, design and baseline characteristics. Ann Epidemiol. 2003;13(6) :462–471. [DOI] [PubMed] [Google Scholar]
- 22.Appel LJ, Champagne CM, Harsha DW, et al. Effects of comprehensive lifestyle modification on blood pressure control: main results of the PREMIER clinical trial. JAMA. 2003;289(16):2083–2093. [DOI] [PubMed] [Google Scholar]
- 23.Lin PH, Appel LJ, Funk K, et al. The PREMIER intervention helps participants follow the Dietary Approaches to Stop Hypertension dietary pattern and the current Dietary Reference Intakes recommendations. J Am Diet Assoc. 2007;107(9):1541–1551. [DOI] [PubMed] [Google Scholar]
- 24.Foley P, Steinberg D, Levine E, et al. Track: A randomized controlled trial of a digital health obesity treatment intervention for medically vulnerable primary care patients. Contemp Clin Trials. 2016;48:12–20. [DOI] [PMC free article] [PubMed] [Google Scholar]
- 25.Bennett GG, Steinberg D, Askew S, et al. Effectiveness of an app and provider counseling for obesity treatment in primary care. Am JPrev Med. 2018;55(6):777–786. [DOI] [PMC free article] [PubMed] [Google Scholar]
- 26.Subar AF, Thompson FE, Kipnis V, et al. Comparative validation of the Block, Willett, and National Cancer Institute food frequency questionnaires: The Eating at America’s Table Study. Am J Epidemiol. 2001;154(12):1089–1099. [DOI] [PubMed] [Google Scholar]
- 27.Miller PE, Cross AJ, Subar AF, et al. Comparison of 4 established DASH diet indexes: examining associations of index scores and colorectal cancer. Am J Clin Nutr. 2013;98(3):794–803. [DOI] [PMC free article] [PubMed] [Google Scholar]
- 28.Guenther PM, Reedy J, Krebs-Smith SM, Reeve BB, Basiotis PP. Development and evaluation of the healthy eating index—2005. United States. Department of Agriculture. Center for Nutrition Policy and Promotion;2007. [Google Scholar]
- 29.Schwingshackl L, Bogensberger B, Hoffmann G. Diet quality as assessed by the Healthy Eating Index, Alternate Healthy Eating Index, Dietary Approaches to Stop Hypertension Score, and Health Outcomes: an updated systematic review and meta-analysis of cohort studies. J Acad Nutr Diet. 2018;118(1):74–100.e111. [DOI] [PubMed] [Google Scholar]
- 30.Dixon LB, Subar AF, Peters U, et al. Adherence to the USDA Food Guide, DASH Eating Plan, and Mediterranean dietary pattern reduces risk of colorectal adenoma. J Nutr. 2007;137(11):2443–2450. [DOI] [PubMed] [Google Scholar]
- 31.Kroenke K, Strine TW, Spitzer RL, Williams JB, Berry JT, Mokdad AH. The PHQ-8 as a measure of current depression in the general population. J Affect Disord. 2009;114(1–3):163–173. [DOI] [PubMed] [Google Scholar]
- 32.StataCorp LP. College Station. TX, USA2013.
- 33.Lin PH, Yeh WT, Svetkey LP, et al. Dietary intakes consistent with the DASH dietary pattern reduce blood pressure increase with age and risk for stroke in a Chinese population. Asia Pac J Clin Nutr. 2013;22(3):482–491. [PubMed] [Google Scholar]
- 34.Raynor HA, Anderson AM, Miller GD, et al. Partial meal replacement plan and quality of the diet at 1 Year: Action for Health in Diabetes (Look AHEAD) Trial. J Acad Nutr Diet. 2015;115(5):731–742. [DOI] [PMC free article] [PubMed] [Google Scholar]
- 35.O’Brien KM, Hutchesson MJ, Jensen M, Morgan P, Callister R, Collins CE. Participants in an online weight loss program can improve diet quality during weight loss: a randomized controlled trial. Nutr J 2014;13(1):82. [DOI] [PMC free article] [PubMed] [Google Scholar]
- 36.Webber KH, Lee E. The diet quality of adult women participating in a behavioural weight-loss programme. J Hum Nutr Diet. 2011;24(4):360–369. [DOI] [PubMed] [Google Scholar]
- 37.Epstein DE, Sherwood A, Smith PJ, et al. Determinants and consequences of adherence to the Dietary Approaches to Stop Hypertension diet in African-American and white adults with high blood pressure: results from the ENCORE trial. J Acad Nutr Diet. 2012;112(11): 1763–1773. [DOI] [PMC free article] [PubMed] [Google Scholar]
- 38.Appel LJ, Champagne CM, Harsha DW, et al. ; Writing Group of the PREMIER Collaborative Research Group. Effects of comprehensive lifestyle modification on blood pressure control: main results of the PREMIER clinical trial. JAMA. 2003;289(16):2083–2093. [DOI] [PubMed] [Google Scholar]
- 39.Whitt-Glover MC, Hunter JC, Foy CG, et al. Translating the Dietary Approaches to Stop Hypertension (DASH) diet for use in underresourced, urban African American communities, 2010. Prev Chronic Dis. 2013;10:120088. [DOI] [PMC free article] [PubMed] [Google Scholar]
- 40.Baker EA, Schootman M, Barnidge E, Kelly C. The role of race and poverty in access to foods that enable individuals to adhere to dietary guidelines. Prev Chronic Dis. 2006;3(3):A76. [PMC free article] [PubMed] [Google Scholar]
- 41.Bertoni AG, Foy CG, Hunter JC, Quandt SA, Vitolins MZ, Whitt-Glover MC. A multilevel assessment of barriers to adoption of Dietary Approaches to Stop Hypertension (DASH) among African Americans of low socioeconomic status. J Health Care Poor Underserved. 2011;22(4):1205–1220. [DOI] [PMC free article] [PubMed] [Google Scholar]
- 42.Briefel RR, Flegal KM, Winn DM, Loria CM, Johnson CL, Sempos CT. Assessing the nation’s diet: limitations of the food frequency questionnaire. J Am Diet Assoc. 1992;92(8):959–962. [PubMed] [Google Scholar]
- 43.Benisi-Kohansal S, Shayanfar M, Mohammad-Shirazi M, et al. Adherence to the Dietary Approaches to Stop Hypertension-style diet in relation to glioma: a case-control study. Br J Nutr. 2016; 115(6): 1108–1116. [DOI] [PubMed] [Google Scholar]
- 44.Steinberg D, Bennett GG, Svetkey L. The DASH Diet, 20 Years Later. JAMA. 2017;317(15):1529–1530. [DOI] [PMC free article] [PubMed] [Google Scholar]