. 2019 Mar 7;8:e45013. doi: 10.7554/eLife.45013

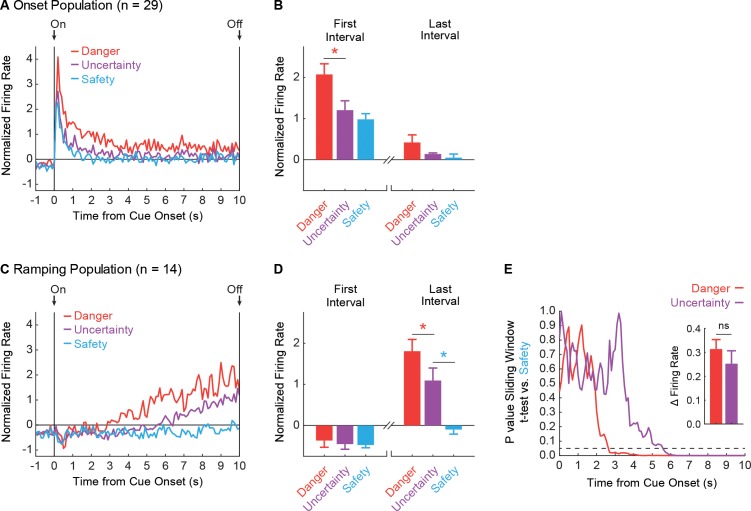
Figure 2. vlPAG neurons are responsive to cue onset or ramp over cue presentation.

(A) Mean, Z-score normalized firing to danger (red), uncertainty (purple) and safety (blue) is shown for the 1 s pre-cue period and the 10 s cue period for the Onset population (n = 29). Cue onset (On) and offset (Off) are indicated by vertical black lines. (B) Mean + SEM, Z-score normalized firing during the first, 1 s cue interval (left) and the last, 1 s cue interval (right), is shown for each cue. Differential firing was observed for danger vs. uncertainty (t28 = 4.54, p=9.70×10⁻⁴, red asterisk) but not for uncertainty vs. safety (t28 = 1.37, p=0.18), in the first interval. No differences were observed for danger vs. uncertainty (t28 = 1.69, p=0.10) or uncertainty vs. safety, (t28 = 0.60, p=0.55) in the last interval. (C) Normalized firing for the Ramping population (n = 14) plotted as in A. (D) First and last interval firing for the Ramping population (n = 14) plotted as in B. Differential firing was not observed for danger vs. uncertainty (t13 = 0.62, p=0.55) or uncertainty vs. safety (t13 = 0.24, p=0.82), in the first interval. By contrast, differential firing was observed for danger vs. uncertainty (t13 = 3.17, p=7.41×10⁻³, red asterisk) and uncertainty vs. safety (t13 = 8.26, p=2.00×10⁻⁶, blue asterisk), in the last interval. (E) A t-test comparing danger (red) and uncertainty (purple) population firing to safety in a 1 s window was slid across the 10 s cue in 100 ms increments. P value of t-test reported on y axis. Dotted line indicates p=0.05. Inset: Mean + SEM change in firing rate from the first window of activity departed from safety to the last interval, is shown for danger (red) and uncertainty (purple). ns = no significance of a paired t-test.

Figure 2.

Figure 2—figure supplement 1. Trial by trial firing for Onset and Ramping populations.

Figure 2—figure supplement 1.

(A, left) Raw firing rate (Hz) for the Onset population (n = 29) is shown across cue presentation for each of the six danger trials. Trials are color-coded from dark (first trial) to light (last trial) with ‘On’ indicating cue onset and ‘Off’ indicating cue offset. (A, right) Population mean firing rate is shown for the first 1 s cue interval (dashed box in A), for each trial. Color scheme maintained from (A, left). Population mean baseline firing (2 s prior to cue presentation) is shown for each individual trial (gray circles). Identical plots using unique color schemes (uncertainty, purple and safety, blue) were made for each trial type: (B) uncertainty shock, (C) uncertainty omission and (D) safety. Note that increased cue firing over baseline tended to be highest on trial 1, but was observed for every individual trial for all cues. A nearly identical set of plots were made for the Ramping population (n = 14, E - H), only now population mean firing rate for each trial (right) is shown for the last 1 s interval of the cue (dashed box on left). Increased cue firing over baseline was consistently observed on danger and uncertainty trials, but not safety trials. Firing patterns observed for the mean of all trials (Figure 2A), (C) were observed at the single trial level for Onset and Ramping populations.
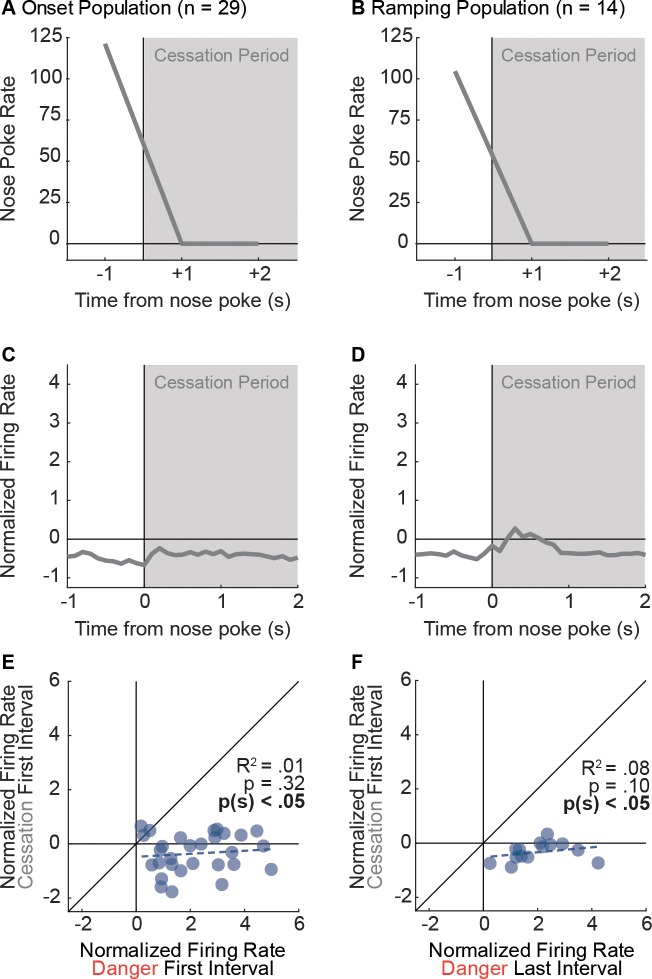
Figure 2—figure supplement 2. Nose poke cessation is insufficient to drive activity of Onset and Ramping neurons.

Figure 2—figure supplement 2.

We identified ITI periods during which a nose poke was followed by at least a 2 s cessation period. Mean nose poke rate during the 1 s interval of the poke (−1) and two, 1 s no-poke intervals (+1 and+2) are shown for (A) Onset units and (B) Ramping units (cessation period in gray). If phasic firing to danger by Onset neurons was driven by nose poke cessation, then greater activity should have been observed to nose poke suppression. By definition, nose poke cessation is complete (suppression ratio = 1.00), whereas mean suppression ratio to danger was high, but incomplete (0.83). (C) Onset neurons were nearly unresponsive to nose poke cessation. (D) Ramping neurons were only weakly responsive. Comparison of single-unit firing to danger (Onset, first interval; Ramping, last interval) and nose poke suppression (first interval) revealed no correlation and an overwhelming bias towards greater firing to danger for (E) Onset neurons (R2 = 0.01, p=0.32, p(sign)=1.62×10⁻⁶) and (F) Ramping neurons (R2 = 0.08, p=0.10, p(sign)=1.22×10⁻⁴). Firing of Onset and Ramping neurons was not the result of nose poke suppression, or nose poking itself.