Abstract
Purpose:
Various excitation strategies have been proposed for dynamic imaging of hyperpolarized agents such as [1-13C]-pyruvate, but the impact of these strategies on quantitative evaluation of signal evolution remains unclear. To better understand their relative performance, we compared the accuracy and repeatability of measurements made using variable excitation angle strategies and conventional constant excitation angle strategies.
Methods:
Signal evolution for constant and variable excitation angle schedules was simulated using a pharmacokinetic model of hyperpolarized pyruvate with two chemical pools and two physical compartments. Noisy synthetic data were then fit using the same pharmacokinetic model with the apparent chemical exchange term as an unknown, and fit results were compared with simulation parameters to determine accuracy and reproducibility.
Results:
Constant excitations and a variable excitation strategy that maximizes the HP lactate signal yielded data that supported quantitative analyses with similar accuracy and repeatability. Variable excitation angle strategies that were designed to produce a constant signal level resulted in lower signal and worse quantitative accuracy and repeatability, particularly for longer acquisition times.
Conclusions:
These results suggest that either constant excitation angle or variable excitation angles that attempt to maximize total signal, as opposed to maintaining a constant signal level, are preferred for metabolic quantification using hyperpolarized pyruvate.
Keywords: hyperpolarized 13C, pyruvate, dynamic spectroscopy, quantitative modeling, sequence design, excitation angle, metabolism, dynamic nuclear polarization, magnetic resonance, cancer
INTRODUCTION
Dissolution dynamic nuclear polarization (DNP) can be used to create hyperpolarized (HP) substrates with a longitudinal magnetization that has been transiently increased by many orders of magnitude allowing for real-time magnetic resonance spectroscopy (MRS) and spectroscopic imaging (MRSI) of select metabolites(1,2). Hyperpolarized [1-13C] pyruvate (HP-pyruvate) shows strong clinical promise, owing to its high capacity for polarization, long relaxation time and unique role in metabolism(3,4). The conversion of HP-pyruvate into lactate has been proposed as an imaging biomarker for staging cancer and detecting response to therapy(5–9).
DNP requires extreme conditions to achieve such high magnetization and must be performed outside of the biological system(2,10) and MRI scanner. As a result, the signal associated with HP agents is inherently transient. In addition, excitation by radio frequency (RF) pulses causes a non-recoverable loss of longitudinal magnetization. To account for this unique behavior, researchers have proposed a range of excitation strategies to design excitation angle schedules to more optimally utilize transient hyperpolarized magnetization(11–13).
The simplest excitation strategy for dynamic imaging of HP agents involves a series of small constant broadband excitation angles (CEA). Additional degrees of freedom imparted by a variable excitation angle (VEA) strategy, where excitation pulse amplitudes vary over the course of the measurement, can be optimized to yield modest improvements in total signal observed, or designed to excite a constant signal amplitude(11,12). In addition, spectrally selective excitations can be used to decouple the excitation angle for each metabolite(14), allowing RF pulse schedules to be even more fine-tuned by accounting for metabolic conversion(12,13).
There are practical limitations to the use of more complicated VEA schedules. An inherent trade-off exists for an excitation schedule that is highly optimized under a specific set of assumptions about underlying tissue characteristics that may not match conditions in vivo. Additionally, VEA schedules generally employ larger excitation angles towards the end of the acquisition to extract larger signal from diminishing pools of magnetization. These larger excitation angles are more sensitive to errors in transmit calibration and B1 inhomogeneity. Finally, spectrally and spatially selective multi-band excitation pulses can be long and result in narrow excitation bands that can result in a greatly diminished signal if the bands or center frequency are miscalibrated or if the spectral peaks are broad.
Metabolic imaging studies employing HP-pyruvate generally seek estimation of , the apparent rate constant for conversion of HP pyruvate into lactate. Quantification of can be impacted by the excitation angle used during acquisition. Robust and controllable platforms are needed to establish the accuracy with which such a complex set of interactions can be characterized. Living systems do not easily offer the controllability needed for a rigorous validation of quantitative imaging strategies, and reusable dynamic phantom systems(15) have not yet been adapted to faithfully mimic tissue perfusion. Numerical simulation permits exhaustive characterization of excitation and analysis strategies using known digital reference objects. In this work, numerical simulations were used to evaluate the effects of excitation angle schedule on the accuracy and reproducibility of pharmacokinetic analysis of HP signal evolution.
METHODS
Iterative Pharmacokinetic Model for HP Signal Evolution
Evolution of the extravascular longitudinal magnetization of HP pyruvate and lactate was modeled following(16):
| [1] |
Where and reflect the longitudinal magnetization of pyruvate in the vascular and extravascular space, respectively, and denotes the spin lattice relaxation time for pyruvate; , , and are corresponding terms for lactate. Extravasation in equation [1] follows a two physical compartment exchange model where is the rate constant for vascular exchange and is the extravascular volume fraction. Rapid diffusion and cellular transport is assumed to homogenize interstitial space with the intracellular compartment where the enzymes that mediate this reaction reside(16,17). Therefore, this model permits chemical conversion of HP pyruvate into lactate only in the extravascular compartment. Conversion of HP pyruvate to lactate follows first-order exchange kinetics where and are the forward and reverse apparent exchange rate constants, respectively.
While equation [1] can be used to model the longitudinal magnetization, signal detection requires that some of the longitudinal magnetization to be excited into the transverse plane. Previous analyses accounted for excitation losses by averaging over the TR interval(4,15,16,18,19). Excitation loss averaging can lead to errors in analysis(18). An alternative and more accurate approach applies equation [1] iteratively over TR intervals(13,20) defined to span between signal excitations. Consider an initial pool of extravascular HP pyruvate (P0) and lactate (L0) in a volume of tissue at the beginning of the nth TR period, prior to excitation, such that:
| [2] |
The observable transverse magnetization, , that can be measured after excitation corresponds with a reduction in longitudinal magnetization:
| [3] |
This framework allows for spectrally selective excitation angles that can evolve over time (, ). Throughout this TR period, extravascular magnetization will continue to evolve due to relaxation and exchange between chemical and physical pools. Extravascular magnetization at the end of this period becomes the initial pool of extravascular magnetization at the start of the next TR interval:
| [4] |
The overall signal observed after the nth excitation is a volume-weighted combination of intravascular and extravascular signals:
| [5] |
Transverse magnetization in the intravascular compartment, the first term on the right-hand side of equation [5], is the result of excitations acting on longitudinal intravascular HP magnetization as indicated. In contrast to signal evolution in extravascular space, where signal excitation can impact future signal, this work assumes that the HP arterial input function (AIF) will be primarily determined by the inflow of fresh magnetization and that excitations will not affect future values of the AIF. Simulations indicate that attenuation of the global AIF due to the excitation schemes considered in this work yield modest degradation in reproducibility, but the relative performance of these strategies was unaffected (data not shown).
Variable Excitation Angle Strategies Design
One method used to design variable excitation schedules is to numerically maximize excitations to achieve a constant signal level, , for a particular metabolite, TR, and number of excitations(12). In a perfused system, there will be a window of time between administration of the bolus and its arrival in the region of interest where , and the signal will not be constant until sufficient signal has perfused into the system. In this work, early time points where were assigned an excitation angle of to minimize the amplitude difference from . Other excitation angles were tested for these early time points but had a negligible effect on results (data not shown).
Variable excitation angle strategies have also been designed to achieve a maximal, but not constant, total lactate signal(11,12). This is done by maximizing the cumulative signal equation for hyperpolarized magnetization as a function of excitation angle. This signal equation [Eq. 8 from (11)] was originally derived assuming an initial pool of HP magnetization, but the critical result that (where is the attenuation term for lactate) also applies to an uncoupled and arbitrarily fed pool of magnetization as shown in appendix A.
Simulations
Three sets of excitation schedules were derived to compare the effects of constant and variable excitation angle strategies on signal evolution. The constant broadband excitation (CEA-bb) schedule consisted of a uniform series of 20o excitations. A constant excitation angle of was found to nearly maximize the lactate, and total signal as well as producing the most accuracy and precise when compared to other constant excitation angles (Supporting Information Figure S1). A multi-band variable excitation strategy (VEA-const) was used to optimize an excitation schedule that attempts to maintain constant and maximized pyruvate and lactate signals(12). Finally, a multi-band variable excitation angle strategy was designed to maximize total lactate signal without requiring signal levels to remain constant (VEA-max). The latter approach utilized a constant excitation angle for pyruvate. Variations of each of these strategies were tested; these were selected because they yielded equal or better reproducibility compared to alternatives (data not shown).
Simulations and excitation angle design were carried out assuming that signal evolution followed Equations 4–5. Initial pyruvate and lactate signal was assumed to be negligibly low (), and that pyruvate perfused into the system following a gamma-variate arterial input function (, , ), which closely matches prior data observed in animal models(16). Apparent longitudinal relaxation times for pyruvate and lactate were assumed to be 43 s and 33 s, respectively(21). These apparent values are shorter than those observed in phantom solutions, and reflect an average that includes agents in intracellular space where relaxation is faster (22). The conversion of pyruvate to lactate was assumed to be , with no reverse conversion ()(20). All software was written in Matlab (The Mathworks Inc., Natick, MA).
To explore total signal and the accuracy of pharmacokinetic analyses () as a function of the number of excitations, all three sets of excitation angle schedules were generated with a 2-second repetition time and 5 to 60 observations yielding a total acquisition time of 10–120 s. Equations [4]–[5] were used to generate noise-free signal curves for CEA-bb, VEA-const, and VEA-max excitation strategies. The amplitude of Gaussian noise required to achieve a peak HP pyruvate signal-to-noise ratio (SNR) (18) of 25 was determined under reference CEA-bb conditions (TR = 2 s, θ = 20°, nTR = 90), and this noise level was added to all noise-free signal curves. Equations [4]–[5] were then fit to the noisy synthetic data, assuming first that all system parameters were known a priori except , and again with perfusion terms , , and the AIF amplitude as additional unknowns. Pharmacokinetic analyses to determine and/or other perfusion parameters were repeated 100 times with fresh noise to allow statistical analysis of the accuracy and repeatability of each excitation schedule. Differences in the mean and variance of estimates were calculated using a two sample t-test and F-test, respectively, for each scan duration simulated. was used to identify statistically significant differences in accuracy and reproducibility between two excitation angle schedules.
RESULTS
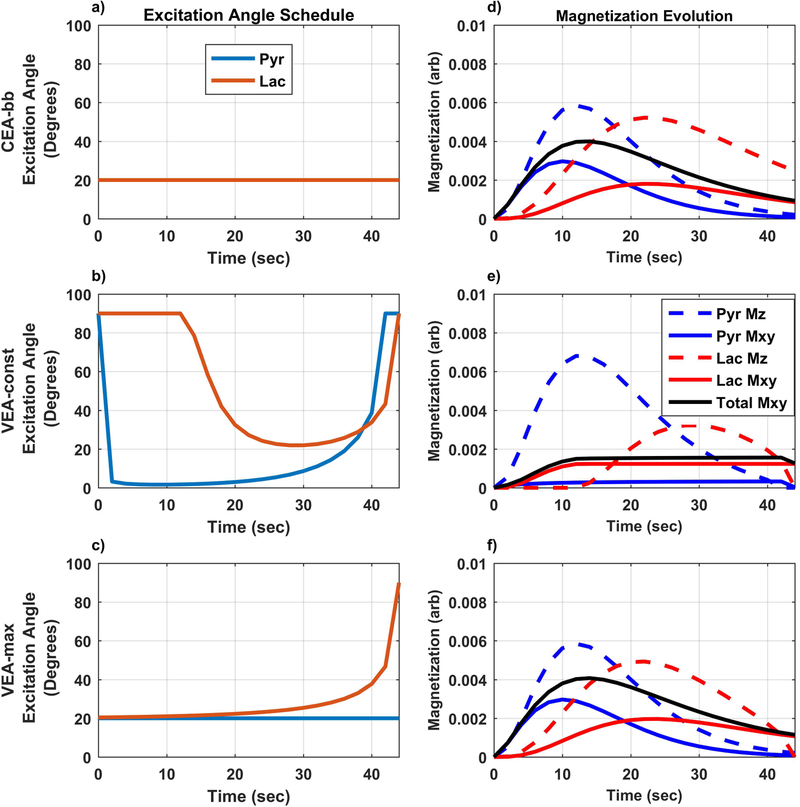
Representative excitation angle schedules with 23 excitation pulses are shown in Figure 1 along with their resulting HP signal evolution curves (Figure 1 with the addition of noise is shown in Supporting Information Figure S2). Generally, the dynamic range of observed signals is higher for the constant small angle broadband (CEA-bb) strategy, with most of the signal detected earlier in the acquisition. The constant signal VEA strategy (VEA-const) yielded reduced signal earlier in order to preserve longitudinal magnetization for the later excitations. The VEA schedule that maximizes lactate (VEA-max) yields signal evolution that is similar to the CEA-bb schedule but with modestly higher lactate signal.
Figure 1. Representative excitation angle schedules and signal evolution for measurements with 23 dynamic observations and TR=2s.
Left panel (a-c) shows excitation angle schedule for constant broadband excitations (CEA-bb: a), constant signal variable excitation angle (VEA-const: b), and maximal total lactate signal variable excitation angle (VEA-max: c). Right panel (d-f) summarizes signal evolution for CEA-bb (d), VEA-const (e), VEA-max (f). VEA-const schedules result in severe reduction of pyruvate signal in order to maximize a constant lactate signal (e).
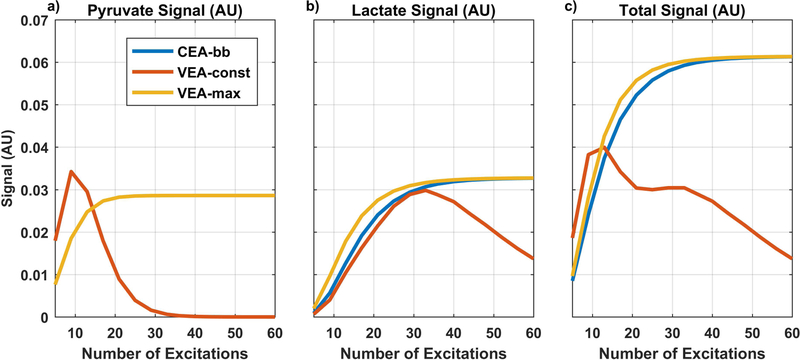
To explore tradeoffs between the number and amplitude of excitations and the detected signal, total pyruvate signal, total lactate signal, and total combined signal for all excitation angle strategies were each calculated and plotted as a function of scan duration (Figure 2). Compared with the CEA-bb strategy, VEA-const strategies improved the pyruvate signal (Fig 2a) when the acquisition time was very short (<30 seconds) but this improvement quickly diminished as the acquisition time increased. For the CEA-bb and VEA-max strategies, the pyruvate and lactate signal (Fig. 2a, 2b) monotonically increased and then plateaued at around 20 to 30 excitations (40–60s). The VEA-max strategy resulted in a modestly higher lactate signal in all tested cases.
Figure 2. Total noise-free pyruvate, lactate, and their combined signal as a function of the number of dynamic observations.
Three excitation angle strategies were compared: constant excitation angle broadband (CEA-bb) using a blue line, constant signal variable excitation angle (VEA-const) with a red line, and maximal lactate variable excitation angle (VEA-max) with a yellow line. The VEA-const strategy did not increase total signal except for the shortest acquisition times and this was primarily due to improved total pyruvate signal, while VEA-max resulted in the highest total lactate signal.
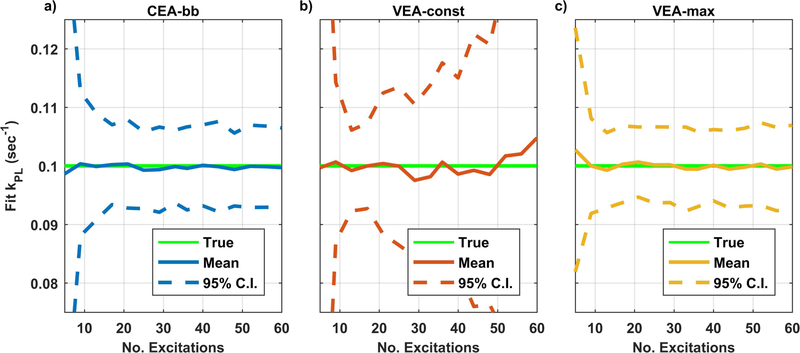
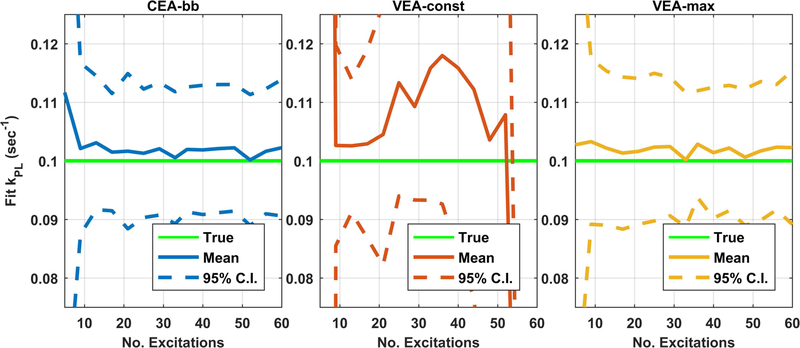
Figure 3 shows the mean and 95% confidence interval of values resulting from repeated pharmacokinetic analysis of noisy synthetic data as a function of the number of excitations. Reproducibility was compromised with all strategies for very short acquisitions due to insufficient observation of lactate. The VEA-const strategies showed slightly deteriorated but not statistically different accuracy and repeatability compared to the CEA-bb strategy for acquisitions of up to about 15 excitations (30s) (Fig. 3a vs 3b). For longer acquisitions, the VEA-const method had statistically higher variance due to very low excitation angles resulting in low SNR early in the scan when most chemical conversion is occurring. There was no statistically significant difference in accuracy or reproducibility between CEA-bb strategy and VEA-max. If perfusion parameters were also fit as additional unknowns, the reproducibility of all strategies deteriorated as illustrated in Figure 4, but the relative performance of these methods remains similar to those summarized in Figure 3.
Figure 3. Summary of mean and 95% confidence interval of kpl values derived from repeated analysis of noisy synthetic data.
The solid green line shows the value used in the generation of simulation data. The solid blue, red, and yellow lines represent the mean fit values for with the constant excitation angle broadband (CEA-bb), constant signal variable excitation angle (VEA-const), and maximal lactate variable excitation angle (VEA-max) design strategies, respectively. The dashed lines represent the 95% CI of the fit results determined from the standard deviation of 100 repeated fits with fresh Gaussian noise. There is no statistical difference between VEA-max and CEA-bb strategies but both have statistically improved repeatability compared to VEA-const strategy.
Figure 4. Summary of mean and 95% confidence interval of kpl values derived from repeated analysis of noisy synthetic with additional perfusion fit parameters.
Similar to Figure 3, the solid green line shows the value used in the generation of simulation data. The solid blue, red, and yellow lines represent the mean fit values for with CEA-bb, VEA-const, and VEA-max design strategies, respectively. The dashed lines represent the 95% CI of the fit results. When perfusion parameters must also be fit the repeatability of all methods is reduced. Similar to Figure 3, there is no statistical difference between VEA-max and CEA-bb strategies but both have statistically improved accuracy and repeatability compared to VEA-const strategy.
DISCUSSION AND CONCLUSIONS
This work suggests that CEA strategies as well as VEA strategies that maximize total lactate signal provide similarly accurate and reproducible quantification of metabolic rate constants. By contrast, VEA strategies that attempt to maintain a constant signal amplitude showed degraded accuracy and reproducibility of pharmacokinetic analyses as acquisitions got longer. Therefore, constant signal amplitude as a design goal for hyperpolarized studies should be avoided and simpler CEA strategies or strategies that maximize total signal should be given preference.
The VEA-const approach rarely results in maximal overall signal, as shown in Figure 2c. This was due to the penalty that VEA-const strategies incur to maintain a constant signal amplitude from a rapidly decaying signal pool, especially for longer scan durations. Not all variable excitation angle strategies suffer at longer duration, as shown by the strategy that is designed to maximize total lactate signal (VEA-max). VEA-max schedules resulted in a modestly higher lactate signal for all conditions tested. However, there are some practical disadvantage of VEA strategies that must be controlled for such as their sensitivity to errors in the transmit RF field (B1+) (13).
A noted limitation of these results is that they are exclusively numeric, and will need to be validated using measurements from physical systems. At present, there are no physical systems that can mimic vascular delivery and chemical conversion reproducibly enough with a known ground truth to permit this study to be carried out in vivo or in vitro. Additionally, this work assumes otherwise ideal measurement conditions and does not account for imperfections in the scanner, signal excitation, or detection.
Overall, this study shows that under otherwise ideal conditions, maximal signal variable excitation angle strategies as well as constant small excitation angle are equivalent in their ability to support accurate and reproducible quantification of signal evolution. Constant signal level variable excitation strategies showed reduced accuracy and reproducibility of quantitative measurements, especially for longer acquisitions. Constant signal variable excitation angle strategies may be best suited for imaging studies requiring multiple excitations to fill k-space, where segments with unequal amplitudes would induce artifacts. For dynamic studies that do not require segmented acquisitions, these results support a simple constant small excitation angle or maximal signal variable excitation angle strategies as the preferred methods.
Supplementary Material
ACKNOWLEDGMENTS
This work was supported in part by the National Institutes of Health (P30-CA016672, R01-CA211150, R01-EB016741, P41-EB013598), GE Healthcare and the Cancer Prevention and Research Institute of Texas (RP170366). The content is solely the responsibility of the authors and does not necessarily represent the official views of these agencies.
The authors also gratefully acknowledge the Texas Advanced Computing Center (TACC) at The University of Texas at Austin for providing resource which contributed to these results. URL: http://www.tacc.utexas.edu
Appendix A: Derivation of Optimal Excitation Angles with Arbitrary Input
Consider the sequence of longitudinal magnetization and transvers magnetization with a decay and some arbitrary amount of signal is allowed to be added to the system during each period represented by .
Here, represents longitudinal relaxation of HP signal in between excitations. The total signal, , is the summer of the transverse magnetization.
| [A1] |
Necessary conditions for optimum excitation angles is that the gradient of the total signal vanishes.
The final excitation angle only appears in the final term. Thus,
For each excitation angle,
Thus for
| [A2] |
This relationship yields a recursion such that depends only on .
| [A3] |
This recursion matches the basis for equation [8] in (11).
REFERENCES.
- 1.Golman K, in ‘t Zandt R, Thaning M. Real-time metabolic imaging. Proc Natl Acad Sci U S A 2006;103(30):11270–11275. [DOI] [PMC free article] [PubMed] [Google Scholar]
- 2.Golman K, Ardenkjaer-Larsen JH, Petersson JS, Mansson S, Leunbach I. Molecular imaging with endogenous substances. Proc Natl Acad Sci U S A 2003;100(18):10435–10439. [DOI] [PMC free article] [PubMed] [Google Scholar]
- 3.Kurhanewicz J, Vigneron DB, Brindle K, et al. Analysis of cancer metabolism by imaging hyperpolarized nuclei: prospects for translation to clinical research. Neoplasia 2011;13(2):81–97. [DOI] [PMC free article] [PubMed] [Google Scholar]
- 4.Nelson SJ, Kurhanewicz J, Vigneron DB, et al. Metabolic imaging of patients with prostate cancer using hyperpolarized [1-(1)(3)C]pyruvate. Sci Transl Med 2013;5(198): [DOI] [PMC free article] [PubMed] [Google Scholar]
- 5.Golman K, Zandt RI, Lerche M, Pehrson R, Ardenkjaer-Larsen JH. Metabolic imaging by hyperpolarized 13C magnetic resonance imaging for in vivo tumor diagnosis. Cancer Res 2006;66(22):10855–10860. [DOI] [PubMed] [Google Scholar]
- 6.Day SE, Kettunen MI, Gallagher FA, et al. Detecting tumor response to treatment using hyperpolarized 13C magnetic resonance imaging and spectroscopy. Nat Med 2007;13(11):1382–1387. [DOI] [PubMed] [Google Scholar]
- 7.Merritt ME, Harrison C, Storey C, Jeffrey FM, Sherry AD, Malloy CR. Hyperpolarized 13C allows a direct measure of flux through a single enzyme-catalyzed step by NMR. Proc Natl Acad Sci U S A 2007;104(50):19773–19777. [DOI] [PMC free article] [PubMed] [Google Scholar]
- 8.Albers MJ, Bok R, Chen AP, et al. Hyperpolarized 13C lactate, pyruvate, and alanine: noninvasive biomarkers for prostate cancer detection and grading. Cancer Res 2008;68(20):8607–8615. [DOI] [PMC free article] [PubMed] [Google Scholar]
- 9.Kurhanewicz J, Vigneron DB, Ardenkjaer-Larsen JH, et al. Hyperpolarized (13)C MRI: Path to Clinical Translation in Oncology. Neoplasia 2018;21(1):1–16. [DOI] [PMC free article] [PubMed] [Google Scholar]
- 10.Ardenkjaer-Larsen JH, Fridlund B, Gram A, et al. Increase in signal-to-noise ratio of > 10,000 times in liquid-state NMR. Proc Natl Acad Sci U S A 2003;100(18):10158–10163. [DOI] [PMC free article] [PubMed] [Google Scholar]
- 11.Nagashima K Optimum pulse flip angles for multi-scan acquisition of hyperpolarized NMR and MRI. J Magn Reson 2008;190(2):183–188. [DOI] [PubMed] [Google Scholar]
- 12.Xing Y, Reed GD, Pauly JM, Kerr AB, Larson PE. Optimal variable flip angle schemes for dynamic acquisition of exchanging hyperpolarized substrates. J Magn Reson 2013;234:75–81. [DOI] [PMC free article] [PubMed] [Google Scholar]
- 13.Maidens J, Larson PEZ, Arcak M. Optimal experiment design for physiological parameter estimation using hyperpolarized carbon-13 magnetic resonance imaging 2015 American Control Conference (Acc) 2015:5770–5775. [Google Scholar]
- 14.Larson PE, Kerr AB, Chen AP, et al. Multiband excitation pulses for hyperpolarized 13C dynamic chemical-shift imaging. J Magn Reson 2008;194(1):121–127. [DOI] [PMC free article] [PubMed] [Google Scholar]
- 15.Walker CM, Lee J, Ramirez MS, Schellingerhout D, Millward S, Bankson JA. A catalyzing phantom for reproducible dynamic conversion of hyperpolarized [1-(1)(3)C]-pyruvate. PLoS One 2013;8(8):e71274. [DOI] [PMC free article] [PubMed] [Google Scholar]
- 16.Bankson JA, Walker CM, Ramirez MS, et al. Kinetic Modeling and Constrained Reconstruction of Hyperpolarized [1–13C]-Pyruvate Offers Improved Metabolic Imaging of Tumors. Cancer Res 2015;75(22):4708–4717. [DOI] [PMC free article] [PubMed] [Google Scholar]
- 17.Lau JY, Chen AP, Gu YP, Cunningham CH. Voxel-by-voxel correlations of perfusion, substrate, and metabolite signals in dynamic hyperpolarized (13) C imaging. NMR Biomed 2016;29(8):1038–1047. [DOI] [PubMed] [Google Scholar]
- 18.Sun CY, Walker CM, Michel KA, Venkatesan AM, Lai SY, Bankson JA. Influence of parameter accuracy on pharmacokinetic analysis of hyperpolarized pyruvate. Magn Reson Med 2017. [DOI] [PMC free article] [PubMed]
- 19.Walker CM, Chen Y, Lai SY, Bankson JA. A novel perfused Bloch-McConnell simulator for analyzing the accuracy of dynamic hyperpolarized MRS. Med Phys 2016;43(2):854. [DOI] [PMC free article] [PubMed] [Google Scholar]
- 20.Bahrami N, Swisher CL, Von Morze C, Vigneron DB, Larson PE. Kinetic and perfusion modeling of hyperpolarized (13)C pyruvate and urea in cancer with arbitrary RF flip angles. Quant Imaging Med Surg 2014;4(1):24–32. [DOI] [PMC free article] [PubMed] [Google Scholar]
- 21.Kazan SM, Reynolds S, Kennerley A, et al. Kinetic modeling of hyperpolarized (13)C pyruvate metabolism in tumors using a measured arterial input function. Magn Reson Med 2013;70(4):943–953. [DOI] [PubMed] [Google Scholar]
- 22.Karlsson M, Jensen PR, Ardenkjaer-Larsen JH, Lerche MH. Difference between Extra- and Intracellular T1 Values of Carboxylic Acids Affects the Quantitative Analysis of Cellular Kinetics by Hyperpolarized NMR. Angew Chem Int Ed Engl 2016;55(43):13567–13570. [DOI] [PubMed] [Google Scholar]
Associated Data
This section collects any data citations, data availability statements, or supplementary materials included in this article.


