

Abstract
The photosensitizer (PS) is an essential component of photodynamic therapy (PDT). Conventional PSs are often porphyrin derivatives, which are associated with high hydrophobicity, low quantum yield in aqueous solutions, and suboptimal tumour-to-normal-tissue (T/N) selectivity. There have been extensive efforts to load photosensitizers into nanoparticle carriers to improve pharmacokinetics. The approach, however, is often limited by photosensitizer self-quenching, pre-mature release, and nanoparticle accumulation in the reticuloendothelial system (RES) organs. Herein, we report a novel, nanoparticle-based photosensitizer made of gadolinium-encapsulated graphene carbon nanoparticles (Gd@GCNs), which feature a high 1O2 quantum yield. Meanwhile, Gd@GCNs afford strong fluorescence and high T1 relaxivity (16.0 mM−1s−1, 7 T), making them an intrinsically dual-modal imaging probe. Having a size of approximately 5 nm, Gd@GCNs can accumulate in tumours through the enhanced permeability and retention (EPR) effect. The unbound Gd@GCNs cause little toxicity because Gd is safely encapsulated within an inert carbon shell and because the particles are efficiently excreted from the host through renal clearance. Studies with rodent tumour models demonstrate the potential of the Gd@GCNs to mediate image-guided PDT for cancer treatment. Overall, our studies show that Gd@GCNs possess unique physical, pharmaceutical, and toxicological properties and are an all-in-one nanotheranostic tools with substantial clinical translation potential.
Keywords: gadolinium-encapsulated graphene carbon dots (Gd@GCNs), imaging agent, renal clearance, singlet oxygen, photodynamic therapy
Theranostic carbon dots: Gadolinium-encapsulated graphene carbon nanotheranostics are synthesized and utilized for imaging-guided photodynamic therapy. Gd ions play important roles in the formation of graphene structures, unique absorbances and high singlet oxygen quantum yields. These nanotheranostic tools exhibit low-toxicity and can be efficiently excreted by renal clearance from the host after systemic injection.
Photodynamic therapy (PDT) employs PS to produce reactive oxygen species (ROS) upon light irradiation. PDT has shown substantial promise in treating different types of tumours in both pre-clinical and clinical settings.[1] However, conventional PDT utilizes small molecule photosensitizers, many of which are associated with poor water solubility, suboptimal photostability, and low tumour selectivity. Emerging nanotechnology provides solutions to some of these issues. Nanoparticle carriers can be loaded with a large amount of photosensitizers and can deliver them to tumours through either a passive or active targeting approach.[2] Moreover, imaging components can be co-loaded onto nanoplatforms, producing theranostic agents possessing both imaging and therapy functionalities.[3] This allows photoirradiation to be guided by imaging to tumours at the optimal drug-light interval and tissue coverage. Despite the extensive research, the current nanotheranostic agents share some common drawbacks.[4] For instance, imaging or PDT agents may fall off from nanoparticles, leading to inaccurate imaging-guidance and collateral damage to normal tissues. Moreover, many nanoparticle carriers are potentially toxic and their clearance from the host slow. Furthermore, nanoparticle carriers or imaging agents may interfere with the PDT process, leading to reduced reactive oxygen species (ROS) production.
In this study, we investigated Gd-encapsulated graphene carbon nanoparticles (Gd@GCNs) as a novel, nanoparticle-based photosensitizer for PDT. Carbon dots (C-dots) have been extensively studied as optical probes.[5] We and others have also loaded and encapsulated gadolinium into carbon dots and investigated the potential of the nanoparticles in T1 imaging.[6] One issue is that conventional, calcination-made carbon dots are amorphous in structure. They have broad absorbance in blue and ultra-violet regions, where emission has limited tissue penetration. These nanoparticles also show poor singlet oxygen (1O2) generation under photoirradiation, probably due to the poor electronic conductivity in the amorphous structures.
Herein, we report the synthesis of 5 nm Gd@GCNs through a hydrothermal reaction. Compared to conventional C-dots, Gd@GCNs show high crystallinity, strong red fluorescence, good Gd encapsulation (37.6 wt%), and high T1 relaxivity (16 mM−1s−1, 7 T). More excitingly, these crystalline Gd@GCNs efficiently produce 1O2 under light irradiation, making them a unique nanotheranostic agent intrinsically integrated with fluorescence, MRI, and PDT properties. Gd@GCNs are immune from photobleaching, metal falloff, and pre-mature drug release, which are commonly seen with conventional multifunctional nanoparticles. It is also postulated that after systemic injection, Gd@GCNs can accumulate in tumours through the EPR effect; meanwhile, with a size of 5 nm, unbound Gd@GCNs are expected to be efficiently excreted through renal clearance, causing no long-term side effects to the host. We tested these hypotheses first in vitro and then in vivo with head and neck carcinoma tumour models.
The Gd@GCNs were prepared by a solvothermal reaction using p-phenylenediamine (pPD) and Gd(NO3)3 as precursors. Briefly, pPD and Gd(NO3)3 were dissolved in ethanol, and the solution was heated in an autoclave at 180 °C. The products were purified by dialysis and were collected by centrifugation. Unlike C-dots made through calcination, which are pale brown, Gd@GCNs showed a vivid wine-like colour (Figure S1). Transmission electron microscopy (TEM) showed that Gd@GCNs were relatively monodisperse and had an average diameter of ~ 5 nm (Figure 1a). High-resolution TEM (HRTEM) imaging demonstrated that Gd@GCNs had a high crystallinity, with a lattice spacing of 0.21 nm, which was ascribed to the (100) phase of graphene (Figure 1b).[7] Dynamic light scattering (DLS) showed a relatively narrow size distribution with a hydrodynamic diameter of approximately 11.7 nm at a concentration of 50 µg/mL (Figure S2a). The increased average size determined by DLS was caused by the measurement of the overall hydrodynamic diameter, which is affected by surface charge, absorbed molecules and ions.[8] The DLS showed increased hydrodynamic diameter with increasing Gd@GCN concentration (Figure S2b–d), suggesting the presence of aggregates in concentrated solution. Normally, both sample concentration and fluorescence will influence DLS results.[9] We believe the difference is caused by interference of Gd@GCN fluorescence.[10] Energy dispersive X-ray analysis (EDXA) revealed that the Gd@GCNs were composed of C, O, Gd, and N elements, and the Gd content was approximately 37.6 wt% (Figure 1c and the inset table). Inductively coupled plasma mass spectrometry (ICP-MS) found a Gd content of 30.8 wt% in Gd@GCNs, which agreed well with the EDAX result (Figure 1c).
Figure 1. Structural characterization of Gd@GCNs.
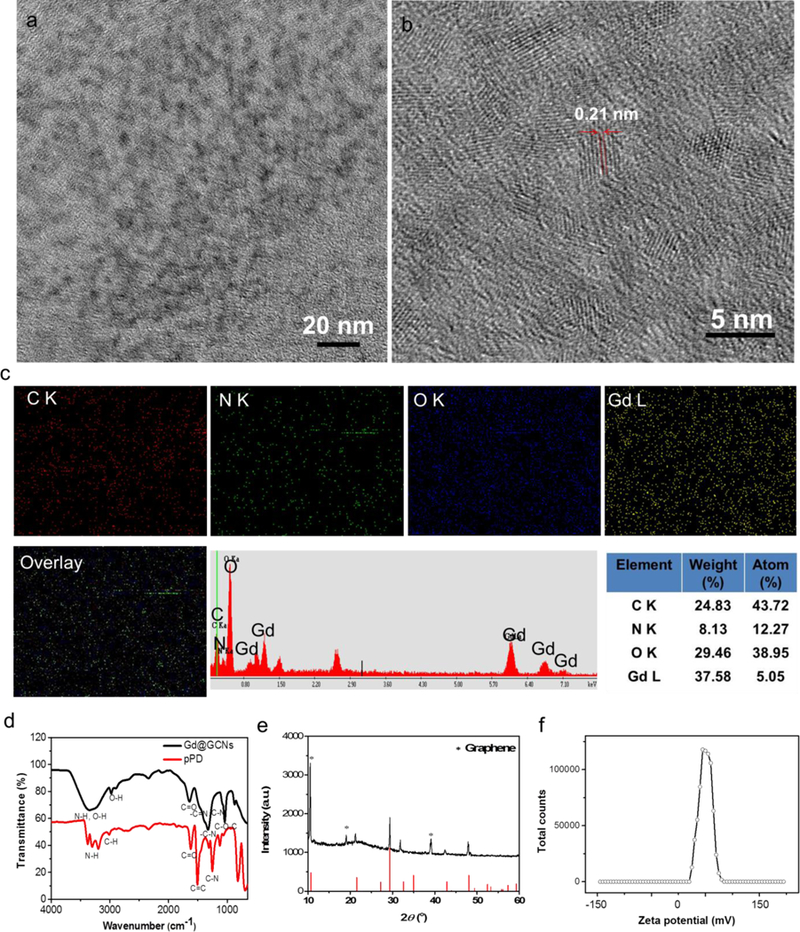
(a) TEM image of the Gd@GCNs. (b) HRTEM image of the Gd@GCNs revealed the graphene structure. (c) Elemental maps and EDAX spectrum of the Gd@GCNs. (d) FTIR spectra of the pPD and of Gd@GCNs. (e) XRD pattern of the Gd@GCNs. (f) Surface charge of the Gd@GCNs.
Next, we performed X-ray photoelectron spectroscopy (XPS) to further investigate the chemical composition of Gd@GCNs. The survey XPS spectrum indicated the presence of Gd, C, N, and O (Figure S3a). The Gd4d data revealed the Gd4d5/2, Gd4d3/2 and Gd3d5/2 lines (Figure S3b,c), suggesting that Gd existed as Gd3+ in the Gd@GCNs.[11] The high-resolution C1s data disclosed the presence of sp2/sp3 carbon (C-C/C=C), nitrous carbon (C-N), and oxygenated carbon (C-O, C=O, COO-) (Figure S3d).[12] Meanwhile, four peaks of N1s corresponding to pyridinic, pyridonic, graphitic, and oxidized nitrogen (Figure S3e), respectively, and two O1s bands corresponding to C=O and C-O, were also identified (Figure S3f).
Fourier transform infrared spectroscopy (FTIR) found peaks at 1650, 1600 and 1340 cm−1, which were attributable to the stretching vibrations of C=N/C=O, C=C and C-N=, respectively (Figure 1d).[13, 14] Meanwhile, a broad peak at 3400 cm−1 and a relatively small one at 2950 cm−1 suggested the presence of N-H and O-H in the nanocomposite; strong absorbance at 1720, 1300 and 1050 cm−1 are characteristic C=O and C-O peaks. The 13C NMR spectrum revealed three carbon peaks (Figure S4): 100–150 ppm (sp2 carbon atoms, C=C) and 160–220 ppm (sp2 carbon atoms, C=O).[15] The 1H NMR spectrum found three H peaks, and the major peaks at approximately 1 and 4.4 ppm were ascribed to the surface functional groups of Gd@GCNs (Figure S5). These results suggested the decomposition of pPD, and the condensation of the molecules during carbonization, forming C=N/C=O, C=C and C-N bonds.[13]
X-ray diffraction (XRD) identified peaks resembling those from the trigonal structure of Gd2O2CN2 (PDF#49–1169) with the space group P-3m1 and the linear carbon layers with the surface group (COO− and C-N22−) ions lying perpendicular to RE2O22+ (RE = Ln, Nd, Sm, Eu, Gd) layers (Figure 1e).[16] The Gd3+ ions were coordinated with four oxygen and three nitrogen atoms in a seven coordinated geometry with the oxygen and the metal in the same plane.[17] The characteristic peaks of graphene at 12° (2θ) (labelled by star) were also found, which agreed well with the HRTEM image. Raman scattering found a D band at 1320 cm−1 (Figure S6). This band originated from hybridized vibrational modes associated with graphene edges and was often referred to as the disorder band or the defect band. The D peak corresponded to the A1g phonon breathing mode and was activated by defects arising from the transverse optical (TO) phonons near the K points exactly at the first Brillouin zone.[18] The D band, which was attributed to disordered sp3 carbon, was quite dispersive with the aid of excitation energy, which occurs due to the Kohn Anomaly at K.[19]
We also evaluated the stability of Gd@GCNs in different solvents. As-synthesized Gd@GCNs formed stable colloidal solutions in water and different biological fluids (Figure S7, 8a). The DLS results showed that the biological fluids had negligible aggregation (Figure S8b–d). This was due to the abundant surface hydrophilic functional groups. Zeta potential analysis found a positive surface charge (+21.2 mV), which was attributed to the surface primary and secondary amine groups (Figure 1f). Gel electrophoresis showed that Gd@GCNs migrated to the anode in one narrow band, confirming the positive surface charge and uniform particle size (Figure S9).[20]
Next, we investigated the optical properties of the Gd@GCNs. UV-Vis analysis found three peaks at 465 nm, 526 nm and 710 nm, suggesting the existence of multiple electronic transitions (Figure 2a).[21] As a comparison, conventional C-dots and Gd@C-dots showed only one broad peak in the UV region that corresponded to a π→π* transition. Moreover, Gd@GCNs displayed strong red fluorescence, whereas conventional C-dots showed weak luminescence above 550 nm (Figure 2b,c).[6] Closer examination found multiple emission peaks at 550 nm, 570 nm and 580 nm, which were derived from excitations at 400 nm, 520 nm and 550 nm, respectively (Figure 2b). The maximum quantum yield was 10.2% under excitation at 550 nm.
Figure 2. Optical properties and magnetic resonance contrast effect of Gd@GCNs.
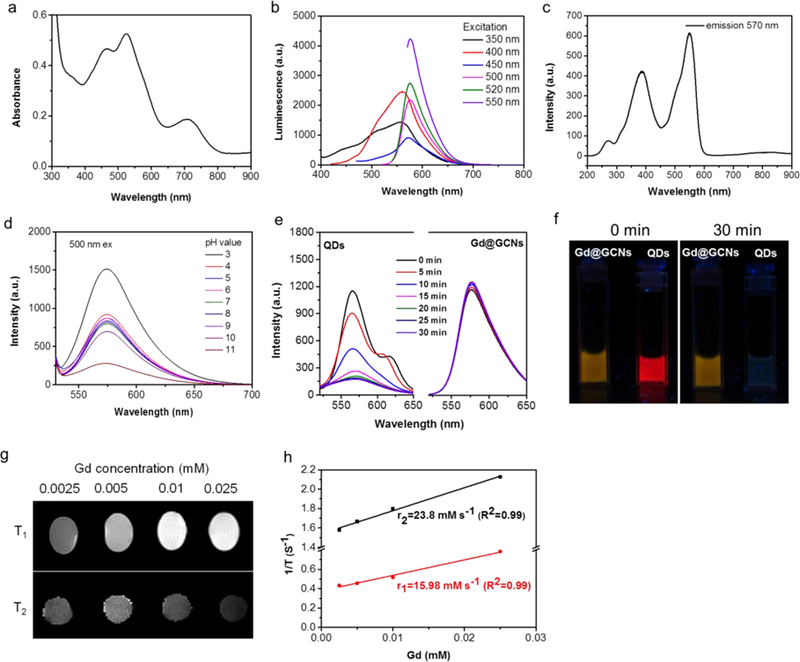
(a) Absorption spectrum of the Gd@GCNs. (b) Emission spectra of the Gd@GCNs. (c) Excitation spectrum of the Gd@GCNs (em: 570 nm). (d) Stability of the Gd@GCNs in different pH solutions. The Gd@GCNs were dispersed in a solution for 24 h. Excitation: 500 nm. (e) Photostability of the Gd@GCNs under 254 nm UV light (8 W) irradiation. Compared with commercial CdSe@ZnS QDs, the Gd@GCNs showed excellent photostability. The CdSe/ZnS QDs showed rapid photobleaching due to the light-irradiated surface redox reaction. (f) Comparison of the photostability of the Gd@GCNs in water and CdSe/ZnS QDs in chloroform. The solutions were under continuous irradiation with UV light (8 W, 254 nm) for different durations of time. (g) T1 and T2 MR images of the Gd@GCNs in 1 wt% agarose gel of the 7 T system. The upper part in the panel shows the T1 images and the lower part shows the T2 images. (h) R1 and R2 relaxivities of the Gd@GCNs as a function of the molar concentration of Gd3+ in the solution.
We also studied the impact of pH and long-term light exposure on the luminescence properties of Gd@GCNs. As shown in Figure 2d, changing the pH from 3 to 10 did not affect the nanoparticles’ fluorescence. Irradiation with 254 nm UV light for 0.5 h did not bleach the nanoparticles, either (Figure 2e,f). As a comparison, the fluorescence of commercial CdSe@ZnS quantum dots (QDs) was completely bleached within 30 min. These data suggested the superior chemical and photostability of the nanoparticles.[22]
We measured the longitudinal (r1) and transverse (r2) relaxivities of Gd@GCNs through an agar gel phantom study on a Varian 7.0 T imaging system (Figure 2g,h). The r1 relaxivity of Gd@GCNs was 16.0 mM−1 s−1 (Figure 2h), which was more than five times higher than that of Gd-DTPA (3.1 mM−1s−1) on the same Gd basis.[23] The r2 relaxivity was 23.8 mM−1 s−1, suggesting a low r2/r1 and great potential of Gd@GCNs as a T1 contrast agent.
Generation of 1O2 was evaluated using a 9,10-anthracenediyl-bis(methylene) dimalonic acid (ABDA) assay (Figure 3).[24] The absorption of ABDA at 378 nm rapidly decreased under LED flashlight irradiation (15 mW/cm2, Gd@GCNs concentration: 50 µg/mL, Figure S10), suggesting efficient 1O2 generation (Figure S11,12). The 1O2 quantum yield was quantified using ABDA as a 1O2 sensor, Rose Bengal (RB) as the standard photosensitizer, and by following the equation:
where KGd@GCNs and KRB are the decomposition rate constants of ABDA by the Gd@GCNs and by RB, respectively; AGd@GCNs and ARB are the light absorbed by the Gd@GCNs and by RB, respectively; and ФRB is the 1O2 quantum yield of RB (ФRB = 0.75 in water). It was determined that the 1O2 quantum yield of the Gd@GCNs was 0.51 (Figure S12), which is superior to most conventional photosensitizers in aqueous solutions.[25]
Figure 3. In vitro imaging and photodynamic therapy efficacy.
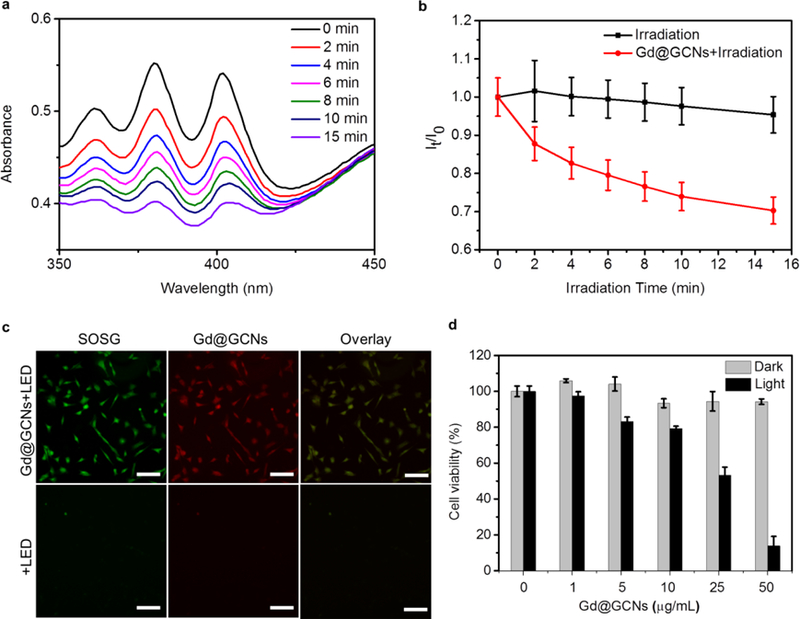
(a) Time-dependent absorption spectra of the ABDA with Gd@GCNs in the air. (b) Normalized absorbance of ABDA at 380 nm as a function of irradiation time in the presence of Gd@GCNs. (c) Singlet oxygen generation in SCC-7 cells and fluorescence images of SCC-7 cells incubated with Gd@GCNs (50 µg/mL) for 2 h. Scale bar: 100 µm. (d) Dose-dependent PDT effects on the viability of SCC-7 cells, analysed by MTT assays.
We then evaluated the cytotoxicity of Gd@GCNs with SCC-7 cells, a mouse head and neck carcinoma cell line. MTT assays found no detectable viability drop of Gd@GCNs in the dark even at a high Gd concentration (100 µg/mL) (Figure S13). This is attributed to the inert carbon shell that prevents Gd leakage or transmetallation (Figure S14).[26] Fluorescence images were obtained from the SCC-7 cells on an Olympus IX71 fluorescence microscope. After incubation with 0.1 mg/mL Gd@GCNs for 2 h, intense and homogeneous red fluorescence was found in the cytosol, especially around the nuclei (Figure S15), suggesting that the Gd@GCNs can be internalized by cells without a targeting ligand. In contrast, Gd@GCNs under photoirradiation efficiently produced cytotoxic 1O2 inside cells. This result was investigated using singlet oxygen sensor green (SOSG) as a fluorogenic marker of 1O2.[27] As shown in Figure 3c, SOSG was strongly activated when the SCC7 cells were treated with Gd@GCNs plus LED irradiation. The green fluorescence overlapped well with the red fluorescence from Gd@GCNs (Figure S16), confirming that the singlet oxygen was generated in situ from Gd@GCNs. These radicals translated to phototoxicity against cells (Figure 3d). For instance, when SCC-7 cells were incubated with Gd@GCNs (25 µg/mL) for 4 h, followed by LED irradiation (15 mW cm–2 for 20 min), the cell viability dropped by 46.8 ± 4.5% (Figure 3d, black column).
Next, we explored the feasibility of using Gd@GCNs as a fluorescence and MRI dual modal imaging probe in vivo. We started by subcutaneous injection of 5 µL and 20 µL of 2 mg/mL Gd@GCNs to the back of a nude mouse. We then scanned the mouse in a Maestro system (Figure S17). We observed strong red fluorescence at the injection site. The signals can be clearly differentiated from the green autofluorescence from the animal body (Figure S18). For fluorescence imaging, we injected Gd@GCNs (0.1 mmol Gd/kg) via the tail vein to the SCC-7 tumour-bearing nude mice (n = 3) and then scanned the animals on a Maestro II system at 10 min, 30 min, 1 h, 3 h, and 24 h post-injection. Strong fluorescence and MR signals were found in the tumour region, and the intensity peaked at 1 h (Figure S19). This result was attributed to EPR effect mediated nanoparticle deposition in tumours. After imaging at the 24 h time point, the tumours and major organs were harvested and scanned ex vivo (Figure S19a,b). Intense signals were found in the tumours. Meanwhile, nanoparticles were also found in the liver, spleen, and kidneys (Figure S19a,b).
Interestingly, intense fluorescence signals were found in the bladder after the nanoparticle injection (Figure S20a), suggesting renal clearance of the 5 nm nanoparticles. To examine the integrity of the nanoparticles after excretion, we collected urine samples after 0.5 h and subjected them to centrifugal filtration (MWCO = 3000). We observed strong fluorescence characteristic of Gd@GCNs in the upper fraction (Figure S20b). Meanwhile, no fluorescence or Gd content (by ICP-MS) was found in the filtrate. This result was also confirmed by TEM, as intact Gd@GCNs were found in the upper fraction but none were found in the filtrate (Figure S20c).
For in vivo MRI, we intravenously injected Gd@GCNs (0.1 mmol Gd/kg) into SCC-7 tumour-bearing nude mice (n = 3) and scanned the animals at 0.5, 1, 3, and 24 h on a 7T system. We observed significant signal increase on T1-weighted images, suggesting nanoparticle accumulation in tumours. The signal enhancement was the most prominent at 1 h, which agreed with the fluorescence imaging results. We also found hyperintensities in the bladder at 30 min after nanoparticle injection, confirming efficient renal clearance.
We tested in vivo PDT on SCC-7 tumour-bearing nude mice. When the subcutaneously inoculated SCC-7 tumours grew to 100 mm3, we randomly divided the animals into three groups and treated them with the following regimens: i) PBS only; ii) Gd@GCNs (0.1 mmol Gd/kg) only; and iii) Gd@GCNs (0.1 mmol Gd/kg) plus LED irradiation. For Group iii, the irradiation (100 mW cm−2 for 30 min) was applied to the tumour area at 1 h post nanoparticle injection, with the rest of the body covered by aluminium foil. Gd@GCNs alone induced no tumour suppression relative to the PBS control. As a comparison, Gd@GCNs plus irradiation effectively delayed tumour growth. On Day 12, we observed a tumour inhibition rate of 2.4±1.6 and 19.9±7.9 in the PDT group and control group, respectively. Meanwhile, neither the nanoparticles nor the PDT treatment seemed to affect the animal body weight (Figure 4e).
Figure 4. In vivo imaging.
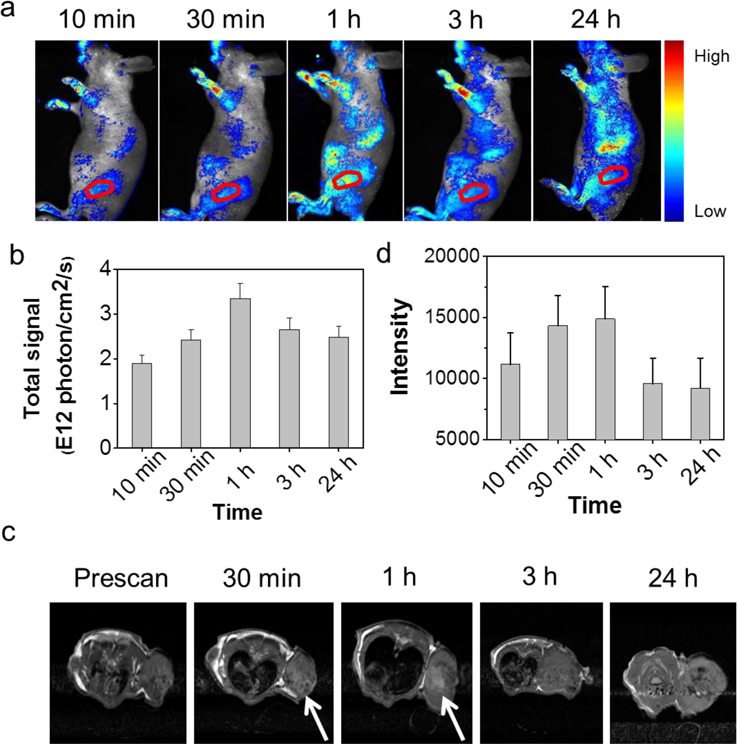
(a) In vivo fluorescence images acquired from nude mice bearing tumours after intravenous injection of Gd@GCNs at different time intervals. Ex: 500 nm, Em: 520–720 nm. The red circles mark the tumour position. (b) Corresponding data analysis of the tumour in a. (c) In vivo MR images of the nude mice after intravenous injection of Gd@GCNs at different time intervals. The white arrows mark the significant changes of MR signals. (d) Corresponding data analysis of the tumour in c.
The effective PDT treatment was also validated by post-mortem haematoxylin and eosin (H&E) staining. Specifically, we observed damaged architectures in tumours, along with significantly reduced cell density (Figure 4c). As revealed in the magnified images in Figure 4d, there were prominent late-stage apoptosis features including karyopyknosis, karyorrhexis, karyolysis, and formation of apoptotic bodies in the tumours treated by Gd@GCN PDT.[28] As a comparison, tumours from the PBS and Gd@GCN only group showed densely packed neoplastic cells (Figure 4c,d). Meanwhile, we found no signs of systemic toxicity in the PDT group. There was little indication of inflammation, cell necrosis, or apoptosis in organs such as the brain, heart, kidneys, liver and spleen on H&E staining (Figure S21). In addition, there were no significant changes in mouse serum chemistry (Table S1)[29]. Therefore, the Gd@GCNs can be considered nontoxic. The biodistribution (Figure S22) and clearance patterns (Figure S23) suggest that the Gd@GCNs can work as a clearable theranostic agent for image-guided PDT.
To better understand the relationship between the structure and the properties of the Gd@GCNs as well as the functions of Gd during synthesis, we also synthesized carbon dots by solvothermal reaction of pPD but in the absence of Gd(NO3)3. The resulting C-dots showed the same wine-red colour (Figure S24). Their size and surface charge were also comparable to those of the Gd@GCNs (Figure S25a–c). More significantly, XRD indicated that the C-dots had an amorphous structure, as opposed to the graphene crystalline structure of Gd@GCNs (Figure S25d). However, the absorption and luminescence spectra of the C-dots were different from Gd@GCNs (Figure 1a,b, S25e,f). For instance, we found a new absorption peak at approximately 510 nm for C-dots (Figure S25e) while the peak at approximately 710 nm disappeared. Meanwhile, we observed generally weaker emission from C-dots and the major emission peak was shifted to 570 nm under 450 nm excitation (Figure S25f).
Although the exact mechanisms are unknown, the results suggested that the Gd dopant played an important role in the formation of graphene carbon structures, and also affected the optical and magnetic properties of the nanoparticles. It was postulated that Gd served as a coordination centre in the formation of crystalline carbon layers and was intercalated in the final carbon structure, as illustrated in Figure S26. The metal coordination led to improved particle crystallinity and altered electronic states, resulting in red fluorescence.[14]
The high r1 of Gd@GCNs might be explained by a “secondary electron spin transfer” process.[30] Gd ions were bound to the surface functional moiety on the carbon layers to form a stable complex and then encased within carbon architectures. Specifically, the carbon shell in these nanostructures had delocalized electrons that coordinated with Gd(III) intercalated into the carbon layers. This outcome caused a shift in electron spins from the caged Gd to the whole carbon nanostructure. As a result, the water relaxation capacity was extended to the carbon shell that was directly exposed to the aqueous surroundings.[30] Moreover, the amine groups on the surface of the carbon shell might improve water retention for sufficient relaxation.[31]
The 1O2 quantum yield of Gd@GCNs was superior to most conventional, small molecule photosensitizers.[25] Previous studies had revealed that metal and nitrogen co-doped carbon could form porphyrin-like metal coordination centres.[32, 33] Similar to porphyrins, metal coordination centres could change their redox state, axial ligation, and electronic structure to create active sites (Figure S22b).[33] It is believed that Gd@GCNs with a similar structure afford strong spin-orbit coupling at the heavy-metal centre (i.e., Gd3+), leading to enhanced intersystem crossing, thus improving ROS production under photoirradiation.[34]
In summary, we report the large-scale synthesis of crystalline Gd@GCNs through a facile hydrothermal method. The obtained Gd@GCNs can be used as a dual-modal contrast agent for both fluorescence imaging and MRI. More uniquely, Gd@GCNs efficiently produce 1O2 under photoirradiation. Gd@GCNs accumulate in tumours through the EPR effect, with the unbound nanoparticles rapidly excreted through renal clearance, causing little to no long-term toxicity to the host. Our studies suggest that Gd@GCNs are intrinsic nanotheranostics for imaging-guided PDT and have profound potential for clinical translation.
Supplementary Material
Figure 5. In vivo PDT.
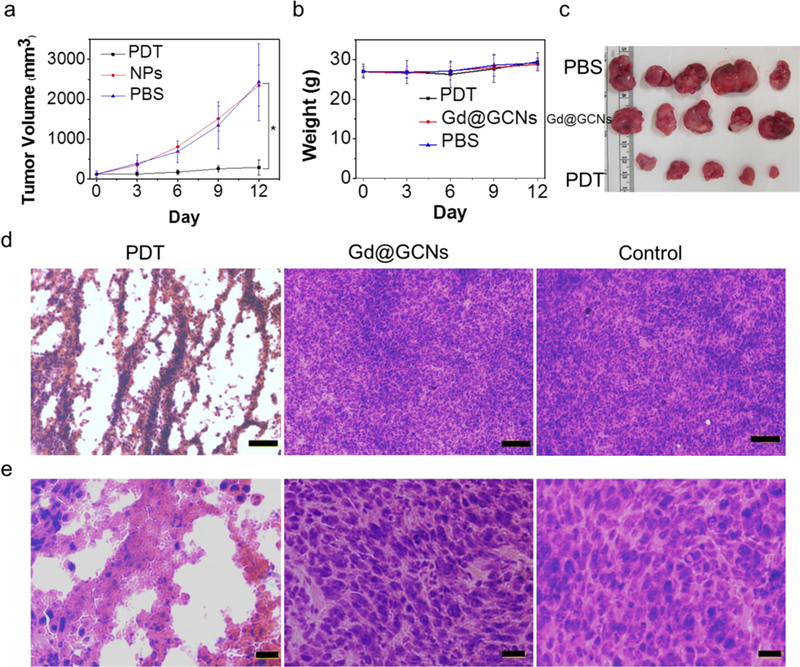
(a) Relative change in the tumour volume of the tumour-bearing mice after intravenous treatment. Significant tumour suppression and shrinkage are observed from the animals injected with PDT. In all the control groups, the tumours grow rapidly and at a comparable rate. The error bars indicate the standard deviation (s.d.) (n = 5). (b) Digital photographs of the tumours collected from different groups of mice at the end of intravenous treatment. (c) H&E staining of the tumour sections gathered from various treatment groups at the end of intravenous treatment at low magnification. Compared to the control from which densely packed neoplastic cells are observed throughout the mass, the tumours treated by PDT show a drastically impacted tumour architecture and significantly reduced cell density (Scale bar: 100 µm). (d) H&E staining of the tumour sections gathered from various treatment groups at the end of intravenous treatment at high magnification (Scale bar: 20 µm). (e) Body weight curves. The error bars indicate the s.d. (n = 5).
Scheme 1.
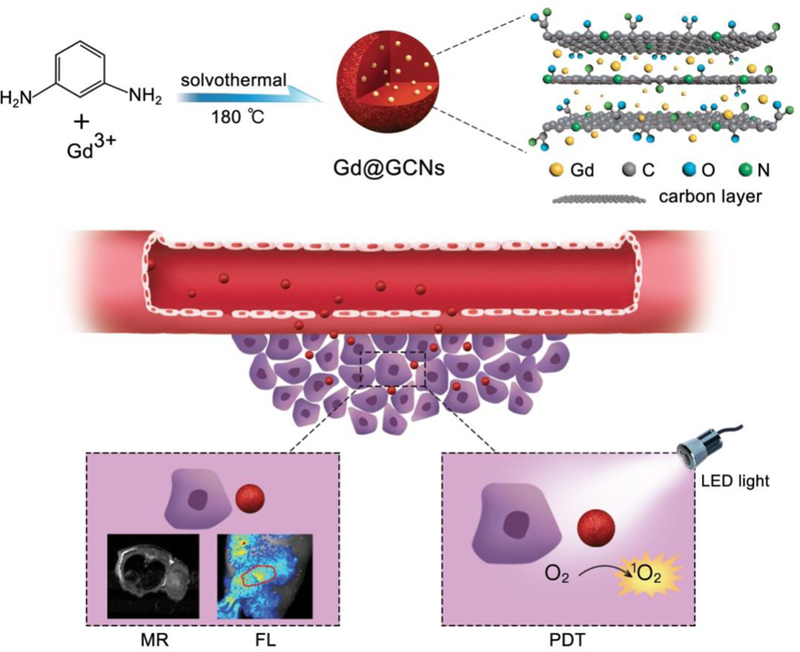
Schematic illustration of the Gd@GCNs as cancer nanotheranostic tools for imaging-guided phototherapy in solid tumours.
Acknowledgements
The work was supported by the National Key Research and Development Program of China (2018YFA0107301), the National Science Foundation of China (81771977, 81422023, 81371596, 51273165, U1505221), Xiamen Science and Technology Plan Project (3502Z20183017), the Major State Basic Research Development Program of China (2017YFA0205201, 2014CB744503, 2013CB733802), the Science Foundation of Fujian Province (2014Y2004), the Fundamental Research Funds for the Central Universities of China (20720180054, 20720150206, 20720150141), and the Intramural Research Program (IRP), National Institute of Biomedical Imaging and Bioengineering (NIBIB), National Institutes of Health (NIH). This work was also supported by the National Institutes of Health (R01EB022596, R01NS093314, ZIA EB000073), the Congressionally Directed Medical Research Programs grant (CA140666), and the National Science Foundation grant (NSF1552617).
Footnotes
Supporting Information
Supplementary figures and their legends, detailed materials, and methods. Supporting Information is available from the Wiley Online Library or from the author.
Contributor Information
Dr. Hongmin Chen, State Key Laboratory of Molecular Vaccinology and Molecular Diagnostics & Center for Molecular Imaging and Translational Medicine, School of Public Health, Xiamen University, Xiamen 361102, China, hchen@xmu.edu.cn
Yuwei Qiu, State Key Laboratory of Molecular Vaccinology and Molecular Diagnostics & Center for Molecular Imaging and Translational Medicine, School of Public Health, Xiamen University, Xiamen 361102, China.
Dandan Ding, State Key Laboratory of Molecular Vaccinology and Molecular Diagnostics & Center for Molecular Imaging and Translational Medicine, School of Public Health, Xiamen University, Xiamen 361102, China.
Huirong Lin, State Key Laboratory of Molecular Vaccinology and Molecular Diagnostics & Center for Molecular Imaging and Translational Medicine, School of Public Health, Xiamen University, Xiamen 361102, China.
Wenjing Sun, State Key Laboratory of Molecular Vaccinology and Molecular Diagnostics & Center for Molecular Imaging and Translational Medicine, School of Public Health, Xiamen University, Xiamen 361102, China.
Dr. Geoffrey D. Wang, Department of Chemistry, University of Georgia, Athens, Georgia 30602, USA
Weicheng Huang, Condensed Matter Science and Technology Institute, Department of Physics, Harbin Institute of Technology, Harbin, China.
Weizhong Zhang, Department of Chemistry, University of Georgia, Athens, Georgia 30602, USA.
Daye Lee, Department of Chemistry, University of Georgia, Athens, Georgia 30602, USA.
Dr. Gang Liu, State Key Laboratory of Molecular Vaccinology and Molecular Diagnostics & Center for Molecular Imaging and Translational Medicine, School of Public Health, Xiamen University, Xiamen 361102, China, gangliu.cmitm@xmu.edu.cn
Dr. Jin Xie, Department of Chemistry, University of Georgia, Athens, Georgia 30602, USA, jinxie@uga.edu
Dr. Xiaoyuan Chen, Laboratory of Molecular Imaging and Nanomedicine, National Institute of Biomedical Imaging and Bioengineering, National Institutes of Health, Bethesda, MD 20892, USA, shawn.chen@nih.gov
References
- [1].a) Dolmans DEJGJ, Fukumura D, Jain RK, Nat. Rev. Cancer 2003, 3, 380; [DOI] [PubMed] [Google Scholar]; b) Agostinis P, Berg K, Cengel KA, Foster TH, Girotti AW, Gollnick SO, Hahn SM, Hamblin MR, Juzeniene A, Kessel D, Korbelik M, Moan J, Mroz P, Nowis D, Piette J, Wilson BC, Golab J, CA Cancer J. Clin 2011, 61, 250. [DOI] [PMC free article] [PubMed] [Google Scholar]
- [2].Lucky SS, Soo KC, Zhang Y, Chem. Rev 2015, 115, 1990. [DOI] [PubMed] [Google Scholar]
- [3].a) Mura S, Couvreur P, Adv. Drug Delivery Rev 2012, 64, 1394; [DOI] [PubMed] [Google Scholar]; b) Kim TH, Lee S, Chen X, Expert Rev.Mol. Diag 2013, 13, 257. [DOI] [PMC free article] [PubMed] [Google Scholar]
- [4].Chen H, Zhang W, Zhu G, Xie J, Chen X, Nat. Rev. Mater 2017, 2, 17024; [DOI] [PMC free article] [PubMed] [Google Scholar]; Shi J, Kantoff PW, Wooster R, Farokhzad OC, Nat. Rev. Cancer 2017, 17, 20. [DOI] [PMC free article] [PubMed] [Google Scholar]
- [5].a) Zhu SJ, Song YB, Wang J, Wan H, Zhang Y, Ning Y, Yang B, Nano Today 2017, 13, 10; [Google Scholar]; b) Luo PJG, Sahu S, Yang ST, Sonkar SK, Wang JP, Wang HF, LeCroy GE, Cao L, Sun YP, J. Mater. Chem. B 2013, 1, 2116. [DOI] [PubMed] [Google Scholar]
- [6].a) Chen H, Wang GD, Sun XL, Todd T, Zhang F, Xie J, Shen BZ, Adv. Funct. Mater 2016, 26, 3973; [DOI] [PMC free article] [PubMed] [Google Scholar]; b) Chen H, Wang GD, Tang W, Todd T, Zhen ZP, Tsang C, Hekmatyar K, Cowger T, Hubbard RB, Zhang WZ, Stickney J, Shen BZ, Xie J, Adv. Mater 2014, 26, 6761. [DOI] [PMC free article] [PubMed] [Google Scholar]
- [7].Ge JC, Lan MH, Zhou BJ, Liu WM, Guo L, Wang H, Jia QY, Niu GL, Huang X, Zhou HY, Meng XM, Wang PF, Lee CS, Zhang WJ, Han XD, Nat. Commun 2014, 5, 4596. [DOI] [PMC free article] [PubMed] [Google Scholar]
- [8].a) Ray SC, Saha A, Jana NR, Sarkar R, J. Phys. Chem. C 2009, 113, 18546; [Google Scholar]; b) Tuoriniemi J, Johnsson ACJH, Holmberg JP, Gustafsson S, Gallego-Urrea JA, Olsson E, Pettersson JBC, Hassellov M, Sci. Technol. Adv. Mater 2014, 15, 035009. [DOI] [PMC free article] [PubMed] [Google Scholar]
- [9].Bhattacharjee S, J. Control. Release 2016, 235, 337. [DOI] [PubMed] [Google Scholar]
- [10].Geissler D, Gollwitzer C, Sikora A, Minelli C, Krumrey M, Resch-Genger U, Anal. Methods 2015, 7, 9785. [Google Scholar]
- [11].a) Xu Y, Jia XH, Yin XB, He XW, Zhang YK, Anal. Chem 2014, 86, 12122; [DOI] [PubMed] [Google Scholar]; b) Pan Y, Yang J, Fang YN, Zheng JH, Song R, Yi CQ, J. Mater. Chem. B 2017, 5, 92; [DOI] [PubMed] [Google Scholar]; c) Ren XY, Jing XL, Liu LH, Guo LP, Zhang M, Li Y, RSC. Adv 2014, 4, 53987. [Google Scholar]
- [12].Ge JC, Jia QY, Liu WM, Lan MH, Zhou BJ, Guo L, Zhou HY, Zhang HY, Wang Y, Gu Y, Meng XM, Wang PF, Adv. Healthc. Mater 2016, 5, 665. [DOI] [PubMed] [Google Scholar]
- [13].Pan LL, Sun S, Zhang AD, Jiang K, Zhang L, Dong CQ, Huang Q, Wu AG, Lin HW, Adv. Mater 2015, 27, 7782; [DOI] [PubMed] [Google Scholar]; Jiang K, Sun S, Zhang L, Lu Y, Wu AG, Cai CZ, Lin HW, Angew. Chem. Int. Ed 2015, 54, 5360. [DOI] [PubMed] [Google Scholar]
- [14].Qu SN, Zhou D, Li D, Ji WY, Jing PT, Han D, Liu L, Zeng HB, Shen DZ, Adv. Mater 2016, 28, 3516. [DOI] [PubMed] [Google Scholar]
- [15].Jia XF, Li J, Wang EK, Nanoscale 2012, 4, 5572. [DOI] [PubMed] [Google Scholar]
- [16].Hashimoto Y, Takahashi M, Kikkawa S, Kanamaru F, J. Solid. State Chem 1996, 125, 37. [Google Scholar]
- [17].Wang LT, Yuan SL, Yang YX, Chevire F, Tessier F, Chen GR, Opt. Mater. Express 2015, 5, 2616. [Google Scholar]
- [18].Ferrari AC, Robertson J, Phys. Rev. B 2001, 64, 075414. [Google Scholar]
- [19].a) Piscanec S, Lazzeri M, Mauri F, Ferrari AC, Robertson J, Phys. Rev. Lett 2004, 93, 185503; [DOI] [PubMed] [Google Scholar]; b) Kudin KN, Ozbas B, Schniepp HC, Prud’homme RK, Aksay IA, Car R, Nano Lett 2008, 8, 36. [DOI] [PubMed] [Google Scholar]
- [20].Sparks DL, Phillips MC, J. Lipid Res 1992, 33, 123. [PubMed] [Google Scholar]
- [21].Lu SY, Sui LZ, Liu JJ, Zhu SJ, Chen AM, Jin MX, Yang B, Adv. Mater 2017, 29, 1603443. [DOI] [PubMed] [Google Scholar]
- [22].Zhang J, Yu SH, Mater. Today 2016, 19, 382. [Google Scholar]
- [23].Kalavagunta C, Michaeli S, Metzger GJ, Contrast Media Mol. Imaging 2014, 9, 169. [DOI] [PMC free article] [PubMed] [Google Scholar]
- [24].Idris NM, Gnanasammandhan MK, Zhang J, Ho PC, Mahendran R, Zhang Y, Nat. Med 2012, 18, 1580. [DOI] [PubMed] [Google Scholar]
- [25].Redmond RW, Gamlin JN, Photochem. Photobiol 1999, 70, 391. [PubMed] [Google Scholar]
- [26].Chen ZY, Ma LJ, Liu Y, Chen CY, Theranostics 2012, 2, 238. [DOI] [PMC free article] [PubMed] [Google Scholar]
- [27].Kim S, Fujitsuka M, Majima T, J. Phys. Chem. B 2013, 117, 13985. [DOI] [PubMed] [Google Scholar]
- [28].a) Yamamoto J, Yamamoto S, Hirano T, Li SY, Koide M, Kohno E, Okada M, Inenaga C, Tokuyama T, Yokota N, Terakawa S, Namba H, Clin. Cancer Res 2006, 12, 7132; [DOI] [PubMed] [Google Scholar]; b) Marchal S, Fadloun A, Maugain E, D’Hallewin MA, Guillemin F, Bezdetnaya L, Biochem. Pharmacol 2005, 69, 1167; [DOI] [PubMed] [Google Scholar]; c) Xiao ZW, Halls S, Dickey D, Tulip J, Moore RB, Clin. Cancer Res 2007, 13, 7496; [DOI] [PubMed] [Google Scholar]; d) Zhang C, Zhao KL, Bu WB, Ni DL, Liu YY, Feng JW, Shi JL, Angew. Chem. Int. Ed 2015, 54, 1770. [DOI] [PubMed] [Google Scholar]
- [29].a) Shao SQ, Zhou Q, Si JX, Tang JB, Liu XR, Wang M, Gao JQ, Wang K, Xu RZ, Shen YQ, Nat. Biomed. Eng 2017, 1, 745; [DOI] [PubMed] [Google Scholar]; b) Chu CC, Lin HR, Liu H, Wang XY, Wang JQ, Zhang PF, Gao HY, Huang C, Zeng Y, Tan YZ, Liu G, Chen XY, Adv. Mater 2017, 29, 1605928. [DOI] [PMC free article] [PubMed] [Google Scholar]
- [30].Cui RL, Li J, Huang H, Zhang MY, Guo XH, Chang YA, Li M, Dong JQ, Sun BY, Xing GM, Nano Res 2015, 8, 1259. [Google Scholar]
- [31].Zhang JF, Fatouros PP, Shu CY, Reid J, Owens LS, Cai T, Gibson HW, Long GL, Corwin FD, Chen ZJ, Dorn HC, Bioconjug. Chem 2010, 21, 610. [DOI] [PMC free article] [PubMed] [Google Scholar]
- [32].Guo DH, Shibuya R, Akiba C, Saji S, Kondo T, Nakamura J, Science 2016, 351, 361. [DOI] [PubMed] [Google Scholar]
- [33].Wang SH, Shang L, Li LL, Yu YJ, Chi CW, Wang K, Zhang J, Shi R, Shen HY, Waterhouse GIN, Liu SJ, Tian J, Zhang TR, Liu HY, Adv. Mater 2016, 28, 8379. [DOI] [PubMed] [Google Scholar]
- [34].a) Ju EG, Dong K, Chen ZW, Liu Z, Liu CQ, Huang YY, Wang ZZ, Pu F, Ren JS, Qu XG, Angew. Chem. Int. Ed 2016, 55, 11467; [DOI] [PubMed] [Google Scholar]; b) Zhang YX, Aslan K, Previte MJR, Geddes CD, J. Fluoresc 2007, 17, 345; [DOI] [PubMed] [Google Scholar]; c) Wu WT, Zhan LY, Fan WY, Song JZ, Li XM, Li ZT, Wang RQ, Zhang JQ, Zheng JT, Wu MB, Zeng HB, Angew. Chem. Int. Ed 2015, 54, 6540. [DOI] [PubMed] [Google Scholar]
Associated Data
This section collects any data citations, data availability statements, or supplementary materials included in this article.