

Abstract
The posterior parietal cortex (PPC) features close anatomical and functional relationships with the prefrontal cortex. However, the necessity of the PPC in executive functions has been questioned. The present study used the stop-signal task to examine response inhibition, an executive function that inhibits prepotent response tendency. The brain activity and resting-state functional connectivity were measured to analyze a parcellation-based network that was aimed at identifying a candidate PPC region essential for response inhibition in humans. The intraparietal sulcus (IPS) was activated during response inhibition and connected with the inferior frontal cortex and the presupplementary motor area, the two frontal regions known to be necessary for response inhibition. Next, transcranial magnetic stimulation (TMS) was used to test the essential role of the IPS region for response inhibition. TMS over the IPS region prolonged the stop-signal reaction time (SSRT), the standard behavioral index used to evaluate stopping performance, when stimulation was applied 30–0 ms before stopping. On the contrary, stimulation over the temporoparietal junction region, an area activated during response inhibition but lacking connectivity with the two frontal regions, did not show changes in SSRT. These results indicate that the IPS identified using the parcellation-based network plays an essential role in executive functions.
SIGNIFICANCE STATEMENT Based on the previous neuropsychological studies reporting no impairment in executive functions after lesions in the posterior parietal cortex (PPC), the necessity of PPC in executive functions has been questioned. Here, contrary to the long-lasting view, by using recently developed analysis in functional MRI (“parcellation-based network analysis”), we identified the intraparietal sulcus (IPS) region in the PPC as essential for response inhibition: one executive function to stop actions that are inaccurate in a given context. The necessity of IPS for response inhibition was further tested by an interventional technique of transcranial magnetic stimulation. Stimulation to the IPS disrupted the performance of stopping. Our findings suggest that the IPS plays essential roles in executive functions.
Keywords: cortical parcellation, executive function, posterior parietal cortex, response inhibition, transcranial magnetic stimulation
Introduction
The posterior parietal cortex (PPC) has been implicated in perceptual and cognitive functions such as spatial attention, sensorimotor transformation, memory retrieval, and perceptual decision-making (Kastner and Ungerleider, 2000; Corbetta and Shulman, 2002; Wagner et al., 2005; Rushworth and Taylor, 2006; Gold and Shadlen, 2007; Andersen and Cui, 2009; Bisley and Goldberg, 2010). Anatomical studies found that the PPC has reciprocal projections with the prefrontal cortex (PFC), suggesting a close relationship between the PPC and PFC (Cavada and Goldman-Rakic, 1989). Recent studies using resting-state functional connectivity (Fox and Raichle, 2007) further revealed a frontoparietal network that consists of robust connectivity between the PPC and PFC (Vincent et al., 2008). It is well established that the PFC plays a critical role in executive functions such as cognitive set shifting and response inhibition (Milner, 1964; Mishkin, 1964; Robbins, 1996). Taken together, such research indicates that the PPC may play an essential role in executive functions. Indeed, numerous neuroimaging studies reported robust PPC activation during executive functions (Cools et al., 2002; Whelan et al., 2012). Previous neuropsychological studies, however, reported negative results regarding involvement of the PPC in executive functions (Milner, 1963; Drewe, 1975; Stuss et al., 2000). Thus, the necessity of the PPC in executive functions has been questioned.
Prior research used resting-state functional connectivity to uncover macroscopic networks at the whole-brain level that implement various cognitive functions (Crossley et al., 2013; Sporns, 2014; Margulies et al., 2016; Braga and Buckner, 2017). Recent advances in resting-state functional connectivity analyses have parcellated the cerebral cortex into functional areas (Biswal et al., 2010; Mars et al., 2012; Hirose et al., 2013; Wig et al., 2014a; Eickhoff et al., 2015, 2016; Finn et al., 2015; Poldrack et al., 2015; Glasser et al., 2016) that can be further used to reconstruct networks for cognitive functions (Laumann et al., 2015; Glasser et al., 2016; Gordon et al., 2017). Moreover, the PPC was parcellated into six functional submodules, one of which was connected with the dorsolateral PFC (dlPFC) (Nelson et al., 2010). We hypothesized that a parcellation-based network could be used to localize a candidate PPC region essential for executive functions, with essential PFC regions as seed regions. Reconstructing networks using parcellated areas can be more useful than that using brain activation, because activation can overlap with adjacent parcellated areas, especially on a low-probability boundary (Hirose et al., 2013), which may result in the use of more heterogeneous regions to reconstruct networks.
In the present study, response inhibition (Aron et al., 2004; Xu et al., 2017), one representative executive function, was investigated using a stop-signal task. Performance of the task is evaluated by stop-signal reaction time (SSRT), but not by accuracy, because the task is designed to maintain the same level of accuracy by changing task difficulty. Prolonged SSRT has been reported following lesions to the inferior frontal cortex (IFC) and presupplementary motor area (preSMA) (Aron et al., 2003; Floden and Stuss, 2006; Nachev et al., 2007) or following interference via transcranial magnetic stimulation (TMS) (Chambers et al., 2006; Verbruggen et al., 2010; Cai et al., 2012a; Watanabe et al., 2015), indicating that the IFC and preSMA are essential to response inhibition. While a number of regions, including the anterior cingulate and insula, have been implicated in response inhibition by neuroimaging studies (Li et al., 2006; Aron et al., 2007; Jahfari et al., 2011; Cai et al., 2014; Erika-Florence et al., 2014), the IFC and preSMA are the only regions confirmed to be essential. Therefore, the candidate essential area in the PPC was identified using the following criteria: the area is activated during response inhibition and connected with the IFC and preSMA (Fig. 1A, Step 1). We then tested the essentiality of the identified PPC area by delivering transient stimulation to the PPC area during the task using TMS, which is capable of identifying the critical timing of neural processing (Desrochers et al., 2015; Rose et al., 2016) (Fig. 1A, Step 2).
Figure 1.

An overview of the experimental design of the present study and the two datasets. A, The essential area in the PPC was identified using a parcellation-based network (Step 1). To test the essential role of the identified PPC region, TMS was applied to the region during performance of the stop-signal task (Step 2). B, A target PPC region was first identified in 14 subjects (Dataset 1-fMRI). The essentiality of PPC regions was then tested in 12 subjects (Dataset 1-TMS). The TMS results were confirmed in 10 new subjects (Dataset 2-TMS).
Materials and Methods
Subjects.
Fourteen right-handed subjects (7 men and 7 women; mean ± SD age, 28.1 ± 9.9 years; age range, 20–47 years) participated in the fMRI and TMS experiments. Ten new subjects (5 men and 5 women; mean ± SD age, 21.4 ± 0.7 years; age range, 20–22 years) were further recruited to replicate TMS results. Written informed consent was obtained from all of the subjects according to the Declaration of Helsinki. The experimental procedures were approved by the Institutional Review Board of Juntendo University School of Medicine. Data and materials are available at Dryad; https://datadryad.org/resource/doi:10.5061/dryad.fk01r01, except for raw image data because sharing raw image data was not included in the informed consent.
Experimental design.
The present study consisted of the following two steps (Fig. 1A): using a parcellation-based network to generate a candidate PPC region essential for response inhibition (Step 1) and testing the candidate region using TMS (Step 2). In Step 1, functional magnetic resonance imaging (fMRI) scans were conducted during the performance of a stop-signal task and during a resting state in the 14 subjects (Dataset 1-fMRI) (Fig. 1B). The candidate PPC region was successfully identified in the intraparietal sulcus (IPS) region in 12 of the 14 subjects. In Step 2, the PPC regions were stimulated during the performance of the stop-signal task outside the MRI scanner. To discern the critical timing of stimulation within the SSRT, six time windows of 30 ms were investigated for the IPS region in the 12 subjects (Dataset 1-TMS). To confirm the reproducibility of the TMS results, 10 new subjects were further recruited (Dataset 2-TMS). No subjects overlapped in the two datasets. As a control, the temporoparietal junction (TPJ) region was investigated in 22 subjects.
MRI procedures.
Image data were acquired using a 3-T MRI scanner and a 64-channel RF head coil (Prisma, Siemens). T1-weighted structural images were obtained for anatomical reference (resolution, 0.8 × 0.8 × 0.8 mm3). Functional images were obtained using multiband gradient-echo echoplanar sequences (Feinberg et al., 2010) (TR, 1.0 s; TE, 30 ms; flip angle, 62°; FOV, 192 × 192 mm2; matrix size, 96 × 96; 78 contiguous slices; voxel size, 2.0 × 2.0 × 2.0 mm3; multiband factor, 6; phase encode direction, posterior to anterior). In the task scan, one run consisted of 330 volumes, and 10 runs were administered. In the resting-state scan, one run consisted of 360 volumes, and 10 runs were administered. Before each run, one functional image was acquired with the opposite phase-encode direction for subsequent topup distortion correction (Andersson et al., 2003).
Behavioral procedures.
Subjects performed a stop-signal task (Logan and Cowan, 1984; Aron et al., 2003; Jimura et al., 2014; Yamasaki et al., 2018) inside the scanner (Fig. 2A). The task comprised Go trials and Stop trials. At the beginning of a trial, a circle was presented for 500 ms at the center of the screen as a warning. In Go trials, a left- or right-pointing arrow (Go signal) was presented inside the circle, and the subjects were instructed to press a button indicating the corresponding direction with their right thumb. In Stop trials, after a stop-signal delay (SSD), the arrow was changed to an up-pointing arrow, and the subjects were required to withhold a manual response. The SSD was updated with each Stop trial based on a tracking procedure with increments or decrements of 50 ms for fMRI scans, allowing us to maintain the accuracy of Stop trials at ∼50% (Band et al., 2003). For TMS experiments that required a finer time resolution, the SSD was updated with increments or decrements of 25 ms. The intertrial interval varied from 0.5 to 4 s (mean, 1 s) for fMRI scans and from 2.5 to 3.5 s (mean, 3 s) for TMS experiments. To evaluate the efficiency of the response inhibition, this study estimated the SSRT as a behavioral index for efficient response inhibition for each subject based on an integration method (Logan and Cowan, 1984; Verbruggen et al., 2013). Subjects with shorter SSRTs can be considered to be more efficient at response inhibition (Logan and Cowan, 1984). Before test runs, two practice runs were performed in each daily session. One run contained 96 Go trials and 32 Stop trials for fMRI scans. For later TMS experiments, one run contained 80 Go trials (40 Stim and 40 No-stim trials) and 40 Stop (20 Stim and 20 No-stim trials) trials. Separate staircases for SSDs were used to track subjects' behavior in the Stim and No-stim trials.
Figure 2.

The stop-signal task and its activated areas. A, The stop-signal task. In Go trials, subjects were instructed to make the left or right button press, as indicated by the arrow. In Stop trials, the left/right arrow was changed to an up-pointing arrow, and the subjects were required to withhold their manual response. RT, Reaction time. B, Group-level voxelwise statistical maps of brain activation during response inhibition (Stop success vs Go success) in transverse slices. The color scale reflects statistical significance as indicated by the color bar on the right. The “Z” below the statistical maps indicates the z-coordinate in MNI space. L, Left; R, right. C, The same maps shown in coronal slices. The “Y” below the statistical maps indicates the y-coordinate in MNI space. D, The same maps shown in an inflated surface. E, ROI analyses of correlation between SSRT and brain activity during response inhibition. *p < 0.05. F, Scatter plot of correlation between SSRT and brain activity during response inhibition in the IFC. One dot represents data from one subject.
Image and statistical analysis.
For the task data, functional images were preprocessed using SPM8 (www.fil.ion.ucl.ac.uk/spm). The images were corrected for slice timing (reference, bottom slice), realigned to the first volume, and topup distortion corrected (Andersson et al., 2003). For topup distortion correction, the susceptibility-induced off-resonance field was estimated using the images with distortions oriented in opposite directions by using FSL (fsl.fmrib.ox.ac.uk/fsl/fslwiki). Events of interest (Go success and Stop success), together with nuisance events (Go fail and Stop fail), were coded at the onset of the Go signal of each trial, and were modeled as transient events convolved with canonical hemodynamic response function in a general linear model (GLM) implemented in SPM8. Six parameters of head motion derived from realignment were also included in the model as covariates of no interest. Time series were high-pass filtered (cutoff, 64 s). A single-level analysis was performed to estimate signal magnitudes, and the magnitude images were contrasted between Stop success and Go success trials.
For the resting-state data, functional images were corrected for slice timing, realigned, and topup distortion corrected in a similar manner as the task data. Temporal filters (0.009 Hz < f < 0.08 Hz) were applied to the images using in-house-written Matlab scripts. A GLM implemented in SPM8 was used to regress out nuisance signals that correlated with head motion, whole-brain global signal, averaged ventricular signal and averaged white matter signal. We evaluated the amount of head motion by using framewise displacement (FD) (Power et al., 2012), a measurement of instantaneous head motion that can be calculated as a locational difference between two successive volumes (Laumann et al., 2015; Gordon et al., 2017). Frames with FD > 0.25 mm were censored, as well as uncensored segments of data lasting less than five contiguous volumes; all such data were excluded from the subsequent parcellation analysis. The included images were 76.7 ± 27.9% (mean ± SD) of the total acquired images, and the resultant FD was 0.124 ± 0.015 mm (mean ± SD).
The parcellation analyses based on boundary mapping (Margulies et al., 2007; Cohen et al., 2008; Biswal et al., 2010; Hirose et al., 2012, 2013, 2016; Zhang and Li, 2012; Zhang et al., 2012; Wig et al., 2014b; Laumann et al., 2015; Poldrack et al., 2015; Glasser et al., 2016; Gordon et al., 2016, 2017; Osada et al., 2017; Ogawa et al., 2018) were applied to the cerebral cortical surface using the preprocessed resting-state data. A fiducial surface image was generated from the middle of the gray matter identified within a functional image for each subject using Caret software (brainvis.wustl.edu/wiki/index.php/Caret:About). Each vertex in the fiducial surface in the cerebral cortex of each subject was used as a seed to calculate its correlations with all the vertices. Similarity of the spatial patterns of the correlation maps was then evaluated using correlation coefficients, and similarity maps were generated. Spatial gradients of the similarity maps were computed for each seed vertex. A two-dimensional watershed algorithm was applied to the gradient maps, and the binary watershed maps were averaged across seed vertices after spatial smoothing (FWHM, 6 mm) to generate a boundary probability map. The watershed algorithm was again applied to the boundary probability map to delineate parcellated regions for each subject. The vertex with minimal boundary probability in the parcellated region was defined as its center.
The activated parcels were selected on the basis of brain activation during response inhibition of the whole of the parcellated regions calculated above from the vertex-wise functional connectivity. The activated parcels were then used to reconstruct a functional network for response inhibition on the basis of parcel-wise functional connectivity. The regions of interest (ROIs) were defined as the voxels in the parcellated areas within a 5 mm radius around the centers to calculate both the task activation and the functional connectivity at the level of the parcellated regions. The GLM implemented in SPM8 was used, and the contrast of Stop-success versus Go-success was calculated in each ROI for task activation. The time-series data of the preprocessed resting-state data were averaged in the ROIs, and the temporal correlations among the regions were calculated as functional connectivity. The IFC and the preSMA regions were defined for each subject as the regions that featured the maximal statistical significance of task activation and significant connectivity with each other (Aron et al., 2007; Neubert et al., 2010). The target region in the PPC was identified using the following criteria: (1) the region was activated during response inhibition (t > 2.0); (2) the region was functionally connected with the IFC (z > 3.0); and (3) the region was functionally connected with the preSMA (z > 3.0). A probability map of the location of positive centers in each of the 12 subjects was calculated, and the map showed that such PPC regions existed most consistently around the IPS. To assure that the target region was selected from the IPS, the region nearest to the peak of the group-level activation in the IPS was identified when multiple positive regions existed in the PPC. Since the selected IPS region in each subject did not always exist at the group-level activation peak, the individual-level analysis identified the target IPS region more precisely than the group-level analysis. The group-level significance of brain activation was estimated in a one-sample t test, treating subjects as a random effect, after spatially normalized to a standard MNI template with interpolation to a 2 × 2 × 2 mm space using DARTEL (Ashburner, 2007), followed by spatial smoothing with a 6 mm kernel. As a control region in the PPC, the TPJ region was identified for each subject that was nearest to the peak of the group-level activation. The centers of the selected parcellated regions in the IPS and the TPJ for each subject were later stimulated by TMS to test its necessity in response inhibition.
TMS procedures.
TMS was administered to examine the impact of brain stimulation (Pascual-Leone et al., 2000; Volman et al., 2011; Lee and D'Esposito, 2012; Rossini et al., 2015; Miyashita, 2016; Rahnev et al., 2016) over the PPC regions on behavioral performance. Using a hand-held figure-of-eight coil (7 cm diameter; Magstim), single-pulse TMS experiments were conducted to determine the resting motor threshold (RMT) for the right first dorsal interosseous (FDI) muscle. Motor-evoked potentials were recorded from the right FDI muscle using Ag/AgCl sheet electrodes placed over the muscle belly (active) and the metacarpophalangeal joint of the index finger (reference). The signals were sent to an amplifier through filters set at 150 Hz to 3 kHz. The RMT was defined as the lowest intensity that evoked a small response (>50 μV) in >5 of 10 consecutive trials when the subjects relaxed (Hanajima et al., 2001; Watanabe et al., 2014, 2015). The stimulation intensity to the PPC regions was set at 120% RMT, with correction based on the coil–cortex distance (Stokes et al., 2005; Cai et al., 2012b). For some subjects, the stimulation intensity was further adjusted to accommodate comfort. The mean (±SD) stimulation intensity was 57.0% (±4.5%) of maximum stimulator output.
An on-line navigator assured that stimulation was targeted to the IPS or the TPJ regions. T1-weighted images were registered to subjects' heads in space using a tracking device and navigator software (TMS Navigator-SW, Localite). The position and orientation of the coil were also registered to the subjects' heads in space, and were monitored and recorded in real time. In Dataset 1-TMS, the stimulation targets were determined for each individual subject as the centers of the identified IPS and TPJ regions nearest to the group brain activation peaks. In Dataset 2-TMS, due to the small individual difference in the location of the target regions in Dataset 1-TMS relative to the spatial resolution of TMS (see Results), the stimulation targets were determined as the group brain activation peaks themselves, commonly in the new subjects.
Single-pulse stimulation was delivered to the PPC regions in one-half of Go and Stop trials (Stim trials), with No-stim trials intermixed within a run that contained 80 Go trials and 40 Stop trials. The order of Stim and No-stim trials were counterbalanced within runs such that Stim/No-stim trials were followed by Stim and No-stim trials with almost equal probability. To explore the critical timing of stimulation within the SSRT, each of six time windows of 30 ms (−180 to −150 ms; −150 to −120 ms; −120 to −90 ms; −90 to −60 ms; −60 to −30 ms; and −30 to 0 ms, when the end of the SSRT for No-stim trials is defined as zero) was investigated for the IPS region in each run. The SSRT was calculated every run for both Stim and No-stim trials, and the stimulation timing was pseudorandomly updated every run based on the SSRT in No-stim trials of the last run (for the first test run, the SSRT in the last practice run was referred). Which time window was covered by each run was therefore determined only after the run was completed. Because of this, the order of stimulated time windows, which was counterbalanced across subjects, cannot be completely as planned. Runs were excluded from analysis when stimulation occurred outside the six time windows due to fluctuations of the SSRT. Runs were also excluded from analyses when runs did not satisfy the assumption of the race model (Go reaction time > Stop failure reaction time). TMS sessions were limited to five runs per day, and the sessions continued until one run was collected for each of the six time windows. As a control, the six time windows were investigated for the TPJ region, and one run was collected for each of the six time windows.
Results
Identification of a candidate essential PPC area using parcellation-based network
In Step 1, fMRI was administered to the subjects during the performance of a stop-signal task (Fig. 2A) and during a resting state. In the task, the subjects made few errors in Go trials, and the mean ± SD SSRT was 205.0 ± 27.7 ms on average (Table 1). Voxelwise brain activation during response inhibition (Stop success − Go success) at the group level is shown in transverse slices (Fig. 2B) and coronal slices (Fig. 2C), as well as in the inflated brain (Fig. 2D). Brain activation was observed in the IFC, the preSMA, the IPS, and the TPJ in the right hemisphere. The correlation of the brain activation with the SSRT was significant in the IFC (r = −0.61, p = 0.02), as reported previously (Aron et al., 2007; Yamasaki et al., 2018), but not in the preSMA (r = −0.14, p = 0.63), IPS (r = 0.01, p = 0.96), or TPJ (r = −0.12, p = 0.68) (Fig. 2E,F).
Table 1.
Behavioral data under fMRI scanning (Dataset 1-fMRI)
| Reaction time [Go] (ms) | 456.3 ± 51.6 |
| SSD (ms) | 241.3 ± 59.1 |
| SSRT (ms) | 205.0 ± 27.7 |
| Correct response rate [Go] (%) | 98.6 ± 2.2 |
| Correct response rate [Stop] (%) | 49.7 ± 1.0 |
| Reaction time [Stop failure] (ms) | 422.9 ± 50.4 |
Behavioral data for the stop-signal task under fMRI scanning (mean ± SD).
The resting-state data were used for areal parcellation for each subject (Fig. 3A). There were 1291.1 ± 120.0 (mean ± SD) regions delineated in the whole cerebral cortex. The brain activation during response inhibition was calculated further for each parcellated area (Fig. 3B). The activation observed at the group level was consistently observed at the single-subject level (Table 2) due to an enhanced signal-to-noise ratio in the parcellation-based analysis. The average MNI coordinates of the centers in the IFC and preSMA regions were (49, 11, 26) and (9, 14, 59), respectively. The IFC appears close to the precentral gyrus, and lies between the inferior frontal gyrus and the inferior frontal junction, and it is suitable to label the region as the inferior frontal “cortex.” The resting-state functional connectivity was also calculated for each parcellated area when the seed regions were placed in the IFC and the preSMA regions. Multiple regions in the PPC were connected with the IFC and the preSMA (Fig. 3C, Fig. 3-1).
Figure 3.
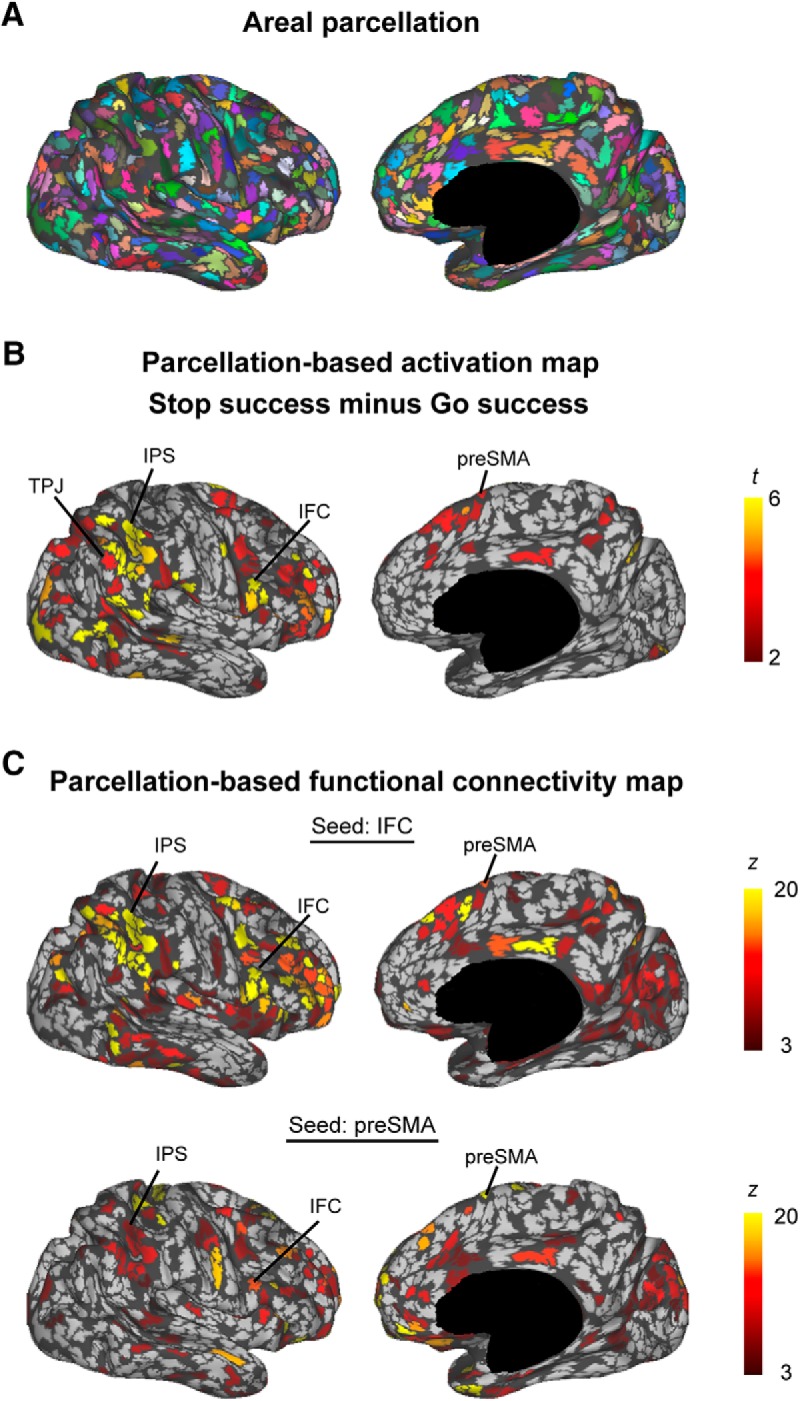
Brain activity and connectivity in parcellated areas. A, Parcellated areas in one representative subject shown in an inflated surface. Different colors indicate different parcellated areas. B, Brain activation during response inhibition. The statistical significance was calculated for each parcellated area. The color scale reflects statistical significance. C, Resting-state functional connectivity with the IFC (top) and the preSMA (bottom) for each parcellated area. The color scale indicates the Gaussian z score. See also Figure 3-1.
Table 2.
Parcellation-based activations and functional connectivities for each subject (Dataset 1-fMRI)
| Subjects | IFC |
preSMA |
IPS |
IFC-preSMA | IFC-IPS | preSMA-IPS | |||||||||
|---|---|---|---|---|---|---|---|---|---|---|---|---|---|---|---|
| x | y | z | t | x | y | z | t | x | y | z | t | z | z | z | |
| s01 | 54 | 16 | 22 | 6.8 | 6 | 12 | 68 | 3.8 | 44 | −40 | 52 | 9.0 | 14.2 | 30.2 | 5.9 |
| s02 | 50 | 8 | 34 | 5.1 | 4 | 18 | 58 | 3.2 | 46 | −42 | 48 | 3.7 | 54.0 | 51.6 | 37.8 |
| s03 | 46 | 0 | 32 | 4.4 | 12 | 16 | 66 | 3.6 | 16.3 | ||||||
| s04 | 32 | 8 | 44 | 3.2 | 14 | 12 | 58 | 2.5 | 42 | −40 | 46 | 2.3 | 12.4 | 24.9 | 3.2 |
| s05 | 50 | 12 | 30 | 2.7 | 6 | 10 | 56 | 9.4 | 46 | −42 | 56 | 2.6 | 25.4 | 32.9 | 26.0 |
| s06 | 42 | 8 | 44 | 2.2 | 16 | 10 | 60 | 3.0 | 44 | −58 | 52 | 3.1 | 20.1 | 11.9 | 30.6 |
| s07 | 50 | 14 | 34 | 2.8 | 16 | 16 | 60 | 4.1 | 40 | −50 | 46 | 3.3 | 12.2 | 12.4 | 13.4 |
| s08 | 44 | 14 | 36 | 2.2 | 8 | 14 | 54 | 2.1 | 34 | −64 | 54 | 4.6 | 4.2 | 13.5 | 3.2 |
| s09 | 56 | 16 | 18 | 2.6 | 16 | 14 | 66 | 2.1 | 42 | −58 | 54 | 3.6 | 5.8 | 7.4 | 3.1 |
| s10 | 54 | 16 | 22 | 2.1 | 6 | 12 | 62 | 2.2 | 40 | −50 | 54 | 2.1 | 9.7 | 4.8 | 10.4 |
| s11 | 56 | 12 | 10 | 2.9 | 8 | 16 | 62 | 2.6 | 16.6 | ||||||
| s12 | 42 | 14 | 16 | 5.0 | 4 | 18 | 60 | 4.6 | 42 | −42 | 50 | 2.6 | 18.2 | 16.7 | 20.6 |
| s13 | 54 | 6 | 16 | 4.3 | 6 | 22 | 46 | 5.5 | 34 | −42 | 48 | 5.2 | 5.8 | 35.9 | 18.3 |
| s14 | 54 | 6 | 8 | 2.9 | 4 | 10 | 50 | 6.5 | 44 | −40 | 52 | 4.0 | 17.6 | 11.0 | 12.9 |
Parcellation-based activations of the IFC, preSMA, and IPS regions and functional connectivities for each subject are listed. The coordinates of the center for each activated region are shown in MNI space.
Brain connectivity in parcellated areas. Resting-state functional connectivity with the IFC (top) and the preSMA (bottom) for each parcellated area in the same subject in Fig. 3. The subthreshold functional connectivities are also displayed. The color scale indicates gaussian z score. Download Figure 3-1, TIF file (2.2MB, tif)
To identify, among these PPC regions, the one region that may play an essential role in response inhibition, exploratory search was conducted to detect a region that is (1) activated during response inhibition, (2) connected with the IFC, and (3) connected with the preSMA. A conjunction map (Fig. 4A) was generated for each subject from a combination of the activation and connectivity maps shown in Figure 3B and C. A region detected in the IPS consistently satisfied the criteria in 12 of the 14 subjects examined. The probability of the locations of the 12 detected regions is presented in Figure 4B, and these regions were located within 20 mm of the group-level activation peak (Fig. 4C). As the control that lacks the connectivity with the two PFC regions, the TPJ region was additionally identified to be activated but not connected with the IFC or the preSMA. Figure 4D and E show the magnitude of activation in the IPS and TPJ, and the connectivity between the IPS/TPJ and the IFC/preSMA, respectively. The connectivity of the IPS with the IFC and the preSMA was significant (IFC, t(11) = 5.2, p = 3.0 × 10⁻⁴; preSMA, t(11) = 4.7, p = 7.0 × 10⁻⁴, t test), while that with the TPJ was not (IFC, t(11) = 1.4, p = 0.20; preSMA, t(11) = 1.3, p = 0.21, t test). Comparison of the identified IPS region to the PPC submodules previously reported in the study by Nelson et al. (2010) revealed that the IPS region (mean MNI coordinates: 42, −47, 51) corresponded to the right IPS (RIPS)/dlPFC submodule (Fig. 4F).
Figure 4.

IPS region in the response inhibition network. A, Parcellated areas that were conjunctively positive in brain activation (Fig. 3B), connectivity with the IFC (Fig. 3C, top), and connectivity with the preSMA (Fig. 3C, bottom). RSFC, Resting-state functional connectivity. B, A group-level probability map of locations of positive regions that were activated during response inhibition and connected with the IFC and preSMA. C, A map of target IPS regions in 12 individual subjects. There are therefore 12 points in the map, but some of them are overlapped. D, The magnitude of brain activation during response inhibition in the IPS and TPJ. Error bars indicate the SEMs of subjects. ***p < 0.005, t test. E, The connectivity between the IPS/TPJ and the IFC/preSMA. F, The PPC modules (left) and submodules (right) reported in the study by Nelson et al. (2010) are shown. Spheres in the brain surface represent ROIs in the study by Nelson et al. (2010). Different colors in the spheres indicate different modules/submodules. A red cross represents the center of the group probabilistic map in B. The identified IPS region in the present study corresponded to the IPS module, and also to the RIPS/dlPFC submodule. SPL, superior parietal lobule; SMG, supramarginal gyrus; FEF, frontal eye field; sFG, superior frontal gyrus; a, anterior, p, posterior; m, medial.
To test other types of connectivity than the resting-state functional connectivity for reconstructing a parcellation-based network, psychophysiological interaction (PPI) was calculated. When the seed was placed in the IFC and preSMA regions, significant PPI (Stop success > Go) with significant brain activation was observed around the IPS in 1 and 2 subjects, respectively, of the 14 subjects. No subjects had a significant IPS region when the two PPIs were combined. Thus, the PPI was naturally less sensitive than the functional connectivity to the single-subject analysis of the present study.
Interventional testing of necessity for response inhibition using TMS
In Step 2, single-pulse TMS was targeted to the center of the identified regions in each subject during the performance of the stop-signal task. The regions were stimulated in a half of the Go and Stop trials, and trials that featured stimulation (Stim) and those that did not (No-stim) were intermixed within runs (Fig. 5). In Dataset 1-TMS, we tested the IPS and TPJ regions in each of the six time windows in the 12 subjects. In Dataset 2-TMS, we further confirmed the essentiality in new 10 subjects (Fig. 1B). The results of the IPS region in Dataset 1-TMS indicate that response inhibition behavior was impaired; Stim trials featured a prolonged SSRT relative to No-stim trials at the time window of −30 to 0 ms (mean difference, 26.3 ms; t(11) = 6.7; p = 3.4 × 10⁻⁵; p = 2.0 × 10⁻⁴ after sixfold Bonferroni correction for multiple comparisons, paired t test) but not at the other time windows (from early to late: t(11) = 0.2, p = 0.83; t(11) = −0.5, p = 0.60; t(11) = 1.0, p = 0.36; t(11) = −1.1, p = 0.28; t(11) = −1.1, p = 0.31, paired t test) (Fig. 6A). In the TPJ region, no significant changes were observed in any of the six time windows (from early to late: t(11) = −0.5, p = 0.60; t(11) = 0.2, p = 0.83; t(11) = 1.8, p = 0.10; t(11) = 0.0, p = 1.0; t(11) = −1.5, p = 0.16; t(11) = 0.4, p = 0.73, paired t test; Fig. 6B). No significant changes were observed in the Go reaction time (from early to late: t(11) = −0.9, p = 0.38; t(11) = −0.2, p = 0.88; t(11) = 1.8, p = 0.09; t(11) = −0.7, p = 0.51; t(11) = −0.2, p = 0.88; t(11) = 1.1, p = 0.30, paired t test), the Go correct response rate (from early to late: t(11) = 1.6, p = 0.14; t(11) = −0.7, p = 0.50; t(11) = 0.3, p = 0.78; t(11) = −1.0, p = 0.34; t(11) = −1.1, p = 0.32; t(11) = 0.7, p = 0.50, paired t test), or the Stop response rate (from early to late: t(11) = −0.5, p = 0.62; t(11) = 1.8, p = 0.10; t(11) = −0.9, p = 0.41; t(11) = 0.2, p = 0.86; t(11) = 0.4, p = 0.73; t(11) = 0.0, p = 1.0, paired t test) in the IPS, or in the Go reaction time (from early to late: t(11) = −0.2, p = 0.84; t(11) = −0.1, p = 0.93; t(11) = 0.2, p = 0.88; t(11) = 0.8, p = 0.43; t(11) = 0.6, p = 0.59; t(11) = 0.3, p = 0.79, paired t test), the Go correct response rate (from early to late: t(11) = 0.5, p = 0.64; t(11) = 0.0, p = 1.0; t(11) = −0.9, p = 0.39; t(11) = −0.6, p = 0.57; t(11) = −2.1, p = 0.06; t(11) = 0.0, p = 1.0, paired t test), or the Stop response rate (from early to late: t(11) = −1.2, p = 0.26; t(11) = 1.6, p = 0.14; t(11) = −1.0, p = 0.32; t(11) = 0.6, p = 0.59; t(11) = −0.2, p = 0.83; t(11) = 0.7, p = 0.50, paired t test) in the TPJ region (Fig. 6C,D).
Figure 5.

Task design for Step 2. TMS applied to one-half of Go and Stop trials. The timing of TMS in Stim trials was calculated from the SSRT in No-stim trials.
Figure 6.

TMS effects on IPS and TPJ in Dataset 1-TMS. A, SSRT in Stim and No-stim trials when TMS was targeted to the IPS at each time window in Dataset 1-TMS. Gray lines indicate data from each subject. ***p < 0.005, paired t test. B, SSRT in Stim and No-stim trials when TMS was targeted to the TPJ at each time window. C, Go reaction time, Go correct response rate, and Stop correct response rate in Stim and No-stim trials when TMS was targeted to the IPS at each time window. D, Go reaction time, Go correct response rate, and Stop correct response rate in Stim and No-stim trials when TMS was targeted to the TPJ at each time window.
In Dataset 2-TMS, a prolonged SSRT was reproducibly observed in the IPS region at the time window of −30 to 0 ms (mean difference, 23.8 ms; t(9) = 6.3; p = 1.4 × 10⁻⁴; p = 8.6 × 10⁻⁴ after sixfold Bonferroni correction for multiple comparisons, paired t test), but not at the other time windows (from early to late: t(9) = 0.4, p = 0.73; t(9) = 0.7, p = 0.53; t(9) = −1.2, p = 0.27; t(9) = −0.5, p = 0.65; t(9) = 1.4, p = 0.19, paired t test) (Fig. 7A). In the TPJ region, no significant changes were observed in any of the six time windows (from early to late: t(9) = 0.5, p = 0.62; t(9) = 0.7, p = 0.51; t(9) = 0.5, p = 0.63; t(9) = 1.2, p = 0.25; t(9) = 0.7, p = 0.51; t(9) = 0.2, p = 0.88, paired t test; Fig. 7B). No significant changes were observed in the Go reaction time (from early to late: t(9) = −1.1, p = 0.29; t(9) = −2.2, p = 0.06; t(9) = −1.1, p = 0.32; t(9) = −1.7, p = 0.12; t(9) = 0.0, p = 0.97; t(9) = 1.8, p = 0.10, paired t test), the Go correct response rate (from early to late: t(9) = 0.3, p = 0.78; t(9) = 1.5, p = 0.17; t(9) = −0.8, p = 0.46; t(9) = −1.6, p = 0.14; t(9) = −1.0, p = 0.34; t(9) = −0.9, p = 0.39, paired t test), or the Stop response rate (from early to late: t(9) = −0.9, p = 0.41; t(9) = 0.4, p = 0.74; t(9) = 2.1, p = 0.07; t(9) = 0.3, p = 0.81; t(9) = −0.6, p = 0.59; t(9) = −1.9, p = 0.09, paired t test) in the IPS, or in the Go reaction time (from early to late: t(9) = 0.5, p = 0.61; t(9) = −2.2, p = 0.06; t(9) = 0.2, p = 0.87; t(9) = −0.4, p = 0.72; t(9) = 1.1, p = 0.31; t(9) = 2.2, p = 0.06, paired t test), the Go correct response rate (from early to late: t(9) = 0.3, p = 0.76; t(9) = 1.8, p = 0.10; t(9) = 0.3, p = 0.78; t(9) = 0.0, p = 1.0; t(9) = 1.0, p = 0.34; t(9) = −1.5, p = 0.17, paired t test), or the Stop response rate (from early to late: t(9) = 0.3, p = 0.76; t(9) = 0.2, p = 0.85; t(9) = −0.9, p = 0.40; t(9) = −0.5, p = 0.66; t(9) = 1.8, p = 0.11; t(9) = 0.6, p = 0.54, paired t test) in the TPJ region (Fig. 7C,D).
Figure 7.

Confirmatory test of TMS effects on IPS and TPJ in Dataset 2-TMS. A, SSRT in Stim and No-stim trials when TMS was targeted to the IPS at each time window in Dataset 2-TMS. Gray lines indicate data from each subject. ***p < 0.005, paired t test. B, SSRT in Stim and No-stim trials when TMS was targeted to the TPJ at each time window. C, Go reaction time, Go correct response rate, and Stop correct response rate in Stim and No-stim trials when TMS was targeted to the IPS at each time window. D, Go reaction time, Go correct response rate, and Stop correct response rate in Stim and No-stim trials when TMS was targeted to the TPJ at each time window. See also Figure 7-1, and Figure 7-2.
Test of independent race model assumptions for reaction time in the stop-signal task. (A) Reaction time for Go/Stop-failure trials in Stim and No-stim trials when TMS was targeted to the IPS (top) or TPJ (bottom) at each time window. Gray lines indicate data from each subject. ***p < 0.005, paired t-test. (B) Reaction time for Stop failure trials in Stop trials with longer/shorter SSDs when TMS was targeted to the IPS (top) or TPJ (bottom) at each time window. *p < 0.05, **p < 0.01, paired t-test. Download Figure 7-1, TIF file (3.6MB, tif)
Test of independent race model assumptions for individual inhibition functions. The normalized inhibition function plots the proportion of successfully stopped responses as a function of the relative finishing times (RFT) of the response and stop processes. Z-transformed RFT (ZRFT) was calculated as ZRFT = (RTgo – SSD – SSRT)/SD[RTgo]. Positive/negative ZRFT values indicate early/late stop signal onset. A cumulative Weibull function was fit to the group mean standardized inhibition function (solid line). Gray lines indicate data from each subject. Download Figure 7-2, TIF file (2.7MB, tif)
Due to similar results in the two datasets, the combined 22 subjects were examined. A prolonged SSRT was reproducibly observed in the IPS region at the time window of −30 to 0 ms (mean difference: 25.2 ms; t(21) = 9.3, p = 6.4 × 10⁻⁹; p = 3.8 × 10⁻⁸ after sixfold Bonferroni correction for multiple comparisons, paired t test), but not at the other time windows (from early to late: t(21) = 0.4, p = 0.68; t(21) = 0.0, p = 0.98; t(21) = 0.1, p = 0.95; t(21) = −1.1, p = 0.31; t(21) = −0.2, p = 0.89, paired t test). In the TPJ region, no significant changes were observed in any of the six time windows (from early to late: t(21) = −0.1, p = 0.94; t(21) = 0.6, p = 0.56; t(21) = 1.5, p = 0.14; t(21) = 0.7, p = 0.50; t(21) = −0.9, p = 0.36; t(21) = 0.4, p = 0.70, paired t test). No significant changes were observed in the Go reaction time (from early to late: t(21) = −1.5, p = 0.15; t(21) = −1.2, p = 0.25; t(21) = 0.3, p = 0.79; t(21) = −1.7, p = 0.11; t(21) = −0.1, p = 0.93; t(21) = 2.1, p = 0.06, paired t test), the Go correct response rate (from early to late: t(21) = 1.3, p = 0.21; t(21) = 0.0, p = 1.0; t(21) = −0.5, p = 0.63; t(21) = −1.9, p = 0.07; t(21) = −1.2, p = 0.23; t(21) = −0.2, p = 0.83, paired t test), or the Stop response rate (from early to late: t(21) = −1.0, p = 0.34; t(21) = 1.5, p = 0.16; t(21) = 0.2, p = 0.82; t(21) = 0.3, p = 0.77; t(21) = 0.0, p = 1.0; t(21) = −1.3, p = 0.22, paired t test) in the IPS, or in the Go reaction time (from early to late: t(21) = 0.1, p = 0.92; t(21) = −0.8, p = 0.44; t(21) = 0.2, p = 0.81; t(21) = 0.3, p = 0.77; t(21) = 1.1, p = 0.27; t(21) = 1.0, p = 0.35, paired t test), the Go correct response rate (from early to late: t(21) = 0.6, p = 0.56; t(21) = 1.3, p = 0.21; t(21) = −0.4, p = 0.68; t(21) = −0.5, p = 0.60; t(21) = −1.4, p = 0.18; t(21) = −0.9, p = 0.38, paired t test), or the Stop response rate (from early to late: t(21) = −0.5, p = 0.63; t(21) = 1.0, p = 0.32; t(21) = −1.4, p = 0.18; t(21) = 0.2, p = 0.81; t(21) = 0.5, p = 0.62; t(21) = 1.0, p = 0.35, paired t test) in the TPJ region. Three-way ANOVA was also conducted, with regions (IPS/TPJ), stimulation (Stim/No-stim), and time windows as factors. Significant interactions (stimulation × time windows, region × stimulation × time windows) were detected (F(5,105) = 2.8, p = 0.02; F(5,105) = 2.7, p = 0.02, respectively), with no significant main effect (region: F(1,105) = 1.5, p = 0.24; stimulation: F(1,105) = 3.0, p = 0.10; time windows: F(5,105) = 0.9, p = 0.46). Post hoc analyses indicated that the region-by-stimulation interaction at the critical time window was significant (F(1,126) = 11.1, p = 0.001).
The assumptions of the independent race model in the stop-signal task were verified in the following three ways: (1) the probability of responding given a stop signal increases as a function of stop-signal delay; (2) response times on signal–respond trials are shorter than on Go trials; and (3) response times on signal–respond trials increase as a function of the stop-signal delay (Zandbelt and Vink, 2010; Smittenaar et al., 2013; Bloemendaal et al., 2016). As shown in Fig. 7-1, and Fig. 7-2, the group behavioral results confirmed that the three assumptions were fulfilled in the six time windows in the IPS and TPJ in the Stim and No-stim trials. We tested whether there is a more significant TMS effect in the IPS at the time window of −30 to 0 ms on trials with early stop signals than those with late stop signals. As indicated in Fig. 7-2, the slope of the average stopping performance looks similar in the Stim and No-stim conditions, and the effect size (Stim vs No-stim) was not significantly different between early-half and late-half trials (t(21) = 0.3, p = 0.77, paired t test).
Discussion
The PPC is known to implement various perceptual and cognitive functions (Kastner and Ungerleider, 2000; Corbetta and Shulman, 2002; Wagner et al., 2005; Rushworth and Taylor, 2006; Gold and Shadlen, 2007; Andersen and Cui, 2009; Bisley and Goldberg, 2010). Although neuroimaging and electrophysiological studies have also reported activity of the PPC during executive functions (Garavan et al., 1999; Chikazoe et al., 2009; Whelan et al., 2012; Barch et al., 2013; Ester et al., 2015; Zhou et al., 2016), the PPC has rarely been highlighted as essential to response inhibition. By analyzing a parcellation-based network and tracking the connectivity back from the frontal regions necessary in response inhibition to the PPC, the present study identified the IPS as a region in the PPC essential to response inhibition. Stimulation over the IPS region disrupted performance in the stop-signal task, while stimulation over the TPJ, which was activated during response inhibition but was not connected to the frontal regions, did not. These results suggest that the PPC plays an essential role in executive functions, and that parcellation-based networks can be used to predict essential regions yet unknown.
The present study demonstrated the necessity of the PPC for response inhibition by identifying the specific IPS region based on a parcellation-based network. A previous TMS study of response inhibition (Chambers et al., 2006) used repetitive TMS to the angular gyrus (AG; MNI coordinates: 53, −60, 50) located in AG/mPFC submodule in Nelson et al. (2010), and reported negative TMS results. It is speculated that different results stem from different stimulation sites and different stimulation protocols. We also reported the negative results in the TPJ region using the on-line single-pulse stimulation. It seems important to track connectivity back from essential regions in extending the parcellation-based network (Buckner et al., 2009; Crossley et al., 2013; Sporns, 2014; Fornito et al., 2015). The TPJ may implement other cognitive processes that do not contribute to response inhibition. Further extension of the parcellation-based network that includes the IPS region may reveal as of yet unknown regions essential to response inhibition. It is to be noted, however, that further investigation is required to elucidate how generally the parcellation-based network can predict functionally related regions.
Previous studies have revealed 150–300 parcellated areas in the cerebral cortex at the group level, and the number increased to ∼600 at the single-subject level (Van Essen et al., 2012; Laumann et al., 2015; Glasser et al., 2016; Gordon et al., 2016, 2017). On the other hand, the present study generated ∼1200 areas in the whole cerebral cortex. It is to be noted that we applied the same parameters for boundary mapping, including the smoothing kernel size and watershed threshold, that were used in these previous studies. One important difference would be the greater number of vertices on the cortical surface that were implemented in Caret software. Interestingly, several parcellated areas were detected continuously in the IPS at a single-subject level (Fig. 4A). Moreover, the spatial extent of the detected IPS regions in the 12 subjects (Fig. 4C) is comparable to that in the RIPS/dlPFC submodule in the study by Nelson et al. (2010), where the PPC was parcellated into six submodules, and the dorsal–anterior cluster in the inferior parietal lobule (IPL; Zhang and Li, 2014). These observations suggest that several parcellated areas in the IPS tend to be activated cooperatively during various cognitive functions. At the same time, since boundary mapping detects differences in connectivity profiles of the parcellated areas, future studies may reveal functional areal organization within the submodules (Glasser et al., 2016). Although it attained finer spatial accuracy than was required in the present study, the parcellation-based analysis may be critical in other experimental designs.
Differential results were observed in the brain–behavior correlation during response inhibition in the IFC and IPS: significant correlation between the brain activity and the SSRT was detected in the IFC, but not in the IPS (Fig. 2E). The results indicate that there are regions that are not correlated with the SSRT but are essential for response inhibition. The differential results also suggest that the IFC plays a more central role in response inhibition. The more central role of the IFC is also consistent with the differential lesion effects in the IFC and IPS, as follows: performance is impaired by both temporary (Chambers et al., 2006; Verbruggen et al., 2010) and permanent (Aron et al., 2003) lesions to the IFC, while performance is impaired by transient (Figs. 6, 7), but not permanent (Drewe, 1975), lesions to the IPS. A recent study using the effective connectivity analysis suggested that during response inhibition, the IFC modulates an excitatory influence of the preSMA on the subthalamic nucleus (STN), thereby amplifying the downstream polysynaptic inhibition from the STN to the primary motor cortex (Rae et al., 2015). One possibility would be that the connection from the IPS to the STN (Temel et al., 2005; Lambert et al., 2012) is compensated by the connection from the preSMA to the STN (Duann et al., 2009; Lambert et al., 2012) when the IPS is permanently lesioned.
The critical time window for the TMS over the IPS was 0–30 ms before the end of the SSRT. The critical timing in the IPS near the end of the SSRT indicates that response inhibition is rapidly processed from the cerebral cortex, just before the withholding of a response. This interpretation further suggests that the IPS region may contribute to evidence accumulation during decision-making (Gold and Shadlen, 2007), which might be processed for stopping throughout the SSRT. This critical time window resembles those from electrophysiological recording and stimulation at the IFC in humans (Swann et al., 2009; Wessel et al., 2013). Electrophysiological data revealed increased beta power ∼0 to 50 ms before the end of the SSRT, and the electrical stimulation to the IFC at the time window caused prolonged SSRT. The similarity in time windows raises the possibility that processes in the IFC and IPS run parallel for response inhibition. An alternative possibility is that the IFC originates inhibitory processes that control downstream processes in the IPS (Morishima et al., 2009). Finer time resolution would be required to uncover the precise interaction between the IFC and the IPS. At the same time, a more complete network for response inhibition might be revealed by further extension of the parcellation-based network that includes the IPS.
Footnotes
The authors declare no competing financial interests.
This work was supported by Japan Society for the Promotion of Science KAKENHI Grants 16K18367 and 18K07348 to T.O., and 16K16076 to A.O.; and a grant from the Takeda Science Foundation to S.K. We thank T. Kamiya and H. Goto for technical assistance.
References
- Andersen RA, Cui H (2009) Intention, action planning, and decision making in parietal-frontal circuits. Neuron 63:568–583. 10.1016/j.neuron.2009.08.028 [DOI] [PubMed] [Google Scholar]
- Andersson JL, Skare S, Ashburner J (2003) How to correct susceptibility distortions in spin-echo echo-planar images: application to diffusion tensor imaging. Neuroimage 20:870–888. 10.1016/S1053-8119(03)00336-7 [DOI] [PubMed] [Google Scholar]
- Aron AR, Fletcher PC, Bullmore ET, Sahakian BJ, Robbins TW (2003) Stop-signal inhibition disrupted by damage to right inferior frontal gyrus in humans. Nat Neurosci 6:115–116. 10.1038/nn1003 [DOI] [PubMed] [Google Scholar]
- Aron AR, Robbins TW, Poldrack RA (2004) Inhibition and the right inferior frontal cortex. Trends Cogn Sci 8:170–177. 10.1016/j.tics.2004.02.010 [DOI] [PubMed] [Google Scholar]
- Aron AR, Behrens TE, Smith S, Frank MJ, Poldrack RA (2007) Triangulating a cognitive control network using diffusion-weighted magnetic resonance imaging (MRI) and functional MRI. J Neurosci 27:3743–3752. 10.1523/JNEUROSCI.0519-07.2007 [DOI] [PMC free article] [PubMed] [Google Scholar]
- Ashburner J. (2007) A fast diffeomorphic image registration algorithm. Neuroimage 38:95–113. 10.1016/j.neuroimage.2007.07.007 [DOI] [PubMed] [Google Scholar]
- Band GP, van der Molen MW, Logan GD (2003) Horse-race model simulations of the stop-signal procedure. Acta Psychol 112:105–142. 10.1016/S0001-6918(02)00079-3 [DOI] [PubMed] [Google Scholar]
- Barch DM, Burgess GC, Harms MP, Petersen SE, Schlaggar BL, Corbetta M, Glasser MF, Curtiss S, Dixit S, Feldt C, Nolan D, Bryant E, Hartley T, Footer O, Bjork JM, Poldrack R, Smith S, Johansen-Berg H, Snyder AZ, Van Essen DC (2013) Function in the human connectome: task-fMRI and individual differences in behavior. Neuroimage 80:169–189. 10.1016/j.neuroimage.2013.05.033 [DOI] [PMC free article] [PubMed] [Google Scholar]
- Bisley JW, Goldberg ME (2010) Attention, intention, and priority in the parietal lobe. Annu Rev Neurosci 33:1–21. 10.1146/annurev-neuro-060909-152823 [DOI] [PMC free article] [PubMed] [Google Scholar]
- Biswal BB, Mennes M, Zuo XN, Gohel S, Kelly C, Smith SM, Beckmann CF, Adelstein JS, Buckner RL, Colcombe S, Dogonowski AM, Ernst M, Fair D, Hampson M, Hoptman MJ, Hyde JS, Kiviniemi VJ, Kötter R, Li SJ, Lin CP, et al. (2010) Toward discovery science of human brain function. Proc Natl Acad Sci U S A 107:4734–4739. 10.1073/pnas.0911855107 [DOI] [PMC free article] [PubMed] [Google Scholar]
- Bloemendaal M, Zandbelt B, Wegman J, van de Rest O, Cools R, Aarts E (2016) Contrasting neural effects of aging on proactive and reactive response inhibition. Neurobiol Aging 46:96–106. 10.1016/j.neurobiolaging.2016.06.007 [DOI] [PubMed] [Google Scholar]
- Braga RM, Buckner RL (2017) Parallel interdigitated distributed networks within the individual estimated by intrinsic functional connectivity. Neuron 95:457–471.e5. 10.1016/j.neuron.2017.06.038 [DOI] [PMC free article] [PubMed] [Google Scholar]
- Buckner RL, Sepulcre J, Talukdar T, Krienen FM, Liu H, Hedden T, Andrews-Hanna JR, Sperling RA, Johnson KA (2009) Cortical hubs revealed by intrinsic functional connectivity: mapping, assessment of stability, and relation to Alzheimer's disease. J Neurosci 29:1860–1873. 10.1523/JNEUROSCI.5062-08.2009 [DOI] [PMC free article] [PubMed] [Google Scholar]
- Cai W, George JS, Verbruggen F, Chambers CD, Aron AR (2012a) The role of the right presupplementary motor area in stopping action: two studies with event-related transcranial magnetic stimulation. J Neurophysiol 108:380–389. 10.1152/jn.00132.2012 [DOI] [PMC free article] [PubMed] [Google Scholar]
- Cai W, George JS, Chambers CD, Stokes MG, Verbruggen F, Aron AR (2012b) Stimulating deep cortical structures with the batwing coil: how to determine the intensity for transcranial magnetic stimulation using coil-cortex distance. J Neurosci Methods 204:238–241. 10.1016/j.jneumeth.2011.11.020 [DOI] [PMC free article] [PubMed] [Google Scholar]
- Cai W, Ryali S, Chen T, Li CS, Menon V (2014) Dissociable roles of right inferior frontal cortex and anterior insula in inhibitory control: evidence from intrinsic and task-related functional parcellation, connectivity, and response profile analyses across multiple datasets. J Neurosci 34:14652–14667. 10.1523/JNEUROSCI.3048-14.2014 [DOI] [PMC free article] [PubMed] [Google Scholar]
- Cavada C, Goldman-Rakic PS (1989) Posterior parietal cortex in rhesus monkey: I. Parcellation of areas based on distinctive limbic and sensory corticocortical connections. J Comp Neurol 287:393–421. 10.1002/cne.902870402 [DOI] [PubMed] [Google Scholar]
- Chambers CD, Bellgrove MA, Stokes MG, Henderson TR, Garavan H, Robertson IH, Morris AP, Mattingley JB (2006) Executive “brake failure” following deactivation of human frontal lobe. J Cogn Neurosci 18:444–455. 10.1162/089892906775990606 [DOI] [PubMed] [Google Scholar]
- Chikazoe J, Jimura K, Hirose S, Yamashita K, Miyashita Y, Konishi S (2009) Preparation to inhibit a response complements response inhibition during performance of a stop-signal task. J Neurosci 29:15870–15877. 10.1523/JNEUROSCI.3645-09.2009 [DOI] [PMC free article] [PubMed] [Google Scholar]
- Cohen AL, Fair DA, Dosenbach NU, Miezin FM, Dierker D, Van Essen DC, Schlaggar BL, Petersen SE (2008) Defining functional areas in individual human brains using resting functional connectivity MRI. Neuroimage 41:45–57. 10.1016/j.neuroimage.2008.01.066 [DOI] [PMC free article] [PubMed] [Google Scholar]
- Cools R, Clark L, Owen AM, Robbins TW (2002) Defining the neural mechanisms of probabilistic reversal learning using event-related functional magnetic resonance imaging. J Neurosci 22:4563–4567. 10.1523/JNEUROSCI.22-11-04563.2002 [DOI] [PMC free article] [PubMed] [Google Scholar]
- Corbetta M, Shulman GL (2002) Control of goal-directed and stimulus-driven attention in the brain. Nat Rev Neurosci 3:201–215. 10.1038/nrn755 [DOI] [PubMed] [Google Scholar]
- Crossley NA, Mechelli A, Vértes PE, Winton-Brown TT, Patel AX, Ginestet CE, McGuire P, Bullmore ET (2013) Cognitive relevance of the community structure of the human brain functional coactivation network. Proc Natl Acad Sci U S A 110:11583–11588. 10.1073/pnas.1220826110 [DOI] [PMC free article] [PubMed] [Google Scholar]
- Desrochers TM, Chatham CH, Badre D (2015) The necessity of rostrolateral prefrontal cortex for higher-level sequential behavior. Neuron 87:1357–1368. 10.1016/j.neuron.2015.08.026 [DOI] [PMC free article] [PubMed] [Google Scholar]
- Drewe EA. (1975) Go-no go learning after frontal lobe lesions in humans. Cortex 11:8–16. 10.1016/S0010-9452(75)80015-3 [DOI] [PubMed] [Google Scholar]
- Duann JR, Ide JS, Luo X, Li CS (2009) Functional connectivity delineates distinct roles of the inferior frontal cortex and presupplementary motor area in stop signal inhibition. J Neurosci 29:10171–10179. 10.1523/JNEUROSCI.1300-09.2009 [DOI] [PMC free article] [PubMed] [Google Scholar]
- Eickhoff SB, Thirion B, Varoquaux G, Bzdok D (2015) Connectivity-based parcellation: critique and implications. Hum Brain Mapp 36:4771–4792. 10.1002/hbm.22933 [DOI] [PMC free article] [PubMed] [Google Scholar]
- Eickhoff SB, Laird AR, Fox PT, Bzdok D, Hensel L (2016) Functional segregation of the human dorsomedial prefrontal cortex. Cereb Cortex 26:304–321. 10.1093/cercor/bhu250 [DOI] [PMC free article] [PubMed] [Google Scholar]
- Erika-Florence M, Leech R, Hampshire A (2014) A functional network perspective on response inhibition and attentional control. Nat Commun 5:4073. 10.1038/ncomms5073 [DOI] [PMC free article] [PubMed] [Google Scholar]
- Ester EF, Sprague TC, Serences JT (2015) Parietal and frontal cortex encode stimulus-specific mnemonic representations during visual working memory. Neuron 87:893–905. 10.1016/j.neuron.2015.07.013 [DOI] [PMC free article] [PubMed] [Google Scholar]
- Feinberg DA, Moeller S, Smith SM, Auerbach E, Ramanna S, Gunther M, Glasser MF, Miller KL, Ugurbil K, Yacoub E (2010) Multiplexed echo planar imaging for sub-second whole brain FMRI and fast diffusion imaging. PLoS One 5:e15710. 10.1371/journal.pone.0015710 [DOI] [PMC free article] [PubMed] [Google Scholar]
- Finn ES, Shen X, Scheinost D, Rosenberg MD, Huang J, Chun MM, Papademetris X, Constable RT (2015) Functional connectome fingerprinting: identifying individuals using patterns of brain connectivity. Nat Neurosci 18:1664–1671. 10.1038/nn.4135 [DOI] [PMC free article] [PubMed] [Google Scholar]
- Floden D, Stuss DT (2006) Inhibitory control is slowed in patients with right superior medial frontal damage. J Cogn Neurosci 18:1843–1849. 10.1162/jocn.2006.18.11.1843 [DOI] [PubMed] [Google Scholar]
- Fornito A, Zalesky A, Breakspear M (2015) The connectomics of brain disorders. Nat Rev Neurosci 16:159–172. 10.1038/nrn3901 [DOI] [PubMed] [Google Scholar]
- Fox MD, Raichle ME (2007) Spontaneous fluctuations in brain activity observed with functional magnetic resonance imaging. Nat Rev Neurosci 8:700–711. 10.1038/nrn2201 [DOI] [PubMed] [Google Scholar]
- Garavan H, Ross TJ, Stein EA (1999) Right hemispheric dominance of inhibitory control: an event-related functional MRI study. Proc Natl Acad Sci U S A 96:8301–8306. 10.1073/pnas.96.14.8301 [DOI] [PMC free article] [PubMed] [Google Scholar]
- Glasser MF, Coalson TS, Robinson EC, Hacker CD, Harwell J, Yacoub E, Ugurbil K, Andersson J, Beckmann CF, Jenkinson M, Smith SM, Van Essen DC (2016) A multi-modal parcellation of human cerebral cortex. Nature 536:171–178. 10.1038/nature18933 [DOI] [PMC free article] [PubMed] [Google Scholar]
- Gold JI, Shadlen MN (2007) The neural basis of decision making. Annu Rev Neurosci 30:535–574. 10.1146/annurev.neuro.29.051605.113038 [DOI] [PubMed] [Google Scholar]
- Gordon EM, Laumann TO, Adeyemo B, Huckins JF, Kelley WM, Petersen SE (2016) Generation and evaluation of a cortical area parcellation from resting-state correlations. Cereb Cortex 26:288–303. 10.1093/cercor/bhu239 [DOI] [PMC free article] [PubMed] [Google Scholar]
- Gordon EM, Laumann TO, Gilmore AW, Newbold DJ, Greene DJ, Berg JJ, Ortega M, Hoyt-Drazen C, Gratton C, Sun H, Hampton JM, Coalson RS, Nguyen AL, McDermott KB, Shimony JS, Snyder AZ, Schlaggar BL, Petersen SE, Nelson SM, Dosenbach NUF (2017) Precision functional mapping of individual human brains. Neuron 95:791–807.e7. 10.1016/j.neuron.2017.07.011 [DOI] [PMC free article] [PubMed] [Google Scholar]
- Hanajima R, Ugawa Y, Machii K, Mochizuki H, Terao Y, Enomoto H, Furubayashi T, Shiio Y, Uesugi H, Kanazawa I (2001) Interhemispheric facilitation of the hand motor area in humans. J Physiol 531:849–859. 10.1111/j.1469-7793.2001.0849h.x [DOI] [PMC free article] [PubMed] [Google Scholar]
- Hirose S, Watanabe T, Jimura K, Katsura M, Kunimatsu A, Abe O, Ohtomo K, Miyashita Y, Konishi S (2012) Local signal time-series during rest used for areal boundary mapping in individual human brains. PLoS One 7:e36496. 10.1371/journal.pone.0036496 [DOI] [PMC free article] [PubMed] [Google Scholar]
- Hirose S, Watanabe T, Wada H, Imai Y, Machida T, Shirouzu I, Miyashita Y, Konishi S (2013) Functional relevance of micromodules in the human association cortex delineated with high-resolution FMRI. Cereb Cortex 23:2863–2871. 10.1093/cercor/bhs268 [DOI] [PubMed] [Google Scholar]
- Hirose S, Osada T, Ogawa A, Tanaka M, Wada H, Yoshizawa Y, Imai Y, Machida T, Akahane M, Shirouzu I, Konishi S (2016) Lateral-medial dissociation in rrbitofrontal cortex-hypothalamus connectivity. Front Hum Neurosci 10:244. 10.3389/fnhum.2016.00244 [DOI] [PMC free article] [PubMed] [Google Scholar]
- Jahfari S, Waldorp L, van den Wildenberg WP, Scholte HS, Ridderinkhof KR, Forstmann BU (2011) Effective connectivity reveals important roles for both the hyperdirect (fronto-subthalamic) and the indirect (fronto-striatal-pallidal) fronto-basal ganglia pathways during response inhibition. J Neurosci 31:6891–6899. 10.1523/JNEUROSCI.5253-10.2011 [DOI] [PMC free article] [PubMed] [Google Scholar]
- Jimura K, Hirose S, Kunimatsu A, Ohtomo K, Koike Y, Konishi S (2014) Late enhancement of brain-behavior correlations during response inhibition. Neuroscience 274:383–392. 10.1016/j.neuroscience.2014.05.058 [DOI] [PubMed] [Google Scholar]
- Kastner S, Ungerleider LG (2000) Mechanisms of visual attention in the human cortex. Annu Rev Neurosci 23:315–341. 10.1146/annurev.neuro.23.1.315 [DOI] [PubMed] [Google Scholar]
- Lambert C, Zrinzo L, Nagy Z, Lutti A, Hariz M, Foltynie T, Draganski B, Ashburner J, Frackowiak R (2012) Confirmation of functional zones within the human subthalamic nucleus: patterns of connectivity and sub-parcellation using diffusion weighted imaging. Neuroimage 60:83–94. 10.1016/j.neuroimage.2011.11.082 [DOI] [PMC free article] [PubMed] [Google Scholar]
- Laumann TO, Gordon EM, Adeyemo B, Snyder AZ, Joo SJ, Chen MY, Gilmore AW, McDermott KB, Nelson SM, Dosenbach NU, Schlaggar BL, Mumford JA, Poldrack RA, Petersen SE (2015) Functional system and areal organization of a highly sampled individual human brain. Neuron 87:657–670. 10.1016/j.neuron.2015.06.037 [DOI] [PMC free article] [PubMed] [Google Scholar]
- Lee TG, D'Esposito M (2012) The dynamic nature of top-down signals originating from prefrontal cortex: a combined fMRI-TMS study. J Neurosci 32:15458–15466. 10.1523/JNEUROSCI.0627-12.2012 [DOI] [PMC free article] [PubMed] [Google Scholar]
- Li CS, Huang C, Constable RT, Sinha R (2006) Imaging response inhibition in a stop-signal task: neural correlates independent of signal monitoring and post-response processing. J Neurosci 26:186–192. 10.1523/JNEUROSCI.3741-05.2006 [DOI] [PMC free article] [PubMed] [Google Scholar]
- Logan GD, Cowan WB (1984) On the ability to inhibit thought and action: a theory of an act of control. Psychol Rev 91:295 10.1037/0033-295X.91.3.295 [DOI] [PubMed] [Google Scholar]
- Margulies DS, Kelly AM, Uddin LQ, Biswal BB, Castellanos FX, Milham MP (2007) Mapping the functional connectivity of anterior cingulate cortex. Neuroimage 37:579–588. 10.1016/j.neuroimage.2007.05.019 [DOI] [PubMed] [Google Scholar]
- Margulies DS, Ghosh SS, Goulas A, Falkiewicz M, Huntenburg JM, Langs G, Bezgin G, Eickhoff SB, Castellanos FX, Petrides M, Jefferies E, Smallwood J (2016) Situating the default-mode network along a principal gradient of macroscale cortical organization. Proc Natl Acad Sci U S A 113:12574–12579. 10.1073/pnas.1608282113 [DOI] [PMC free article] [PubMed] [Google Scholar]
- Mars RB, Sallet J, Schüffelgen U, Jbabdi S, Toni I, Rushworth MF (2012) Connectivity-based subdivisions of the human right “temporoparietal junction area”: evidence for different areas participating in different cortical networks. Cereb Cortex 22:1894–1903. 10.1093/cercor/bhr268 [DOI] [PubMed] [Google Scholar]
- Milner B. (1963) Effects of different brain lesions on card sorting: the role of the frontal lobes. Arch Neurol 9:90–100. 10.1001/archneur.1963.00460070100010 [DOI] [Google Scholar]
- Milner B. (1964) Some effects of frontal lobectomy in man. In: The frontal granular cortex and behavior (Warren JM, Akert K, eds), pp 313–334. New York: McGraw-Hill. [Google Scholar]
- Mishkin M. (1964) Perseveration of central sets after frontal lesions in monkeys. In: The frontal granular cortex and behavior (Warren JM, Akert K, ed), pp 219–241. New York: McGraw-Hill. [Google Scholar]
- Miyashita Y. (2016) The cutting edge in brain science and sportology. Juntendo Med J 62 [Suppl 1]:6–11. 10.14789/jmj.62.s6 [DOI] [Google Scholar]
- Morishima Y, Akaishi R, Yamada Y, Okuda J, Toma K, Sakai K (2009) Task-specific signal transmission from prefrontal cortex in visual selective attention. Nat Neurosci 12:85–91. 10.1038/nn.2237 [DOI] [PubMed] [Google Scholar]
- Nachev P, Wydell H, O'Neill K, Husain M, Kennard C (2007) The role of the pre-supplementary motor area in the control of action. Neuroimage 36 [Suppl 2]:T155–T163. [DOI] [PMC free article] [PubMed] [Google Scholar]
- Nelson SM, Cohen AL, Power JD, Wig GS, Miezin FM, Wheeler ME, Velanova K, Donaldson DI, Phillips JS, Schlaggar BL, Petersen SE (2010) A parcellation scheme for human left lateral parietal cortex. Neuron 67:156–170. 10.1016/j.neuron.2010.05.025 [DOI] [PMC free article] [PubMed] [Google Scholar]
- Neubert FX, Mars RB, Buch ER, Olivier E, Rushworth MF (2010) Cortical and subcortical interactions during action reprogramming and their related white matter pathways. Proc Natl Acad Sci U S A 107:13240–13245. 10.1073/pnas.1000674107 [DOI] [PMC free article] [PubMed] [Google Scholar]
- Ogawa A, Osada T, Tanaka M, Hori M, Aoki S, Nikolaidis A, Milham MP, Konishi S (2018) Striatal subdivisions that coherently interact with multiple cerebrocortical networks. Hum Brain Mapp 39:4349–4359. 10.1002/hbm.24275 [DOI] [PMC free article] [PubMed] [Google Scholar]
- Osada T, Suzuki R, Ogawa A, Tanaka M, Hori M, Aoki S, Tamura Y, Watada H, Kawamori R, Konishi S (2017) Functional subdivisions of the hypothalamus using areal parcellation and their signal changes related to glucose metabolism. Neuroimage 162:1–12. 10.1016/j.neuroimage.2017.08.056 [DOI] [PubMed] [Google Scholar]
- Pascual-Leone A, Walsh V, Rothwell J (2000) Transcranial magnetic stimulation in cognitive neuroscience—virtual lesion, chronometry, and functional connectivity. Curr Opin Neurobiol 10:232–237. 10.1016/S0959-4388(00)00081-7 [DOI] [PubMed] [Google Scholar]
- Poldrack RA, Laumann TO, Koyejo O, Gregory B, Hover A, Chen MY, Gorgolewski KJ, Luci J, Joo SJ, Boyd RL, Hunicke-Smith S, Simpson ZB, Caven T, Sochat V, Shine JM, Gordon E, Snyder AZ, Adeyemo B, Petersen SE, Glahn DC, et al. (2015) Long-term neural and physiological phenotyping of a single human. Nat Commun 6:8885. 10.1038/ncomms9885 [DOI] [PMC free article] [PubMed] [Google Scholar]
- Power JD, Barnes KA, Snyder AZ, Schlaggar BL, Petersen SE (2012) Spurious but systematic correlations in functional connectivity MRI networks arise from subject motion. Neuroimage 59:2142–2154. 10.1016/j.neuroimage.2011.10.018 [DOI] [PMC free article] [PubMed] [Google Scholar]
- Rae CL, Hughes LE, Anderson MC, Rowe JB (2015) The prefrontal cortex achieves inhibitory control by facilitating subcortical motor pathway connectivity. J Neurosci 35:786–794. 10.1523/JNEUROSCI.3093-13.2015 [DOI] [PMC free article] [PubMed] [Google Scholar]
- Rahnev D, Nee DE, Riddle J, Larson AS, D'Esposito M (2016) Causal evidence for frontal cortex organization for perceptual decision making. Proc Natl Acad Sci U S A 113:6059–6064. 10.1073/pnas.1522551113 [DOI] [PMC free article] [PubMed] [Google Scholar]
- Robbins TW. (1996) Dissociating executive functions of the prefrontal cortex. Philos Trans R Soc Lond B Biol Sci 351:1463–1471. 10.1098/rstb.1996.0131 [DOI] [PubMed] [Google Scholar]
- Rose NS, LaRocque JJ, Riggall AC, Gosseries O, Starrett MJ, Meyering EE, Postle BR (2016) Reactivation of latent working memories with transcranial magnetic stimulation. Science 354:1136–1139. 10.1126/science.aah7011 [DOI] [PMC free article] [PubMed] [Google Scholar]
- Rossini PM, Burke D, Chen R, Cohen LG, Daskalakis Z, Di Iorio R, Di Lazzaro V, Ferreri F, Fitzgerald PB, George MS, Hallett M, Lefaucheur JP, Langguth B, Matsumoto H, Miniussi C, Nitsche MA, Pascual-Leone A, Paulus W, Rossi S, Rothwell JC, et al. (2015) Non-invasive electrical and magnetic stimulation of the brain, spinal cord, roots and peripheral nerves: basic principles and procedures for routine clinical and research application. an updated report from an I.F.C.N. Committee. Clin Neurophysiol 126:1071–1107. 10.1016/j.clinph.2015.02.001 [DOI] [PMC free article] [PubMed] [Google Scholar]
- Rushworth MF, Taylor PC (2006) TMS in the parietal cortex: updating representations for attention and action. Neuropsychologia 44:2700–2716. 10.1016/j.neuropsychologia.2005.12.007 [DOI] [PubMed] [Google Scholar]
- Smittenaar P, Guitart-Masip M, Lutti A, Dolan RJ (2013) Preparing for selective inhibition within frontostriatal loops. J Neurosci 33:18087–18097. 10.1523/JNEUROSCI.2167-13.2013 [DOI] [PMC free article] [PubMed] [Google Scholar]
- Sporns O. (2014) Contributions and challenges for network models in cognitive neuroscience. Nat Neurosci 17:652–660. 10.1038/nn.3690 [DOI] [PubMed] [Google Scholar]
- Stokes MG, Chambers CD, Gould IC, Henderson TR, Janko NE, Allen NB, Mattingley JB (2005) Simple metric for scaling motor threshold based on scalp-cortex distance: application to studies using transcranial magnetic stimulation. J Neurophysiol 94:4520–4527. 10.1152/jn.00067.2005 [DOI] [PubMed] [Google Scholar]
- Stuss DT, Levine B, Alexander MP, Hong J, Palumbo C, Hamer L, Murphy KJ, Izukawa D (2000) Wisconsin card sorting test performance in patients with focal frontal and posterior brain damage: effects of lesion location and test structure on separable cognitive processes. Neuropsychologia 38:388–402. 10.1016/S0028-3932(99)00093-7 [DOI] [PubMed] [Google Scholar]
- Swann N, Tandon N, Canolty R, Ellmore TM, McEvoy LK, Dreyer S, DiSano M, Aron AR (2009) Intracranial EEG reveals a time- and frequency-specific role for the right inferior frontal gyrus and primary motor cortex in stopping initiated responses. J Neurosci 29:12675–12685. 10.1523/JNEUROSCI.3359-09.2009 [DOI] [PMC free article] [PubMed] [Google Scholar]
- Temel Y, Blokland A, Steinbusch HW, Visser-Vandewalle V (2005) The functional role of the subthalamic nucleus in cognitive and limbic circuits. Prog Neurobiol 76:393–413. 10.1016/j.pneurobio.2005.09.005 [DOI] [PubMed] [Google Scholar]
- Van Essen DC, Glasser MF, Dierker DL, Harwell J, Coalson T (2012) Parcellations and hemispheric asymmetries of human cerebral cortex analyzed on surface-based atlases. Cereb Cortex 22:2241–2262. 10.1093/cercor/bhr291 [DOI] [PMC free article] [PubMed] [Google Scholar]
- Verbruggen F, Aron AR, Stevens MA, Chambers CD (2010) Theta burst stimulation dissociates attention and action updating in human inferior frontal cortex. Proc Natl Acad Sci U S A 107:13966–13971. 10.1073/pnas.1001957107 [DOI] [PMC free article] [PubMed] [Google Scholar]
- Verbruggen F, Chambers CD, Logan GD (2013) Fictitious inhibitory differences: how skewness and slowing distort the estimation of stopping latencies. Psychol Sci 24:352–362. 10.1177/0956797612457390 [DOI] [PMC free article] [PubMed] [Google Scholar]
- Vincent JL, Kahn I, Snyder AZ, Raichle ME, Buckner RL (2008) Evidence for a frontoparietal control system revealed by intrinsic functional connectivity. J Neurophysiol 100:3328–3342. 10.1152/jn.90355.2008 [DOI] [PMC free article] [PubMed] [Google Scholar]
- Volman I, Roelofs K, Koch S, Verhagen L, Toni I (2011) Anterior prefrontal cortex inhibition impairs control over social emotional actions. Curr Biol 21:1766–1770. 10.1016/j.cub.2011.08.050 [DOI] [PubMed] [Google Scholar]
- Wagner AD, Shannon BJ, Kahn I, Buckner RL (2005) Parietal lobe contributions to episodic memory retrieval. Trends Cogn Sci 9:445–453. 10.1016/j.tics.2005.07.001 [DOI] [PubMed] [Google Scholar]
- Watanabe T, Hanajima R, Shirota Y, Ohminami S, Tsutsumi R, Terao Y, Ugawa Y, Hirose S, Miyashita Y, Konishi S, Kunimatsu A, Ohtomo K (2014) Bidirectional effects on interhemispheric resting-state functional connectivity induced by excitatory and inhibitory repetitive transcranial magnetic stimulation. Hum Brain Mapp 35:1896–1905. 10.1002/hbm.22300 [DOI] [PMC free article] [PubMed] [Google Scholar]
- Watanabe T, Hanajima R, Shirota Y, Tsutsumi R, Shimizu T, Hayashi T, Terao Y, Ugawa Y, Katsura M, Kunimatsu A, Ohtomo K, Hirose S, Miyashita Y, Konishi S (2015) Effects of rTMS of pre-supplementary motor area on fronto basal ganglia network activity during stop-signal task. J Neurosci 35:4813–4823. 10.1523/JNEUROSCI.3761-14.2015 [DOI] [PMC free article] [PubMed] [Google Scholar]
- Wessel JR, Conner CR, Aron AR, Tandon N (2013) Chronometric electrical stimulation of right inferior frontal cortex increases motor braking. J Neurosci 33:19611–19619. 10.1523/JNEUROSCI.3468-13.2013 [DOI] [PMC free article] [PubMed] [Google Scholar]
- Whelan R, Conrod PJ, Poline JB, Lourdusamy A, Banaschewski T, Barker GJ, Bellgrove MA, Büchel C, Byrne M, Cummins TD, Fauth-Bühler M, Flor H, Gallinat J, Heinz A, Ittermann B, Mann K, Martinot JL, Lalor EC, Lathrop M, Loth E, et al. (2012) Adolescent impulsivity phenotypes characterized by distinct brain networks. Nat Neurosci 15:920–925. 10.1038/nn.3092 [DOI] [PubMed] [Google Scholar]
- Wig GS, Laumann TO, Petersen SE (2014a) An approach for parcellating human cortical areas using resting-state correlations. Neuroimage 93:276–291. 10.1016/j.neuroimage.2013.07.035 [DOI] [PMC free article] [PubMed] [Google Scholar]
- Wig GS, Laumann TO, Cohen AL, Power JD, Nelson SM, Glasser MF, Miezin FM, Snyder AZ, Schlaggar BL, Petersen SE (2014b) Parcellating an individual subject's cortical and subcortical brain structures using snowball sampling of resting-state correlations. Cereb Cortex 24:2036–2054. 10.1093/cercor/bht056 [DOI] [PMC free article] [PubMed] [Google Scholar]
- Xu KZ, Anderson BA, Emeric EE, Sali AW, Stuphorn V, Yantis S, Courtney SM (2017) Neural basis of cognitive control over movement inhibition: human fMRI and primate electrophysiology evidence. Neuron 96:1447–1458.e6. 10.1016/j.neuron.2017.11.010 [DOI] [PMC free article] [PubMed] [Google Scholar]
- Yamasaki T, Ogawa A, Osada T, Jimura K, Konishi S (2018) Within-subject correlation analysis to detect functional areas associated with response inhibition. Front Hum Neurosci 12:208. 10.3389/fnhum.2018.00208 [DOI] [PMC free article] [PubMed] [Google Scholar]
- Zandbelt BB, Vink M (2010) On the role of the striatum in response inhibition. PLoS One 5:e13848. 10.1371/journal.pone.0013848 [DOI] [PMC free article] [PubMed] [Google Scholar]
- Zhang S, Li CS (2012) Functional connectivity mapping of the human precuneus by resting state fMRI. Neuroimage 59:3548–3562. 10.1016/j.neuroimage.2011.11.023 [DOI] [PMC free article] [PubMed] [Google Scholar]
- Zhang S, Li CS (2014) Functional clustering of the human inferior parietal lobule by whole-brain connectivity mapping of resting-state functional magnetic resonance imaging signals. Brain Connect 4:53–69. 10.1089/brain.2013.0191 [DOI] [PMC free article] [PubMed] [Google Scholar]
- Zhang S, Ide JS, Li CS (2012) Resting-state functional connectivity of the medial superior frontal cortex. Cereb Cortex 22:99–111. 10.1093/cercor/bhr088 [DOI] [PMC free article] [PubMed] [Google Scholar]
- Zhou X, Qi XL, Constantinidis C (2016) Distinct roles of the prefrontal and posterior parietal cortices in response inhibition. Cell Rep 14:2765–2773. 10.1016/j.celrep.2016.02.072 [DOI] [PMC free article] [PubMed] [Google Scholar]
Associated Data
This section collects any data citations, data availability statements, or supplementary materials included in this article.
Supplementary Materials
Brain connectivity in parcellated areas. Resting-state functional connectivity with the IFC (top) and the preSMA (bottom) for each parcellated area in the same subject in Fig. 3. The subthreshold functional connectivities are also displayed. The color scale indicates gaussian z score. Download Figure 3-1, TIF file (2.2MB, tif)
Test of independent race model assumptions for reaction time in the stop-signal task. (A) Reaction time for Go/Stop-failure trials in Stim and No-stim trials when TMS was targeted to the IPS (top) or TPJ (bottom) at each time window. Gray lines indicate data from each subject. ***p < 0.005, paired t-test. (B) Reaction time for Stop failure trials in Stop trials with longer/shorter SSDs when TMS was targeted to the IPS (top) or TPJ (bottom) at each time window. *p < 0.05, **p < 0.01, paired t-test. Download Figure 7-1, TIF file (3.6MB, tif)
Test of independent race model assumptions for individual inhibition functions. The normalized inhibition function plots the proportion of successfully stopped responses as a function of the relative finishing times (RFT) of the response and stop processes. Z-transformed RFT (ZRFT) was calculated as ZRFT = (RTgo – SSD – SSRT)/SD[RTgo]. Positive/negative ZRFT values indicate early/late stop signal onset. A cumulative Weibull function was fit to the group mean standardized inhibition function (solid line). Gray lines indicate data from each subject. Download Figure 7-2, TIF file (2.7MB, tif)