Abstract
Though implantable cardioverter defibrillators (ICDs) are increasing in use in both adults and children, little progress has been devoted to optimizing device and electrode placement. To facilitate effective ICD placement, especially in pediatric cases, we have developed a predictive model that evaluates the efficacy of a delivered shock. We have also developed an experimental validation approach based on measurements from clinical cases. The approach involves obtaining body surface potential maps of ICD discharges during implantation surgery using a limited lead selection and body surface estimation algorithm. Comparison of the simulated and measured potentials yielded very similar patterns and a typical correlation greater than 0.93, suggesting that the predictive simulation generates realistic potential values. This validation approach provides confidence in application of the simulation pipeline and offers areas to focus future improvements.
I. Introduction
Implantable cardioverter defibrillators (ICDs), used to prevent fatal arrhythmias, have become increasingly more common. The vast majority of these devices have been designed for use in adults using a standard implantation and have not been optimized for children or persons with abnormal anatomies or congenital defects [1]. As a result, new configurations, such as using only one shock lead instead of two or placing the ICD generator in the abdomen instead of the left upper chest, are increasingly used to to maximize the efficiency of the device and to provide increased safety for the patient [2]. Furthermore, recent studies have shown that the electric field generated by the ICD can alter the Ca++ dynamics of cardiac tissue, inhibiting the cell contraction, and interferes with normal hemodymics when the energy of the shock is larger than necessary [3], [4]. Both the risk of over-shock and the growing number of unique cases motivate developments for improving device placement and settings.
In order to optimize the use of ICDs, we have produced a computational simulation pipeline that enables predictions of the potential field throughout the torso during defibrillation, with which the defibrillation threshold (DFT), or lowest level of energy needed for defibrillation, is calculated for any given device and patient geometry [5], [6]. In validation studies, this simulation has shown encouraging accuracy in predicting the threshold energy required for successful defibrillation[5]. However, validations to date have been limited to DFT comparisons, demonstrating the accuracy of the final outcome, but not necessarily that the calculated potential field distributions throughout the torso are accurate. A more comprehensive validation requires comparison to clinical recordings of potentials generated by the ICD.
We have developed a method to measure the full surface potential maps generated during ICD discharge to obtain data for use in comparison with and validation of the predictive simulation mentioned. It is possible to measure ICD surface potentials in humans during implantation surgery when the device is tested, providing a recording opportunity but presenting significant spatial limitations. By applying a limited lead selection and body surface estimation algorithm [7], we can obtain full ICD potential maps while recording from 32 surface electrodes during ICD testing and use these potential maps to compare with our simulation.
The goal of this study was to validate the patient specific simulation of defibrillation by recording body surface potentials during ICD testing. The high level of agreement between simulated and measured values provided encouraging evidence that accurate predictions that account for patient specific anatomy and that device placement is very feasible. Furthermore, these results support use of our simulation approach in answering clinical questions [5], [6] and motivate ongoing studies to optimize lead and device placement, especially in pediatric patients and those with unusual anatomy.
II. Methods
The validation approach taken in this study included acquisition of potential maps generated during ICD testing and a comparison to simulated values. To perform this validation, we first applied the limited lead selection and body surface estimation algorithm to determine the ideal lead set for surface recordings and to calculate a transformation to estimate the full potential map [7]. Then we used the lead set and transformation to obtain potential maps during ICD test. Finally we created a model of each patient to compare with the clinical data.
A. Reconstructing Surface Potentials
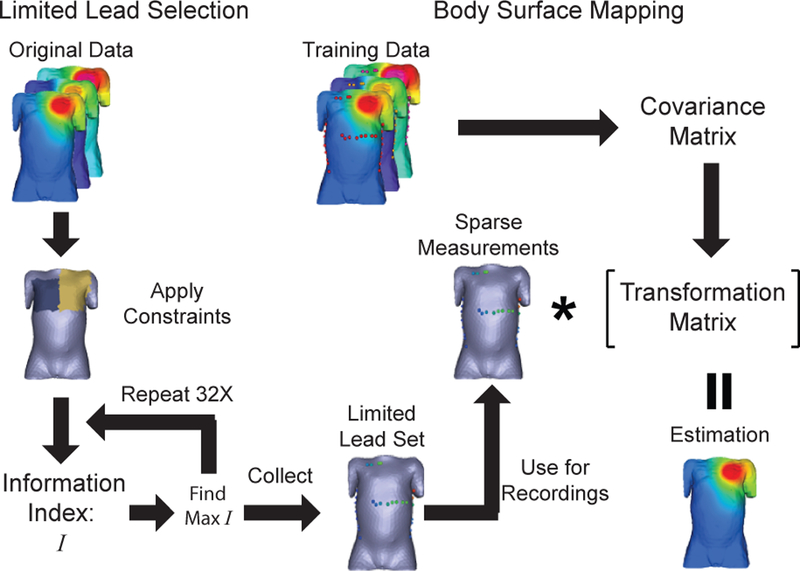
The limited lead selection and body surface estimation algorithm exploits spacial redundancies in potential maps to obtain full potential maps with a small subset of points [7]. This algorithm requires a collection of full potential maps to train the algorithm, i.e., to analyze the statistical variation between each point to calculate the limited lead set and the transformation between that subset and the full map. We used a database of simulated surface potentials to train the algorithm for use with ICD recordings. This database consisted of simulated surface potentials from geometries of seven patients, including the four presented in this paper with ICD geometries with small variation in device location and variations of tissue conductivity values yielding 2030 potential maps to use in the algorithm. Low level gaussian noise (5 V, 1 % of the max shock) was added to the potential maps to account for recording errors introduced by spatial registration errors and system noise. Using this database of potentials, we trained the algorithm to measure potential maps of the ICD discharge as shown in Figure 1.
Fig. 1.

Application of the limited lead selection and the body surface estimation algorithm used to measure the ICD surface potential maps.
The limited lead selection and body surface estimation algorithm was applied to the database of simulated potentials as described in Figure 1 and Lux et al.[7]. The limited lead selection was performed on the full database with applied spatial constraints representing limitations present during surgery to yield the optimal lead set of 32 surface electrodes to record potentials. The transformation relating these lead location (P1) and the remaining potential map (P2) was the calculated for each patient using a subset of the simulated database so the relationship between the two subsets are expressed as:
| (1) |
where is the estimation of P2, T is a transformation matrix, and and are the subsets of the vector that express the mean of each location . Each transformation was calculated based on potentials generated from the patient’s geometry (280 potential maps), so that the variation derived from ICD location and conductivity differences. Body surface estimation was performed on a separate database of simulated potentials to test the algorithm. The estimated potential maps were compared to the simulated maps for each patient and evaluated using absolute error, correlation (ρ), relative error (RE), and relative root-mean-squared (RMS) error . The average values presented are given as mean ± standard deviation.
B. Recording Surface Potentials
To obtain measured potentials during ICD testing, we used surface recording electrodes (32 plus 2 electrodes for ground and reference), applied to four subjects before the ICD implantation surgery. The electrodes were placed as close to the limited lead locations calculated by the algorithm as possible; the actual locations were documented for reconstruction. While the ICD was tested, the surface potentials were recorded using a 32-channel recording system (CVRTI, University of Utah) at 1 kHz, 2 kHz, or 4 kHz sampling rate. The potentials generated by the ICD were attenuated by a factor of 104 to obtain a signals within the range of the recording system. The potentials for reconstruction were identified as the potential at the first peak of the ICD pulse and assigned as the limited lead subset (P1). The body surface potential map was then estimated using the calculation transformation (1). The estimated potential maps were compared to the simulated maps for each patient and evaluated using the same metrics as with the simulated potentials. The average values presented are given as mean ± standard deviation.
C. Patient Specific Simulation
The simulation pipeline used for patient specific modeling of defibrillation in this study is the same as described by Jolley et al.[5], [6]. Four patients identified as candidates for ICD implantation were scanned prior to implantation using a 1.5 T MRI scanner with a double IR pulse sequence. From these scans, segmentations of each of 10 tissues were generated using Seg3D software (SCI Institute, University of Utah) providing patient specific torso geometries. The ICD geometry modeled in each patient was manually placed using post-operative x-ray images as reference. Using SCIRun, the torso model and ICD geometries were then used in the simulation pipeline to predict the surface potentials for each recorded shock. The calculated surface potentials were sampled at the same 370 points used in lead estimation and compared to the recorded surface potentials.
III. Results
The results presented in this section demonstrate the ability to reconstruct ICD surface potentials from 32 leads.
A. Reconstruction of Simulated Surface Potentials
The results of the limited lead selection and body surface estimation algorithm indicated low error and high correlation when the body surface maps were estimated. The limited lead selection tended to yield locations as close to the ICD device and shock coils as possible, resulting in a high concentration of leads on the shoulders, along the mid-axillary lines, and near the xyphoid process. Additionally, the limited lead selection and body surface estimation demonstrated exponentially reducing error with an increase in the number of electrodes in the lead set. The error did not significantly decrease when using more than 30 electrodes.
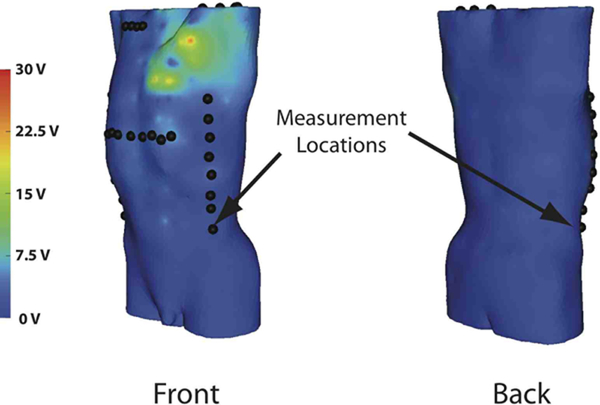
The body surface estimation algorithm exhibited high correlation (0.9998±3×10⁻⁴), low RMS error (0.04±0.06 %), and low relative error (0.6±0.3 %). The mean maximum error of the estimation was 29±20 V on shocks of 500 V. Figure 2 shows the typical location of high error, near the left upper chest where the ICD was placed. Though it was not possible to use the exact limited lead locations calculated, changes in the lead set used did not significantly effect the accuracy of the estimation from simulated surface potentials. The reconstruction of the lead set with the greatest error based on the location and the number of the leads, did not change the RMS error more than 0.002 %, the relative error more than 0.02 %, and the correlation more than 1×10⁻⁵. These changes in the metrics are within the standard deviation of the metrics from the limited lead set.
Fig. 2.

Typical absolute error between actual and reconstructed potentials by location from a shock with 500 V magnitude.
B. Reconstructing Measured Surface Potentials
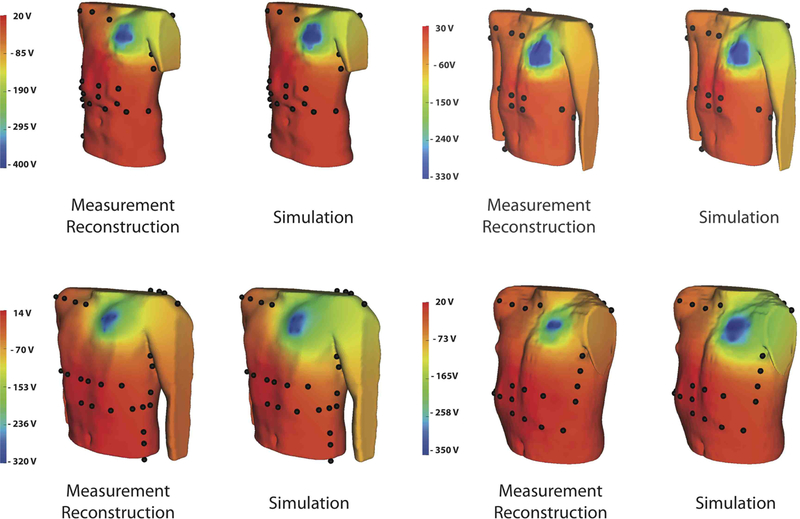
The body surface estimation algorithm was effective in generating potential maps of ICD discharges that were qualitatively and quantitatively similar to the maps from the patient specific simulation. Figure 3 shows examples of measured ICD shock potentials and those simulated for the same patient. Qualitatively, the potential maps were similar, although some cases showed local regions of error near the left upper chest near the location of the device. The statistical results in Table I show the quantitative comparison between the reconstructions and simulations for all four patients. The correlation for all shocks was above 0.93 with a mean of 0.956±0.015. Similarly, the relative error was also low for each of the shocks with a mean of 11±5 %. The RMS error demonstrated similar levels of accuracy of 5±2 %.
Fig. 3.

Surface potential comparison between the reconstruction obtained from surface recordings and the simulation.
TABLE I.
Metrics relating the simulated potential maps to the maps generated from the surface recordings. ρ is correlation, RE is relative error, and Ē is relative rms error.
| Subject age | shock max | ρ | RE | E |
|---|---|---|---|---|
| 8 yo | 314 V | 0.932 | 13.8 % | 6.97 % |
| 445 V | 0.939 | 12.6 % | 6.64 % | |
| 545 V | 0.993 | 1.46 % | 2.26 % | |
| 700 V | 0.953 | 9.38 % | 5.74 % | |
| 9 yo | 437 V | 0.953 | 9.23 % | 6.03 % |
| 618 V | 0.965 | 7.17 % | 5.32 % | |
| 16 yo | 450 V | 0.951 | 11 % | 7.57 % |
| 650 V | 0.958 | 8.29 % | 6.59 % | |
| 17 yo | 309 V | 0.957 | 18.4 % | 8.09 % |
| 438 V | 0.955 | 17.5 % | 7.9 % | |
| 536 V | 0.955 | 18.3 % | 8.07 % | |
IV. Discussion and conclusions
The goal of this study was to validate the simulation approach that we have used in past studies [5], [6] to investigate the effects of ICD device and lead placement. The high accuracy of estimation using both simulated potentials and recorded potentials provide convincing and consistant evidence of both the validation approach and the accuracy of our simulation pipeline.
The limited lead selection and body surface estimation algorithm adapted in this study demonstrated its capacity for use in the context of ICD potential distributions. The lead selection generally chose locations as close as possible to the extrema of the potential distribution over the chest, a finding Lux et al. also observed for potentials generated by the heart in the original formulation [7]. The optimal number of leads determined from the limited lead selection (30) was also similar to the 32 selected by Lux et al.[7]. The estimation of the surface potential maps showed high accuracy when estimating the simulated potential fields (Figure 2), demonstrating similar fidelity to that of Lux et al.[7].
The high level of agreement between measured and simulated torso potentials of each patient was encouraging and indicated reasonable accuracy of the simulations. Despite very high statistical agreement, there were persistent local differences that provide insight into possible sources of error that need to be addressed. One potential source of error in the simulation was the assumption of the heart as a homogeneous, isotropic passive conductor. This simplification alters the electric field near the heart [8] and in some cases may significantly alter the far–field potential distribution within the torso [9]. Ongoing studies seek to include estimated fiber orientation[10] in models of the human torso in order to evaluate the possible contribution to simulated potentials.
Validation of the modeling and simulation approach in this study also provides support for our previously reported findings [5], [6]. Those results suggested that defibrillation efficiency is strongly dependent on device and lead placement and that it was possible to optimize device implantation in a way that could take into account variations in torso anatomy, including congenital abnormalities in children (or adults), or the use of subcutaneous defibrillation electrodes. Continuing studies by our group seek to advance both the application and the design of implantable defibrillators based on these simulations. Our validation approach offers further confidence in past and future application of our simulation pipeline.
V. Acknowledgments
The research presented in this paper was made possible with help from Philip Erchler and Bruce Steadman from Cardiovascular Research and Training Institute (CVRTI), John Triedman from Children’s Hospital Boston, and Matthew Jolley from Stanford University.
This work was supported by a seed grant from The University of Utah
Contributor Information
Jess Tate, Department of Bioengineering, University of Utah, Salt Lake City, UT 84112, USA jess@sci.utah.edu.
Jeroen Stinstra, Scientific Computing and Imaging Institute, University of Utah.
Thomas Pilcher, Department of Cardiology, University of Utah.
Ahrash Poursaid, Scientific Computing and Imaging Institute, University of Utah.
Elizabeth Saarel, Department of Cardiology, University of Utah.
Rob MacLeod, Department of Bioengineering, and the Scientific Computing and Imaging Institute, University of Utah.
References
- [1].Kugler JD and Erickson CC, “Nontransvenous implantable cardioverter defibrillator systems: not just for small pediatric patients,” J. Cardiovasc. Electrophysiol, vol. 17, no. 1, p. 47, January 2006, iD: 17; PUBM: Print; JID: 9010756; ppublish 1045–3873 Journal. [DOI] [PubMed] [Google Scholar]
- [2].Cannon B, Friedman R, Fenrich A, Fraser C, McKenzie E, and Kertesz N, “Innovative techniques for placement of implantable cardioverter-defibrillator leads in patients with limited venous access to the heart,” PACE, vol. 29, pp. 181–187, 2006. [DOI] [PubMed] [Google Scholar]
- [3].Ristagno G, Wang T, Tang W, Sun S, Castillo C, and Weil MH, “High-energy defibrillation impairs myocyte contractility and intracellular calcium dynamics,” Critical Care Medicine, vol. 36(11), no. SupplNovember, pp. S422–S427, 2008. [DOI] [PubMed] [Google Scholar]
- [4].Tokano T, Bach D, Chang J, Davis J, Souza JJ, Zivin A, Knight BP, Goyal R, Man KC, Morady F, and Strickberger SA, “Effect of ventricular shock strength on cardiac hemodynamics,” J. Cardiovasc. Electrophysiol, vol. 9, no. 8, pp. 791–797, 1998. [DOI] [PubMed] [Google Scholar]
- [5].Jolley M, Stinstra J, Pieper S, MacLeod R, Brooks DH, Cecchin F, and Triedman JK, “A computer modeling tool for comparing novel ICD electrode orientations in children and adults,” Heart Rythm. J, vol. 5, no. 4, pp. 565–572, 2008. [DOI] [PMC free article] [PubMed] [Google Scholar]
- [6].Jolley M, Stinstra J, Tate J, Pieper S, Macleod R, Chu L, Wang P, and Triedman J, “Finite element modeling of subcutaneous implantable defibrillator electrodes in an adult torso.” Heart Rythm. J, vol. 7, no. 5, pp. 692–698, May 2010. [DOI] [PMC free article] [PubMed] [Google Scholar]
- [7].Lux RL, Smith CR, Wyatt RF, and Abildskov JA, “Limited lead selection for estimation of body surface potential maps in electocardiography,” IEEE Trans Biomed. Eng, vol. BME-25, No. 3, no. May 1978, pp. 270–276, 1978. [DOI] [PubMed] [Google Scholar]
- [8].Trayanova N, Skouibine K, and Aguel F, “The role of cardiac tissue structure in defibrillation.” Chaos, vol. 8, no. 1, pp. 221–233, March 1998. [DOI] [PubMed] [Google Scholar]
- [9].Stinstra J, Jolley M, Tate J, Brooks D, Triedman J, and MacLeod R, “The role of volume conductivities in simulation of implantable defibrillators,” in Computers in Cardiology, Murray A, Ed., vol. 35, Computers in Cardiology IEEE Press, 2008, pp. 481–484. [Google Scholar]
- [10].Vadakkumpadan F, Rantner L, Tice B, Boyle B, Prassl A, Vigmond E, Plank G, and Trayanova N, “Image-based models of cardiac structure with applications in arrhythmia and defibrillation studies,” J. Electrocardiol, vol. 42, no. 12, pp. 157–167, 2009. [DOI] [PMC free article] [PubMed] [Google Scholar]


