Abstract
Background
The lesser trochanter (LT) posterior cortical extension (LTPE) fragment is important for joint stability during reconstruction in unstable pertrochanteric hip fractures. This study aimed to investigate the morphological characteristics of the LT fragments using three-dimensional computed tomography (3-D CT) reconstruction and to compare clinical outcomes in different subgroups of 31A2 fractures.
Material/Methods
A retrospective study included CT images of 58 cases of 31A2 type unstable pertrochanteric fractures, using the Arbeitsgemeinschaft für Osteosynthesefragen and Orthopedic Trauma Association (AO/OTA) classification. After 3-D CT reconstruction, all the displaced fragments were reduced and the morphologic parameters of the LT fragments were measured.
Results
At the mid-level of the LT, the mean cortical extension of the LT fragment was 33.5 mm in the posterior wall (83%), 19.0 mm in the medial wall (53%). The mean distal cortical extension from the lower edge of the LT was 13.0 mm. The LT fragment occupied 38% of the whole cortical circumference. Comparison of the subgroups showed that the LT fragment of A2.3 had a larger cortical extension in the posterior, medial, and distal cortex. The mean fracture collapse was 4.7 mm in A2.2 fractures and 5.4 mm in A2.3 fractures (p=0.311). Despite the increased size of the LT fragment in subtype A2.3 fracture compared with subtype A2.2 fracture, this did not influence the clinical outcome.
Conclusions
The 3-D morphology of the LT fragment from CT imaging provided a better understanding of the characteristics of subgroups of unstable pertrochanteric fractures, which may improve and guide implant choice.
MeSH Keywords: Fractures, Comminuted; Hip Fractures; Imaging, Three-Dimensional
Background
Pertrochanteric hip fractures are extracapsular fractures that occur through the trochanters. Worldwide, in the elderly population, pertrochanteric and intertrochanteric hip fractures are a major orthopedic management challenge [1]. To guide treatment of hip fractures, the Arbeitsgemeinschaft für Osteosynthesefragen and Orthopedic Trauma Association (AO/OTA) classification divides pertrochanteric and intertrochanteric hip fractures into groups 31A1, 31A2 and 31A3. The A1 fracture type is a simple two-part pertrochanteric fracture with the fracture line running through the greater trochanter. The A2 type always has an intermediate fragment, which is the third posteromedial lesser trochanter (LT) fragment. The 31A2 fractures are further classified into three subgroups A2.1, A2.2, and A2.3 according to the degree of comminution and the extent of the LT fragment [2]. A2.2 and A2.3 fractures are considered to be unstable fractures, as they can have a fourth intermediate fragment and/or the LT fragments extend more than 1 cm below the lower edge of the lesser trochanter [3,4].
Previous biomechanical studies have shown that the LT plays a key role in the reconstruction of fracture stability, and the larger the size of the defect that the detached LT fragments create, the more unstable the fracture [5,6]. The lesser trochanter (LT) posterior cortical extension (LTPE) fragment is important for joint stability during reconstruction in unstable pertrochanteric hip fractures. However, little is known about the detailed morphology of the LT fragment and whether the larger size of the LT fragment in the subgroup of 31A2 fractures can influence the clinical outcome.
This study aimed to investigate the morphological characteristics of the LT fragments using three-dimensional computed tomography (3-D CT) reconstruction and to compare clinical outcomes in different subgroups of 31A2 fractures.
Material and Methods
Patient data collection
Institutional Review Board (IRB) approval (No. LL 2017-ZRKX-013, date: 2017.02.24) was granted from our institution before the study began. A retrospective review identified 107 consecutive patients who had sustained unstable pertrochanteric hip fractures from July 2015 to June 2016. Of the 107 patients, 58 patients had both anteroposterior (AP) and lateral hip radiographs and computed tomography (CT) scans of the proximal femur, and these 58 patients were included in the study. All patients included in the study met the following criteria: all patients were 60 years or older; the patients were living at home before their injury; the hip fractures of were non-pathologic in origin; patients were ambulatory without the need for walking assistance or walking devices before fracture; the patients had no cognitive impairment; follow-up at was for at least six months; the Arbeitsgemeinschaft für Osteosynthesefragen and Orthopedic Trauma Association (AO/OTA) classification fracture type was 31A2 (Figure 1) [2].
Figure 1.
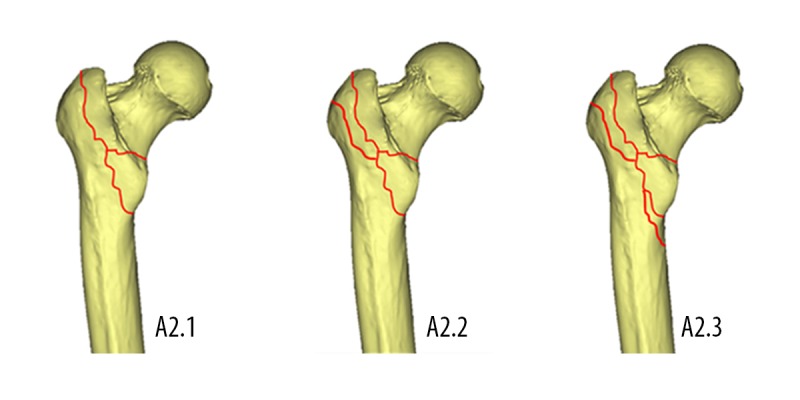
Subgroups of 31A2 pertrochanteric fractures on three-dimensional computed tomography (3-D CT) reconstruction A2.1, detachment of the lesser trochanter (LT); A2.2, several intermediate fragments including the detachment of the LT; A2.3, several intermediate fragments extending more than 1 cm distal to the LT.
Classification and modeling method
Two orthopedic senior residents and one consultant performed the radiographic classification, according to the 2007 AO/OTA classification guidelines, using the anteroposterior (AP) view at the time of initial presentation. In cases of disagreement, a consensus among the evaluators was reached through discussion.
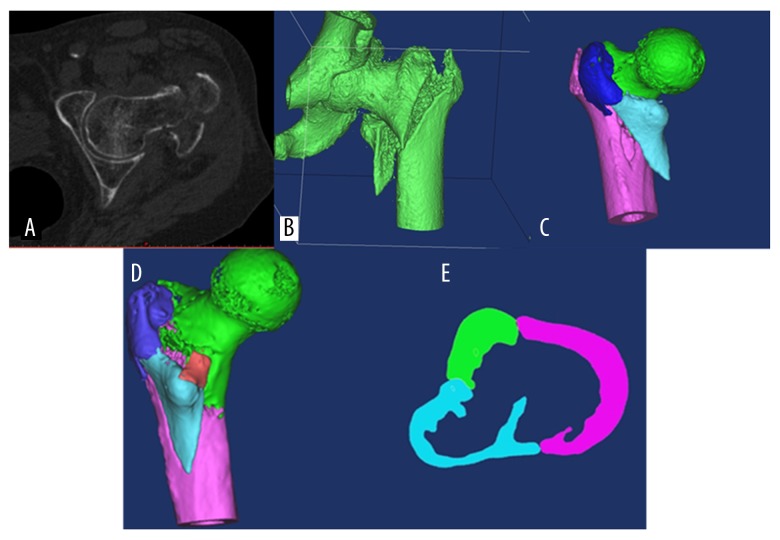
The CT data of patients included in the study were stored using the Digital Imaging and Communications in Medicine (DICOM) system and were imported into the Mimics17.0 software (Marshall, Belgium). The cortical threshold was selected and the proximal femoral models were divided into independent fragments so that each fracture fragment had independent properties. By rotation and translation, the displaced fragments were reduced (Figure 2). On the reduced 3-D CT images, the fractures were subclassified according to AO/OTA classification system. If there was a disagreement, consensus among the evaluators was reached through discussion.
Figure 2.
Data from three-dimensional computed tomography (3-D CT) reconstruction. (A) Three-dimensional computed tomography (3-D CT) reconstruction of an A2.3 fracture was imported into the Mimics17.0 software. (B) The cortical threshold was selected and fracture segments reconstructed. (C) The proximal femoral fragment model was divided into independent fragments and each fragment had independent properties. (D) By rotation and translation, the fragments were reduced. (E) To give a better representation of the lesser trochanter posterior (LTP) fragment, and the lesser trochanter medial (LTM) fragment, the 3-D CT image section at the mid-level of the lesser trochanter (LT), and the thick anteromedial cortex remained.
Imaging parameters
In this study, the lesser trochanter (LT) fragments were defined. The fragment that included the greater trochanter was termed the GT fragment, and the fragment that included the intertrochanteric crest was termed crest fragment. The incidence of the associated fragment, their shape, and number (single fragments or multiple fragments) were assessed on 3-D CT imaging. Morphological characteristics of the LT fragment were measured on reduced 3-D fracture models. All the parameters were measured using Mimics17.0 software (Materialise, Leuven, Belgium).
Figure 3 illustrates that to provide a better representation, 3-D CT reconstruction of the lesser trochanter posterior cortical extension (LTPE) fragment identified the following important morphological imaging landmarks and measurements. The LTPE fragment was measured from the tip of the LT to the lateral margin of the LT fragment (Figure 3A). The width of the posterior wall (WPW) was measured from the tip of the LT to the lateral raphé (Figure 3A). The LT accounted for a portion of the posterior wall (LTPE%) defined as LTPE divided by WPW. The medial cortical extension of the LT (LTME) fragment was measured from the tip of the LT to the medial margin of the LT fragment (Figure 3A). The width of the medial wall (WMW) was measured from the tip of the LT to the junction of the anterior and medial cortex. The LT fragment accounted for a portion of the medial wall (LTWE%) defined as LTWE divided by WMW. The width of the LT fragment (WLT) was defined as the LTPE plus the LTME (Figure 3A). The LT fragment accounted for a portion of the whole circumference of the femur cortex (WLT%), defined as WLT divided by the whole circumference of the femoral cortex (WCFC).
Figure 3.
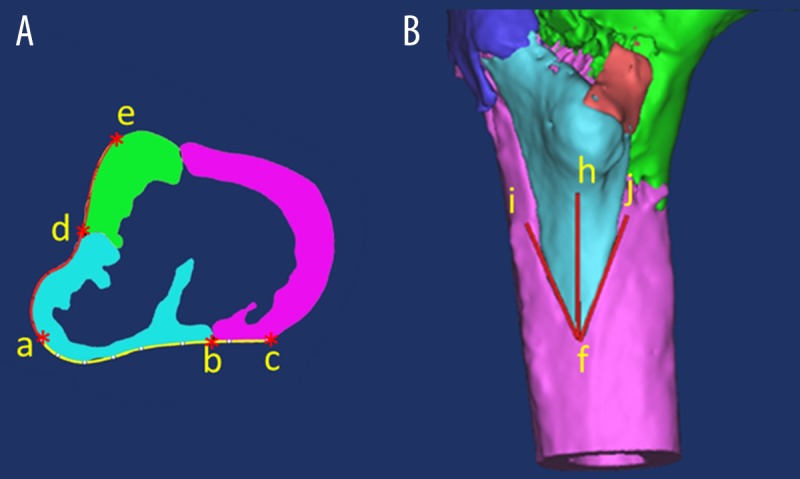
Three-dimensional computed tomography (3-D CT) reconstruction of the lesser trochanter posterior cortical extension (LTPE) fragment. The posterior cortical extension of the lesser trochanter fragment (LTPE) was measured from the tip (point a) of the LT to the lateral margin of the LT fragment (A, curved line ab). The width of the posterior wall (WPW) was measured from the tip of the LT to the lateral raphé (A, curved line ac). The medial cortical extension of the LT (LTME) fragment was measured from the tip of the LT to the medial margin of the LT fragment (A, curved line ad). The width of the medial wall (WMW) was measured from the tip of the LT to the junction of the anterior and medial cortex (A, curved line ae). The distal cortical extension of the LT (LTDE) fragment was measured from the tip (point f) of the LT fragment to the bottom edge of the LT (B, red line fh). The distal spike angle of the LT (LTDA) fragment was measured as the angle formed by the extension of the two LT fracture lines to the distal femur (B, the angle ifh formed by line if and jf).
The superior, medial and posterior views of the 3-D CT images were assessed for the distal cortical extension of the LT (LTDE) fragment, which was measured from the tip of the lesser trochanteric fragment to the bottom edge of the LT (Figure 3B). The distal spike angle of the LT (LTDA) fragment was measured as the angle formed by the extension of the two LT fracture lines to the distal femur (Figure 3B).
All patients were treated with a helical blade cephalomedullary nail (CMN) system (DePuy Synthes, PFNA, Asia) after obtaining a good reduction, as described by Baumgaertner et al. [7].
Assessment of clinical outcome
The degree of fracture collapse was used to evaluate the clinical outcome in this study because instability has been defined as a tendency to collapse even after good reduction and fixation [8,9]. The degree of fracture and bone collapse was determined by comparing the immediate postoperative AP radiograph and the latest AP radiograph and was measured according to the method described by Crosby et al. [10]. Ambulatory status before the hip fracture and at the last follow-up visit were assessed using Parker-Palmer (P-P) mobility scores ranging from 0–9, where 9 represented full mobility indoors and outdoors without walking aids, and 0 represented a bed-bound patient [11].
Statistical analysis
The mean ± standard deviation (SD) of the parameters of each group were calculated by descriptive analysis. The Mann-Whitney U test was used to compare differences between the parameters, including age, body mass index (BMI), American Society of Anesthesiologists (ASA) score, LTPE, WPW, LTPE%, LTME, WMW, LTME%, WLT, WCFC, WLT%, LTDE, LTDA, measurement of fracture collapse, and P-P mobility score mobility score of the different subgroups. A P-value <0.05 was considered to be statistically significant. All calculations were performed by SPSS statistical software version 19.0 (SPSS Inc. Chicago, IL, USA).
Results
Classification of the morphological characteristics of the lesser trochanter (LT) fragments using X-ray imaging and three-dimensional computed tomography (3-D CT)
The demographic features of the 58 cases of 31A2 type unstable pertrochanteric fractures are summarized in Table 1. According to the 2007 Arbeitsgemeinschaft für Osteosynthesefragen and Orthopedic Trauma Association (AO/OTA) classification using X-ray plain film radiographs, there were nine cases of A2.1, 17 cases of A2.2, and 32 cases of A2.3 unstable pertrochanteric fractures of 31A2 type. Following three-dimensional computed tomography (3-D CT) images, the cases were reclassified and four cases of A2.1 on X-ray were changed to A2.2 (Figure 4), 5 cases of A2.1 on X-ray were changed to A2.3. There were 21 cases classified as group A2.2, 37 cases were classified as group 31A2.3, and there were no cases of A2.1 type unstable pertrochanteric fractures (Table 1).
Table 1.
Patient demographics.
| Variable | 31A2, N=58 | 31A2.2, n=21 | 31A2.3, n=37 | p Value |
|---|---|---|---|---|
| Male: Female | 22/36 | 6/15 | 16/21 | .443 |
| Age | 81.0±10.6 | 83.3±8.6 | 79.3±12.6 | .561 |
| BMI | 23.4±2.9 | 23.6±2.7 | 23.2±3.0 | .713 |
| ASA score | 2.1±0.9 | 2.1±1.0 | 2.1±0.8 | .538 |
Figure 4.
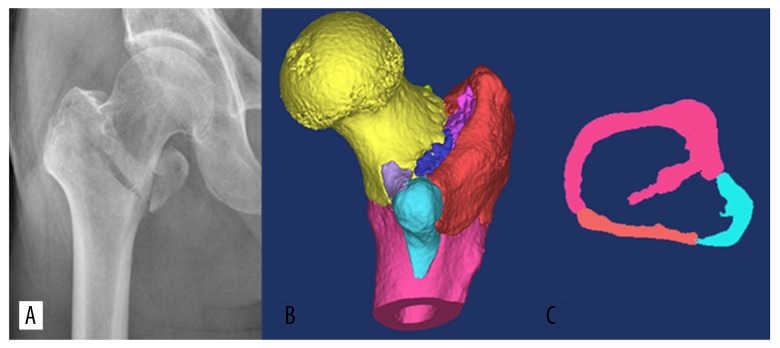
Classification of the 31A2 fracture on X-ray. According to the X-ray appearance, this 31A2 fracture classification includes the 31A2.1 subgroup (A). On the three-dimensional (3-D) image of the fracture, there are more than one intermediate fragments. The 31A2 fracture can be further classified into the 31A2.2 subgroup (B), and the thick anteromedial cortex remained (C).
Incidence and shape of the associated fragments
On 3-D CT reconstruction imaging, a greater trochanter fragment was identified in 56 cases (96.6%), and a crest fragment was identified in all 58 cases (Figures 4, 5). Only two fractures in group 31A2.3 had an LT fragment and crest fragment without injury of the greater trochanter (Figure 5A). In four cases (6.9%) of A2 fractures, there was a large posteromedial fragment that included the LT fragment, and a posterior greater trochanter and crest in continuity (curved shape, Figure 5B), the four fractures were classified into subtype A2.3 because of the distal extension exceeded 1 cm from the lower edge of the LT. In the other 52 fractures (89.7%), the posteromedial fragment consisted of more than two independent fragments including the LT fragment, the greater trochanter fragment or the crest fragment (Table 2).
Figure 5.
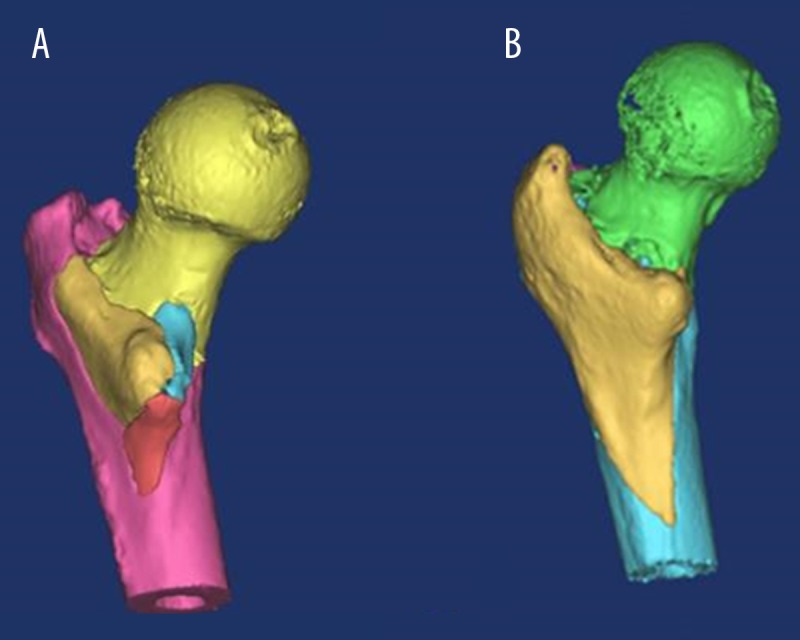
Three-dimensional computed tomography (3-D CT) reconstruction of the posterior cortical extension of the lesser trochanter (LTPE) fragment. Three-dimensional computed tomography (3-D CT) reconstruction of the 31A2.3 shows several intermediate fragments with an intact greater trochanter (A). 3-D CT images of 31A2.3, which has the LT and greater trochanter and crest in continuity. The tip of the LT fragment is long and sharp (B).
Table 2.
Incidence and shape of associated fragments.
| Group | Incidence of associated fragments | Shape of associated fragments | ||
|---|---|---|---|---|
| GT fragment | Crest fragment | Single fragment | Multi-fragment | |
| A2 (N =58) | 56 (96.6%) | 58 (100.0%) | 4 | 54 |
| A2.2 (N=21) | 21 (36.2%) | 21 (36.2%) | 0 | 21 |
| A2.3 (N=37) | 35 (60.4%) | 37 (63.8%) | 4 | 33 |
Single fragment − LT + GT+ Crest in continuity; Multi-fragment – LT, GT and Crest separated.
Morphology of the lesser trochanteric (LT) fragment subgroups in the posterior cortical extension (LTPE), A2.3 and A2.2
At the mid-level of the LT, the mean width of the posterior wall was 41.7 mm. The LT fragment extended posteriorly (mean, 33.5 mm), which accounted for 81% of the width of the posterior wall. The mean width of the medial wall was 33.5 mm, and the LT fragment extended medially for 19.0 mm, which accounted for 57% of the width of the medial wall. The width of the LT fragment was 52.5 mm and accounted for 39% of the whole circumference of the cortex of the femur (mean, 136.3 mm). The mean distal spike angle of the LT fragment was 62.6 degrees, with a mean distal cortical extension of 14.5 mm of the femoral shaft (Table 3).
Table 3.
Comparison of two groups in morphology characteristics of lesser trochanter fragment and clinical outcome.
| Variable | 31A2, N=58 (Mean and SD) | 31A2.2, n=21 (Mean and SD) | 31A2.3, n=37 (Mean and SD) | p Value |
|---|---|---|---|---|
| LTPE, mm | 33.5±9.8 | 29.1±7.8 | 36.0±10.1 | .004 |
| WPW, mm | 41.7±5.2 | 41.3±5.7 | 41.9±5.0 | .437 |
| LTPE% | 81±23 | 71±21 | 87± 23 | .013 |
| LTME, mm | 19.0±5.9 | 16.4±7.6 | 20.5±4.0 | .092 |
| WMW, mm | 33.5±4.4 | 33.2±4.7 | 33.7±4.3 | .929 |
| LTME% | 57±15 | 49±20 | 61± 8 | .031 |
| WLT | 52.5±12.1 | 45.5±11.6 | 56.5±10.6 | .001 |
| WCFC, mm | 136.3±13.0 | 134.3±14.3 | 137.5±12.3 | .207 |
| WLT% | 39±8 | 34±8 | 41±7 | .001 |
| LTDE, mm | 14.5±11.2 | 2.8 ±3.6 | 21.2±8.0 | .000 |
| LTDA, degree | 62.6±29.8 | 94.0±23.7 | 44.7±13.9 | .000 |
| Fracture collapse, mm | 5.2±2.1 | 4.7±1.5 | 5.4±2.4 | 0.311 |
| Preinjury P-P mobility score | 7.3±1.2 | 7.3±1.1 | 7.3±1.2 | 0.900 |
| Fracture union time, month | 4.0±0.6 | 4.1±0.7 | 4.0±0.6 | 0.674 |
| P-P mobility score of last follow-up | 7.1±1.0 | 7.2±1.1 | 7.1±1.0 | 0.872 |
The level of significance was set at p<0.05 (2-tailed). SD – standard deviation; LTPE – posterior cortical extension of the lesser trochanter fragment; WPW – width of the posterior wall; LTPE% – lesser trochanter fragment occupied portion of the posterior wall; LTME – medial cortical extension of the lesser trochanter fragment; WMW – width of the medial wall; LTME% – lesser trochanter fragment occupied portion of medial wall; WLT – width of lesser trochanter fragment; WCFC – whole circumference of the femur cortex; WLT% – lesser trochanter fragment accounted for portion of the whole circumference of the femur; LTDE – distal cortical extension of lesser trochanteric fragment; LTDA – distal spike angle of lesser trochanter fragment.
When the subgroups were compared, at the mid-level of the LT, the LT fragment in the A2.3 subgroup had a larger LT posterior cortical extension (LTPE) and accounted for a larger proportion of the posterior wall than in A2.2 subgroup (36.0 mm vs. 29.1 mm; 87% vs. 71%), a larger medial cortical extension accounted for a larger proportion of the medial wall (20.5 mm vs. 16.4 mm; 61% vs. 49%), and accounted for larger proportion of the whole circumference of the cortex of the femur (41% vs. 34%). The LT fragment in A2.3 subgroup compared with A2.2 subgroup had a sharper distal spike angle (44.7° vs. 94.0°) and a larger distal cortical extension (21.2 mm vs. 2.8 mm) (Table 3).
Following analysis using the Mann-Whitney U test, the differences between the two subgroups in the (LTPE) accounted for a significant proportion of the posterior wall, a proportion of the medial wall, the width of the LT fragment, and accounted for a proportion of the whole circumference of the cortex, the distal spike angle, and the distal cortical extension. There was no significant difference in other variables including age, gender, and previous injury, the Parker-Palmer (P-P) mobility score, medial cortical extension, the width of the posterior wall, the width of the medial wall, and the whole circumference of the femoral cortex (Table 3).
Fracture collapse and ambulatory status
Fracture union was achieved in all patients. The mean fracture union time was 4.1 months for A2.2 fractures and 4.0 months for A2.3 fractures (p=0.674). The mean amount of fracture collapse was 4.7 mm in A2.2 fractures and 5.4 mm in A2.3 fractures (p=0.311). The mean P-P mobility score at last follow-up was 7.2 in A2.2 fractures and 7.1 in A2.3 fractures (p=0.872). None of the patients had implant-related complications that were severe enough to require repeat surgery (Table 3).
Discussion
This aims of this study were to investigate the morphological characteristics of the lesser trochanter (LT) fragment using three-dimensional computed tomography (3-D CT) reconstruction and to compare clinical outcomes in different subgroups of 31A2 fractures. Comparison of the subgroups showed that the LT fragment of A2.3 had a larger cortical extension in the posterior, medial, and the distal cortex, but despite the increased size of the LT fragment in subtype A2.3 fracture compared with subtype A2.2 fracture, this did not influence the clinical outcome.
In 1949, Evans [12] first described the LT fragment as a medial fragment in the classification of pertrochanteric and inter-trochanteric hip fractures and found that approximately two-thirds of the LT fragments could result in medial instability of the pertrochanteric fracture. Since this first description, the existence of the LT fragment in pertrochanteric fractures has been regarded as an indicator of hip fracture instability [2,13,14]. However, the morphology of the LT fragment has not been described in detail. Daphne et al. [15] reported the LT fragment had a mean area of 7.4±5.2 cm2, with a range of 1.3–29.6 cm2 on the anteroposterior (AP) radiograph. Sharma et al. [16] first measured the size of the posteromedial fragments on 3-D CT reconstruction and reported that the LT fragment in the A2 fracture type involved 74% of the posterior wall and 36% of the medial wall of the proximal femur. In the present study, the size of the LT fragments in the subtypes of 31A2 fractures was further measured on 3-D CT reconstruction using a virtual reduction technique. Using Mimics17.0 software, the displacement and rotation of the fragments were eliminated, which improved the accuracy of morphological measurements.
In this study, 56/58 (96.6%) of the A2 fractures had a greater trochanter fragment and all A2 fractures had crest fragments, and the LT fragments created 49% of the defects of the medial cortex in A2.2 fractures and 61% in A2.3 fractures. This finding is different to the previously reported findings in A2 fracture models in biomechanical studies in which an LT fragment created a complete defect of the medial cortex, with an intact greater trochanter and crest [5,6,17]. Therefore, it might be possible to improve the accuracy of simulated results if, on the removal of the LT, the posterior greater trochanter and the crest are also removed when creating biomechanical models of A2 fracture, and the anterior half of the medial cortex should remain.
Conventionally, when choosing the optimal internal fixation method for intertrochanteric fractures, orthopedic surgeons categorize the fractures into simple intertrochanteric fractures (A1 to A2.1) and ensure a safe lateral wall, because an intact greater trochanter should be treated with sliding hip screws (SHSs). However, complex intertrochanteric fractures (A2.2 to A3), which have a fragile lateral wall due to fracture of the greater trochanter should not be treated with SHS alone because of the high risk of lateral wall fracture [18]. However, all A2.1 fractures in this study that had a single LT fragment on AP plain radiographs also had a greater trochanter fragment and crest fragment on 3-D CT images (Figure 4A, 4B), while 2 cases (5.4%) of A2.3 fractures had an intact greater trochanter fragment (Figure 5A). These findings mean that when using SHSs during fracture surgery, the A2.1 fractures, which were thought to have a safe lateral wall might be susceptible to lateral wall fracture. However, the A2.3 fractures, which were thought to have a dangerous lateral wall could be treated with SHSs without lateral wall fracture, and at a much lower cost. This finding supports that making the choice of fixation for A2 fracture according to subgroup classification alone might be an unreliable approach for orthopedic surgeons.
In a previously published retrospective study, Hsu et al. [19] introduced the concept of lateral wall thickness (LWT), which was defined as the distance from a reference point 3 cm below the innominate tubercle of the greater trochanter, angled at 135° upward to the fracture line on anteroposterior radiographs. This study also showed that the LWT was a reliable predictor of lateral wall fracture and the authors concluded that intertrochanteric fractures with a LWT <20.5 mm should not be treated with SHS alone because of the high rate of lateral wall fracture [19]. In order to choose both safe and cost-effective fixation, we recommend that not only the subgroup classification but also the lateral wall thickness should be considered when treating A2 fractures.
Marmor et al. [6] compared the biomechanical stability of A2 fractures when the LT fragment created a posterior incomplete defect (posteromedial) and a complete defect (both posteromedial and anteromedial) of the medial cortex. The authors found that the posteromedial defect did not significantly change load-bearing by the implants, only when the anteromedial hemi-osteotomy was added, did the load bearing by the implant increase [6]. In the present study, although the LT fragments in A2.3 fractures created a larger defect of the medial cortex than in A2.2 fractures (49% vs. 61%), most of the thickness of the anteromedial cortex remained in both of the two group (Figures 4, 5). After appropriate reduction and fixation, the anteromedial cortex of the medial wall can make contact with the anteromedial cortex of femoral head and neck. This anteromedial cortex to cortex contact can not only bear a medial load but also resists excessive sliding, varus angulation of the femoral head and neck fragment, and retroversion, which might explain why the larger size of the LT fragment did not result in significantly increased fracture collapse of subtype A2 fractures.
This study had several limitations. First, the sample size of the study was small. Second, the additional radiation exposure of CT scan and the additional cost of CT scans are limitations to widespread clinical suitability of evaluating all pertrochanteric fractures of the femur with 3-D CT imaging. Third, this study focused on the evaluation of the morphology of LT fragments in A2 fractures using 3-D CT imaging, and patients with A1 and A3 fractures were not included in this study, and the 3-D morphology of 31A1 and A3 fractures was not evaluated. Further studies that include a larger study size and the evaluation of the morphology of more subtypes of pertrochanteric fractures of the femur should be undertaken.
Conclusions
Following unstable pertrochanteric hip fractures, three-dimensional computed tomography (3-D CT) reconstruction of the morphology of the lesser trochanter (LT) fragment provided a better understanding of each subgroup of 31A2 pertrochanteric fracture and their characteristics. The morphology of the LT fragment may help to improve the accuracy of creating A2 fracture models, but may also guide implant choice. Despite the larger size of the LT fragment in A2.3 subtype fracture compared with A2.2 subtype fracture, the findings of this study showed that this did not influence the clinical outcome.
Footnotes
Source of support: The study was supported by funding from the National Nature Science Foundation of China (NSFC No. 81772323) and (NSFC No. 81873989)
References
- 1.Mann E, Icks A, Haastert B, Meyer G. Hip fracture incidence in the elderly in Austria: An epidemiological study covering the years 1994 to 2006. BMC Geriatrics. 2008;8:35. doi: 10.1186/1471-2318-8-35. [DOI] [PMC free article] [PubMed] [Google Scholar]
- 2.Marsh JL, Slongo TF, Agel J, et al. Fracture and dislocation classification compendium: Orthopaedic Trauma Association Classification, Database and Outcomes Committee. J Orthop Trauma. 2007;21(Suppl 10):S1–163. doi: 10.1097/00005131-200711101-00001. [DOI] [PubMed] [Google Scholar]
- 3.Baird RP, O’Brien P, Cruickshank D. Comparison of stable and unstable pertrochanteric femur fractures managed with 2- and 4-hole side plates. Can J Surg. 2014;57(5):327–30. doi: 10.1503/cjs.026113. [DOI] [PMC free article] [PubMed] [Google Scholar]
- 4.Palm H, Posner E, Ahlertoftehøj HU, et al. High reliability of an algorithm for choice of implants in hip fracture patients. Int Orthop. 2013;37:1121–26. doi: 10.1007/s00264-013-1831-7. [DOI] [PMC free article] [PubMed] [Google Scholar]
- 5.Do JH, Kim YS, Lee SJ, et al. Influence of fragment volume on stability of 3-part intertrochanteric fracture of the femur: A biomechanical study. Eur J Orthop Surg Traumatol. 2013;23:371–77. doi: 10.1007/s00590-012-0983-2. [DOI] [PubMed] [Google Scholar]
- 6.Marmor M, Liddle K, Pekmezci M, et al. The effect of fracture pattern stability on implant loading in OTA type 31A2 proximal femur fractures. J Orthop Trauma. 2013;27:683–89. doi: 10.1097/BOT.0b013e31828bacb4. [DOI] [PubMed] [Google Scholar]
- 7.Baumgaertner MR, Curtin SL, Lindskog DM, Keggi JM. The value of the tip-apex distance in predicting failure of fixation of peritrochanteric fractures of the hip. J Bone Joint Surg Am. 1995;78:1447–48. doi: 10.2106/00004623-199507000-00012. [DOI] [PubMed] [Google Scholar]
- 8.Fang C, Gudushauri P, Wong TM, et al. Increased fracture collapse after intertrochanteric fractures treated by the dynamic hip screw adversely affects walking ability but not survival. Biomed Res Int. 2016;2016 doi: 10.1155/2016/4175092. 4175092. [DOI] [PMC free article] [PubMed] [Google Scholar]
- 9.Reindl R, Harvey EJ, Berry GK, Rahme E Canadian Orthopaedic Trauma Society. Intramedullary versus extramedullary fixation for unstable intertrochanteric fractures: A prospective randomized controlled trial. J Bone Joint Surg Am. 2015;97:1905–12. doi: 10.2106/JBJS.N.01007. [DOI] [PubMed] [Google Scholar]
- 10.Crosby JM, Parker MJ. Femoral neck collapse after internal fixation of an intracapsular hip fracture: Does it indicate a poor outcome? Injury. 2016;47(12):2760–63. doi: 10.1016/j.injury.2016.10.021. [DOI] [PubMed] [Google Scholar]
- 11.Parker MJ, Palmer CR. A new mobility score for predicting mortality after hip fracture. J Bone Joint Surg Br. 1993;75:797–98. doi: 10.1302/0301-620X.75B5.8376443. [DOI] [PubMed] [Google Scholar]
- 12.Evans EM. The treatment of trochanteric fractures of the femur. J Bone Joint Surg Br. 1949;31B:190. [PubMed] [Google Scholar]
- 13.Müller ME. [Classification and international AO-documentation of femur fractures]. Unfallheilkunde. 1980;83:251–59. [in German] [PubMed] [Google Scholar]
- 14.Jensen JS, Michaelsen M. Trochanteric femoral fractures treated with McLaughlin osteosynthesis. Acta Orthopaedica Scandinavica. 1975;46:795–803. doi: 10.3109/17453677508989266. [DOI] [PubMed] [Google Scholar]
- 15.van Embden D, Gaston MS, Bailey LA, Simpson AHRW. Trochanteric femoral fracture classification: Relevance of the fracture line angle, a radiological study. Int J Orthop. 2015;2(2):250–55. [Google Scholar]
- 16.Sharma G, Gn KK, Khatri K, et al. Morphology of the posteromedial fragment in pertrochanteric fractures: A three-dimensional computed tomography analysis. Injury. 2017;48:419–31. doi: 10.1016/j.injury.2016.11.010. [DOI] [PubMed] [Google Scholar]
- 17.Ehrnthaller C, Olivier AC, Gebhard F, Durselen L. The role of lesser trochanter fragment in unstable pertrochanteric A2 proximal femur fractures – is refixation of the lesser trochanter worth the effort? Clin Biomech (Bristol, Avon) 2016;42:31–37. doi: 10.1016/j.clinbiomech.2016.12.013. [DOI] [PubMed] [Google Scholar]
- 18.Palm H, Jacobsen S, Sonneholm S, Gebuhr P. Integrity of the lateral femoral wall in intertrochanteric hip fractures: an important predictor of a reoperation. J Bone Joint Surg Am. 2007;89:470–75. doi: 10.2106/JBJS.F.00679. [DOI] [PubMed] [Google Scholar]
- 19.Hsu CE, Shih CM, Wang CC, Huang KC. Lateral femoral wall thickness. A reliable predictor of post-operative lateral wall fracture in intertrochanteric fractures. Bone Joint J. 2013;95-B(8):1134–38. doi: 10.1302/0301-620X.95B8.31495. [DOI] [PubMed] [Google Scholar]


