

Abstract
Background and Aims:
Nonalcoholic fatty liver disease/nonalcoholic steatohepatitis (NAFLD/NASH) is an increasing clinical problem associated with progression to hepatocellular carcinoma (HCC). The effect of high fat diet on the early immune response in HCC is poorly understood. In addition, the role of metformin in treating NAFLD and HCC remains controversial. Here we visualized the early immune responses to the liver and the effect of metformin on progression of HCC using optically transparent zebrafish.
Methods:
We used live imaging to visualize liver inflammation and disease progression in a NAFLD/NASH-HCC zebrafish model. We combined a high fat diet (HFD) with a transgenic zebrafish HCC model induced by hepatocyte-specific activated beta-catenin and assessed liver size, angiogenesis, micronuclei formation and inflammation in the liver. In addition, we probed the effects of metformin on immune cell composition and early HCC progression.
Results:
We found that HFD induced an increase in liver size, enhanced angiogenesis, micronuclei formation and neutrophil infiltration in the liver. Although macrophage number was not affected by diet, high fat diet induced changes in macrophage morphology and polarization with an increase in liver associated TNFα positive-macrophages. Treatment with metformin altered macrophage polarization, reduced liver size and micronuclei formation in NAFLD/NASH-associated HCC larvae. Moreover, high fat diet reduced T cell density in the liver and this effect was rescued by treatment with metformin.
Conclusions:
These findings suggest that diet alters macrophage polarization and exacerbates the liver inflammatory microenvironment and cancer progression in a zebrafish model of NAFLD/NASH-associated HCC. Metformin specifically affects the progression induced by diet and modulates the immune response by affecting macrophage polarization and T cell infiltration, suggesting possible effects of metformin on tumor surveillance.
Lay Summary:
This paper reports a new zebrafish model to study the effects of diet on liver cancer. We found that high-fat diet promotes nonresolving inflammation in the liver and enhances cancer progression. In addition, we found that metformin, a drug used to treat diabetes, inhibits high fat diet-induced cancer progression in this model, by reducing diet-induced nonresolving inflammation and potentially restoring tumor surveillance.
Keywords: NAFLD/NASH, NAFLD-associated HCC, zebrafish model, High-fat diet, Metformin
Graphical Abstract

Introduction
Hepatocellular Carcinoma (HCC) is a common cause of cancer-related deaths with increasing mortality worldwide 1. In western societies, 30–40% of HCC patients are obese and have nonalcoholic steatohepatitis (NASH), an aggressive form of nonalcoholic fatty liver disease (NAFLD)2–5. Abnormal lipid accumulation in hepatocytes increases oxidative stress and leads to lipotoxicity, which triggers liver inflammation, a hallmark in NAFLD progression to HCC6. Pro-tumorigenic subsets of neutrophils, macrophages, and other immune cells provide the tumor microenvironment (TME) with growth factors, matrix-remodeling factors and inflammatory mediators that optimize tumor growth 7–10. Hepatic macrophages in particular, including both monocyte-derived or tissue-resident macrophages known as Kupffer cells, have been identified as potential drug targets to treat liver disease 11. Several studies have shown that NAFLD progression to HCC involves inflammatory macrophages12 and Kupffer cells 13. Adaptive immune cells can also be modulators of hepatocarcinogenesis. NAFLD/NASH impairs tumor surveillance by inducing apoptosis of CD4+ T cells 14. Taken together, this previous work suggests that the innate and adaptive immune systems are key players in the progression of NAFLD-associated HCC. However, the specific cellular and molecular immune mechanisms that regulate the pathogenesis of early NAFLD/NASH-associated HCC remain unclear.
Metformin is a well-tolerated drug commonly used to treat diabetes with some evidence suggesting beneficial effects in HCC and other types of cancer15. In hepatocytes, metformin increases AMPK activity 16, and also decreases gluconeogenesis and increases fatty acid oxidation17, supporting its use in NAFLD18. The role of metformin in treating HCC remains controversial19, although its use is supported by some in vitro, ex vivo and xenotransplant mouse models20, 21. However, the effect of metformin on the TME immune composition or HCC progression in vivo remains unclear.
To image the immune response and liver tumorigenesis in live intact animals, we developed a zebrafish model of NASH-associated HCC. Here we combine a high fat diet (HFD) with an established transgenic zebrafish model of HCC22. Zebrafish have remarkable similarities to humans, including hepatic cellular composition, function, signaling, and response to injury 23. We found that HFD enhances HCC progression and modulates the immune response in the liver TME. HFD induces changes in macrophage polarization with increased numbers of TNFα-positive macrophages in the liver. Metformin blocks the effects of high fat diet on the inflammatory microenvironment and HCC progression. Moreover, the findings suggest that metformin inhibits HCC progression specifically in NASH-associated HCC by reducing diet-induced liver inflammation and potentially restoring tumor T cell surveillance.
Materials and Methods
Zebrafish husbandry and maintenance
All protocols using zebrafish in this study were approved by the University of Wisconsin-Madison Institutional Animal Care and Use Committee (IACUC). Adult zebrafish and embryos up to 5 days post-fertilization (dpf) were maintained as described previously 24. At 5 dpf, larvae were transferred to feeding containers and kept in E3 media without methylene blue. For all experiments, larvae were anesthetized in E3 media without methylene blue containing 0.16 mg/ml Tricaine (MS222/ethyl 3-aminobenzoate; Sigma-Aldrich). Zebrafish lines used are summarized in Supplemental Table 1.
Diet preparation and feeding of zebrafish larvae
Larval diets were prepared as previously described 25 using Golden Pearl Diet 5–50nm - Active Spheres. At 5 dpf, zebrafish larvae were separated into treatment groups in E3 without methylene blue. According to the number of larvae, larvae were maintained in a 15cm petri dish (up to 20 larvae), a small breeding box (20–75 larvae) or a big breeding box (75-up to 150 larvae), and fed for 8 days with ND or HFD (with 2mg, 4.5mg or 6–8mg daily, respectively), E3 was replaced daily. Before any experimental procedure, larvae were fasted for 24 hours. At 13 dpf, larvae were prescreened for HCC (Green Eye marker) or No HCC, and/or liver marker (Green Liver or Red Liver markers) on Zeiss Axio Zoom stereo microscope (EMS3/SyCoP3; Zeiss; Zeiss; PlanNeoFluar Z 1X:0.25 FWD 56mm lens).
Statistical analysis
All experiments were replicated independently a minimum of 3 times with multiple samples in each replicate. Least Squared Means analysis in R (www.r-project.org) 26 was performed on pooled replicate experiments, using Tukey method when comparing more than two treatments. This analysis method was used in all experiments with the exception of Lipid, Glycogen, micronuclei scorings and steatosis, for which we used Chi-Square test. Statistical analysis was performed with the assistance of a Biostatistician in the Department of Pediatrics at the University of Wisconsin-Madison. Graphical representations were done in GraphPad Prism version 7.
Other methods and reagents
Other methods are described in Supplementary Material and Methods. To enhance the reproducibility of all the methods used in this study a Supplementary CTAT Table is also provided as supplementary data.
Results
High fat diet and HCC increase liver size and induce angiogenesis during early progression in a zebrafish HCC model
Zebrafish is a powerful model organism for liver disease research, including NAFLD and HCC 23. Here we used a HCC transgenic zebrafish model that expresses hepatocyte-specific activated β-catenin (Tg (fabp10a:pt-β-cat))22. We focused our study on the early progression phase of HCC and used 13 days post-fertilization (dpf) Tg (fabp10a:pt-β-cat) larvae, with or without a liver marker, Tg(fabp10a:egfp) or Tg(fabp10a:h2bmCherry), referred to here as HCC larvae (Suppl. Table 1). In addition, to induce NAFLD in zebrafish 25, 27, we fed wild type larvae a high-cholesterol diet, here after referred as high fat diet (HFD), from days 5–1225. Oil red staining showed that the short term feeding of a HFD was able to induce steatosis in the liver of 13dpf larvae (Suppl.Fig.1). Liver size was increased both in the HCC model and with a HFD alone (Suppl.Fig.2A-C; Fig.1A and C); importantly these effects were not associated with changes in total body size (Suppl.Fig.3A-C).
Figure 1: Angiogenesis and changes in cell and nuclear morphology are induced by both high fat diet and HCC.

(A, B) Representative 3D reconstructions of liver with blood vessels (A) or blood vessels alone (B) in control, HCC and HFD 13-day old larvae. (C) Graph showing liver volume in control, HCC and HFD larvae (Control= 15, HCC=27, HFD=26). (D) Graph showing vessel density index by liver volume in control, HCC and HFD larvae (Control= 15, HCC=27, HFD=26). Scale bar= 40μm. (E, F) Representative images of F-actin (E) and hepatocyte nuclei (F) in control, HCC and HFD larvae. In HCC: white arrow shows trinucleated cell; open arrowhead shows enlarged nuclei; white arrowhead shows nucleus with altered shape; red arrowhead shows micronuclei. In HFD: dashed arrowhead shows hepatocyte displaced nuclei toward the cell edge. (G-J) Graphs showing averages of cell and nuclear parameters in control, HCC and HFD 13-day old larvae. (G) Hepatocyte area. (H) Nuclear area. (I) Nuclear circularity. (J) Nuclear:Cytoplasm ratio. Measures were done in hepatocytes of control, HCC and HFD larvae (15–30 cells/ larvae; C N=8, HCC N= 8, HFD=11). (K) Chi-square graphs showing percentage of larvae with different scoring of Micronuclei and Nuclear herniation (C N=16, HCC N=23, HFD=23). Scale bar 5μm. All data are from at least three independent experimental replicates. LS-Means analysis in R, was performed in all data with exception of micronuclei scoring (K) that was analyzed with Chi-square test. Dot plots and Bar plots show mean ±SEM, significant p values are shown in each graph.
Increased angiogenesis is an important feature of HCC progression28, and it has also been associated with NAFLD progression in mouse models after long periods of feeding29–31. We therefore characterized the vasculature in the liver using an established transgenic line that labels the vasculature,Tg (flk:mcherry) (Suppl. Table 1). HCC larvae exhibited increased vessel density index by liver volume and liver surface area as compared to control siblings (Fig.1A, B and D; Suppl.Fig.2D; Movie S1 and S3). Surprisingly, larvae fed with a HFD also showed increased vessel density index by liver volume and liver surface area after only short-term feeding (Fig.1A, B and D; Suppl.Fig.2D; Movie S1 and S2), suggesting that diet alone is sufficient to induce angiogenesis after short durations in zebrafish larvae.
Histologic changes with high fat diet and HCC
Both HCC and a high cholesterol diet induce histologic changes in the liver in zebrafish 22, 27, 32. To determine if the characteristic histological changes are present during the larval period, we first performed a blinded, conventional histopathological evaluation of hematoxylin and eosin-stained sections in 13 dpf larvae (Suppl.Fig.4). We performed semiquantitative analysis of lipid accumulation and non-lipid vacuolar change (glycogen accumulation/ballooning degeneration), which are histologic features associated with NASH, and found that these features were more pronounced in larvae fed with HFD (Suppl.Fig.4A-D). HCC larvae displayed histologic characteristics of hepatocellular carcinoma, including altered tissue architecture (such as thickened hepatic cords), increased nuclear pleomorphism, and increased mitotic index (Suppl.Fig.4A,B, D and E); such features were not found in control or with HFD alone. We next took advantage of the optical accessibility of zebrafish larvae to evaluate several cellular and nuclear parameters associated with malignancy using non-invasive imaging techniques. We outcrossed a transgenic line with labeled hepatic nuclei,Tg(fabp10a:pt-β-catenin)/(fabp10a:h2b-mCherry), with a line that labels F-actin specifically in hepatocytes, Tg(fabp10a:lifeact-egfp) (Suppl. Table 1). We measured hepatocyte area, nuclear area, nuclear circularity and nuclear cytoplasmic ratio (N:C ratio) (Fig.1E-J). In HCC larvae, we observed an increase in hepatocyte area (Fig.1E and G). Nuclear alterations associated with carcinogenesis were also observed, such as enlarged nuclei, measured by nuclear area, and altered nuclear shape, measured by nuclear circularity (Fig.1E, F, H and I). As expected, larvae exposed to HFD showed cell morphology changes characterized by a ballooning effect on hepatocytes, as indicated by increased hepatocyte area (Fig.1E and G). The short-term high fat feeding alone did not induce nuclear alterations (Fig.1E, F, H and I). However, we observed enlarged hepatocytes with displaced nuclei localized at the edge of the cell with HFD, as reported in NAFLD/NASH disease33 (Fig.1E). No significant changes were found in N:C ratio at this stage(Fig.1J). DNA damage is also a hallmark of carcinogenesis, which is usually associated with repeated rounds of nuclear envelope rupture and repair that promotes formation of micronuclei or nuclear herniation34. Using our zebrafish transgenic lines with the nuclear marker H2B-mCherry (Suppl. Table 1), we visualized the presence of micronuclei in live larvae in vivo. We found that both HCC and HFD both induced the presence of micronuclei and/or nuclear herniation, which was not found in control larvae (Fig.1F and K). Our findings suggest that HCC and HFD have distinct effects on histologic features, consistent with the changes noted in human disease.
NAFLD and HCC zebrafish models exhibit an early increase in leukocyte infiltration
Next, to address the inflammatory response in larvae with HCC or HFD alone, we used a double-labeled macrophage and neutrophil transgenic line (Tg(mfap4:tdTomato-caax)/(lyzc:bfp) (Suppl. Table 1). The translucency of zebrafish larvae enabled non-invasive time-lapse imaging of leukocytes in the liver area. Both HCC and HFD alone displayed a significant increase in macrophage density at 13 dpf (Fig. 2A,B and D; Movie S5-7). Hepatic macrophages were present in control larvae, and displayed crawling and patrolling both in the liver and the surrounding area that was increased in HCC (Movie S5 and S7). Macrophages in larvae fed with HFD displayed a more stationary phenotype than in control larvae (Movies S5 and S6). The diet also induced a rounder and larger macrophage morphology, not observed in control or HCC larvae (Fig. 2A, B and E; Movie S6 and S7). Neutrophil density was also increased in larvae with HCC and fed HFD compared to control siblings (Fig. 2A, C and F; Movie S5-7). These results demonstrate that short-term feeding of HFD induces a NASH-like phenotype in zebrafish. Altogether, our data suggest that liver inflammation is triggered early both in HCC and by HFD.
Figure 2: High fat diet and HCC alone induce innate immune cell recruitment to the liver.

(A-C) Representative 3D reconstructions of liver and leukocyte recruitment to liver area of control, HCC and HFD 13-day old larvae. (D) Graphs showing macrophage density in liver area in control, HCC and and HFD larvae (C N=30, HCC N= 43, HFD=30). (E) Graph showing ratio of round macrophages over total macrophages at liver area (Control= 10, HCC N= 11, HFD N= 14). (F) Graph showing neutrophil density in liver area in control, HCC and HFD larvae (C N=28, HCC N= 30, HFD=31). Scale bar= 40μm. All data plotted comprise at least three independent experimental replicates. LS-Means analysis in R was performed in all data. Dot plots show mean ±SEM, significant p values are shown in each graph.
High fat diet stimulates cancer progression in zebrafish HCC larvae
NAFLD and NASH can lead to the progression to HCC in humans 1. NASH-associated HCC incidence is increasing, however there is a lack of animal models amenable to live imaging and drug screening. Therefore, we combined two established zebrafish models for NASH and HCC, and developed a model of NASH-associated HCC by feeding HCC zebrafish larvae with a high fat diet (HCC+HFD larvae). We first addressed the diet effect on HCC progression by measuring liver size. In HCC larvae, HFD induced liver enlargement as measured by area, surface area and volume without affecting larval length, but significantly increasing larvae width (Fig. 3A, C and D; Suppl.Fig.2A and B; Suppl. Fig. 3A-C). Vessel formation was also increased in HCC+HFD larvae compared to HCC alone (Fig.3A, B, E and F; Movie S3 and 4). Importantly, histopathological analysis revealed that HCC larvae fed a HFD displayed features of both NAFLD and HCC (Suppl.Fig. 5A-F). HCC+HFD larvae also exhibited increased hepatocellular lipid and glycogen accumulation compared to HCC larvae (Suppl.Fig. 5A-D). The lipid accumulation translated into an increase of hepatocyte size in HCC+HFD larvae fed a HFD (Fig.3G and I). Although greater nuclear pleomorphism and a trend toward more trinucleated cells was noted in the HCC larvae fed a HFD, significant changes in trinucleated cell numbers and mitotic index was not observed in H&E analysis (Suppl.Fig.5A, B, E and F). However, in vivo imaging showed that HFD for a short duration is able to induce malignant cellular and nuclear changes during the early HCC progression phase. HCC+HFD larvae exhibited lower nuclear circularity, higher N:C ratio and more micronuclei and nuclear herniation compared to HCC larvae alone (Fig.3G, H, J- L). Together, these findings suggest that HFD enhances malignancy-related histologic and morphologic features in HCC larvae.
Figure 3: High fat diet enhances progression in HCC.
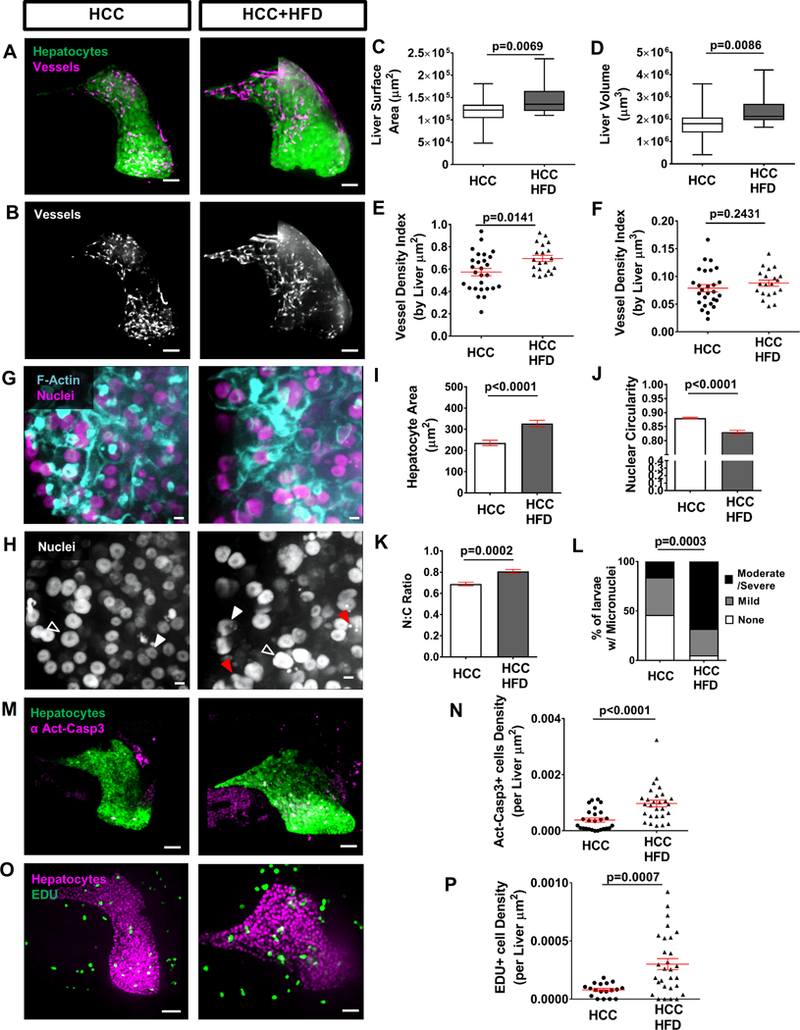
(A, B) Representative 3D reconstructions of livers and vessels in liver of 13-day old HCC and HCC+HFD larvae. Scale bar= 40μm. (C, D) Graphs showing liver surface area (C) and liver volume (D). (E, F) Graphs showing vessel density index by liver area (E) and vessel density index by liver volume (F) in HCC and HCC+HFD larvae (HCC N=27, HCC+HFD N= 20). (G, H) Representative 3D reconstructions of F-actin and hepatocyte nuclei in liver of in HCC and HCC+HFD larvae. Scale bar 5μm. Open arrowheads show enlarged nuclei; white arrowheads show nucleus with altered shape; and red arrows show micronuclei and nuclear herniation. Scale bar 5μm. (I-L) Graphs showing averages of cell and nuclear parameters in HCC and HCC+HFD 13-day old larvae. (I) Hepatocytes area. (J) Nuclear circularity. (K) Nuclear:Cytoplasm ratio. Measures were done in hepatocytes of HCC and HCC+HFD larvae (15–30 cells/ larvae; HCC N= 19, HCC+HFD N= 30). (L) Chi-square graphs showing percentage of larvae with different scoring of Micronuclei and Nuclear herniation (HCC N=23, HCC+HFD N=37). (M) Representative 3D reconstructions of liver and Active Caspase 3 in HCC and HCC+HFD larvae. Scale bar= 40μm. (N) Graph showing active-caspase 3 positive cells density in liver in HCC and HCC+HFD larvae (HCC N=26, HCC+HFD N= 28). Scale bar= 40μm. (O) Representative 3D reconstructions of liver and EDU in HCC and HCC+HFD larvae. (P) Graph showing EDU positive cells density in liver in HCC and HCC+HFD larvae (HCC N=18, HCC+HFD N= 29). All data are from at least three independent experimental replicates. LS-Means analysis in R, was performed in all data with exception of micronuclei scoring (L) that was analyzed with Chi-square test. Dot plots and Bar plots show mean ±SEM, significant p values are shown in each graph.
High fat diet increases proliferation and induces lipotoxicity in zebrafish HCC larvae
Lipid accumulation in hepatocytes mediates endoplasmic reticulum stress and mitochondrial dysfunction and triggers apoptosis6, 35. We next addressed the lipotoxic effect of the diet in HCC larvae by quantifiying apoptosis using whole-mount immunofluorescence against active-caspase 3 (Act-casp3). An increase in hepatic apoptosis was observed in HCC+HFD compared to HCC alone (Fig.3M and N). This lipotoxicity effect in the liver was accompanied by an increase in proliferation of HCC larvae fed with HFD measured by EDU incorporation (Fig.3O and P). Importantly, control larvae exposed to the diet also showed increased apoptosis and proliferation suggesting that these mechanisms are activated by the exposure of larvae to the HFD (Supp.Fig.6A and B).
NASH-associated HCC larvae display altered immune cell responses
We next sought to determine if a HFD alters the immune phenotype of HCC larvae. We found that macrophage influx in the liver was not affected by diet in HCC larvae (Fig.4A, B and D; Movie S7 and 8). However, there was a change in macrophage behavior and morphology, as it was previously observed in larvae fed HFD alone (Fig.2A, B and E; Movie S6). In HCC larvae, HFD induced a shift in behavior from the patrolling macrophages to a more stationary phenotype (Movie S7 and 8). The diet also induced a rounder and larger macrophage morphology (Fig.4A, B and E; Movie S8). As for neutrophils, neutrophil density was significantly increased with the diet (Fig.4A, C and F; Movie S8). Adaptive immune cells also play an important role in hepatocarcinogenesis 36, 37. To further characterize the immune response in this NASH-associated HCC model, we used a transgenic line with labeled T cells, Tg(cd4.1:mCherry)/(lck:egfp) to compare the effects of a conventional and high fat diet (Suppl. Table 1). Surprisingly, in HCC+HFD larvae, T cell density was reduced in the liver area in comparison to HCC siblings (Fig.4G and H). Interestingly, the same effect was observed in control larvae fed with this diet (Suppl.Fig.6C). Overall, these data show that the inflammatory response is triggered early in HCC, but when combined with a NAFLD model, the presence of lipid accumulation significantly alters the innate and adaptive immune response in the tumor microenvironment during the early progression phase of HCC in zebrafish.
Figure 4: HFD alters the innate and adaptive immune responses in zebrafish NASH-associated HCC.

(A-C) Representative 3D reconstructions of livers and leukocyte recruitment to liver area in 13-day old HCC and HCC+HFD larvae. (D) Graph showing macrophage density in liver area in HCC and HCC+HFD larvae (HCC N=43, HCC+HFD N= 40). (E) Graph showing ratio of round macrophages over total macrophages at liver area (HCC N= 11, HCC+HFD N= 13). (F) Graph showing neutrophil density in HCC and HCC+HFD larvae (HCC N=28, HCC+HFD N= 28). (G) Representative 3D reconstructions of T cell recruitment to liver area in HCC and HCC+HFD larvae. (H) Graph showing T cell density in liver area in HCC and HCC+HFD larvae (HCC N=14, HCC+HFD N= 32). Scale bar= 40μm. All data plotted comprise at least three independent experimental replicates. LS-Means analysis in R was performed in all data. Dot plots show mean ±SEM, significant p values are shown in each graph.
High fat diet induces pro-inflammatory macrophage polarization in zebrafish HCC
Live imaging revealed a change in macrophage morphology and dynamic behavior in HCC larvae in the presence of a HFD. Interestingly, we did not observe an increase in macrophage infiltration into the liver with a change in diet. To determine if this change in macrophage morphology is associated with altered polarization of the macrophages we utilized a reporter of TNFα expression,Tg(tnfa:egfp) (Suppl. Table 1), to identify pro-inflammatory macrophages in the liver. TNFα is an important marker of macrophage polarization to a pro-inflammatory phenotype, classically referred to as a M1 macrophage, and has been used in zebrafish to identify these macrophage sub-populations 38. It is important to note that other cells in the liver can express TNFα including hepatocytes 39. However, pro-inflammatory subsets of hepatic macrophages are the main source of TNFα in the liver in NAFLD/NASH disease 40, 41. To address macrophage polarization, we crossed the zebrafish HCC model to the TNFα reporter line. We found increased numbers of TNFα-positive macrophages in HCC+HFD compared to HCC control (Fig.5A-D). The same effect was observed in control larvae fed with HFD (Suppl.Fig.6D). Taken together, our findings suggest that HFD induces pro-inflammatory macrophage polarization in the liver during early HCC.
Figure 5: HFD induces macrophage polarization in NASH-associated HCC zebrafish.

(A-C) Representative 3D reconstructions of macrophages and TNFα expressing cells in liver area of 13-day old in HCC and HCC+HFD larvae. Yellow arrows show TNFα-positive macrophages. (D) Graph showing ratio of TNFα-positive macrophages over total macrophage number at liver area in HCC and HCC+HFD larvae (HCC N= 13, HCC+HFD N= 19). Scale bar= 40μm. (E) Representative images of livers of HCC and HCC+HFD larvae treated with DMSO or metronidazole (MTZ). Scale bar= 500μm. (F) Graph showing liver area in HCC and HCC+HFD larvae treated with DMSO or MTZ (HCC-DMSO N= 30, HCC+HFD-DMSO N= 41, HCC-MTZ N= 20, HCC+HFD-MTZ N= 23). All data plotted comprise at least three independent experimental replicates. LS-Means analysis in R was performed in all data, with Tukey method when comparing more than two conditions. Dot plots show mean ±SEM, significant p values are shown in each graph.
Macrophages are necessary for progression of HCC induced by diet
To further address the role of macrophages in the HCC+HFD phenotype, we outcrossed the HCC line with a transgenic line that allows for 80–90% depletion of macrophages,Tg(mpeg1: NTR-eYFP) (Suppl. Table 1), with metronidazole (MTZ) treatment 42. We began MTZ treatment at 4 dpf to ablate macrophages before we introduced the HFD. Using liver growth as an indicator of disease progression, we found that macrophage ablation reduced liver size to control levels in the HCC+HFD larvae (Fig.5E and F). Surprisingly, macrophage ablation affected liver size in HCC+HFD larvae but not in HCC or HFD alone (Suppl.Fig.7B and C). Taken together, our findings suggest that macrophages, and specifically macrophage polarization, play a key role in the early progression of NAFLD/NASH-associated HCC in larval zebrafish.
Metformin inhibits diet-induced progression specifically in NASH-associated HCC
Metformin is a drug that induces AMPK activation and is being used to treat diabetes and NAFLD 17, 43, 44. Metformin can also reduce HCC incidence in obese/diabetic patients 17. However, the role of Metformin in treating HCC remains unclear19. We therefore sought to determine if metformin was able to reduce HCC progression in NASH-associated HCC in larval zebrafish. Interestingly, metformin treatment of HCC+HFD larvae reduced liver size to levels similar to HCC alone (Fig.6A and D), suggesting a reduction of NASH-associated HCC progression. No change was observed in HCC larvae treated with metformin in the presence of a normal diet (Fig.6A and D). Next, we addressed if Metformin was able to rescue the malignant cellular and nuclear changes enhanced by HFD in HCC larvae (Fig.3G-L). We found HCC+HFD larvae treated with metformin had a significant decrease in hepatocyte area and increase in nuclear circularity (Fig.6B, C, E and F). Although a trend toward a decrease N:C ratio was noted in HCC larvae fed with HFD treated with Metformin, no significant changes were observed (Fig.6B and G). In addition, metformin significantly reduced the incidence of micronuclei and nuclear herniation in HCC+HFD larvae (Fig.6B, C and H). Interestingly, metformin had no effect on any of the malignant features measured in HCC larvae alone (Fig.6B-H). Altogether, these data suggest that metformin might be a useful therapeutic approach to specifically treat NASH-associated HCC progression.
Figure 6: Metformin rescues the effect of HFD on HCC progression.

(A) Representative 3D reconstructions of livers in HCC and HCC+HFD larvae with or without metformin treatment. Scale bar= 40μm. (B, C) Representative 3D reconstructions of F-actin and hepatocyte nuclei in liver of in HCC and HCC+HFD larvae. Scale bar 5μm. Open arrowheads show enlarged nuclei; white arrowheads show nucleus with altered shape; and red arrows show micronuclei and nuclear herniation. Scale bar 5μm. (D) Graph showing liver area of HCC and HCC+HFD larvae with or without metformin treatment (HCC N= 22, HCC+HFD N= 27, HCC-Met N= 36, HCC+HFD-Met N= 46). (E-F) Graphs showing averages of cell and nuclear parameters in HCC and HCC+HFD 13-day old larvae with or without metformin treatment. (E) Hepatocyte area. (F) Nuclear circularity. (G) Nuclear:Cytoplasm ratio. Measures were done in hepatocytes of HCC and HCC+HFD larvae (15–30 cells/ larvae; HCC N= 12, HCC+HFD N= 19, HCC-Met N= 12, HCC+HFD-Met N= 12). (L) Chi-square graph showing percentage of larvae with different scoring of Micronuclei and Nuclear herniation (HCC N= 18, HCC+HFD N= 34, HCC-Met N= 25, HCC+HFD-Met N= 29). All data plotted comprise at least three independent experimental replicates. LS-Means analysis with Tukey method in R was performed in all data, with exception of micronuclei scoring (L) analyzed with a Chi-square test. Plots show mean ±SEM, significant p values are shown in each graph.
Metformin rescues high fat diet effect on liver tumorigenesis and decreases inflammation and restores T cells in NASH-associated HCC larvae
Metformin has tumor suppressive effects by inhibiting angiogenesis and proliferation15. Metformin also decreases steatosis and lipotoxicity associated with high fat intake43.To determine the effect of metformin on the TME of NASH-associated HCC larvae we measured vessel formation, steatosis, lipotoxicity and proliferation. We found that metformin rescued the diet-induced increase in vessel formation, steatosis, lipotoxicity and proliferation in HCC+HFD larvae (Fig.7A-H). Metformin treatment is also reported to reduce inflammation and modulates macrophage polarization in vitro 45, 46. Accordingly, we found that metformin treated HCC+HFD larvae had a reduced density of TNFα-positive cells and neutrophils (Fig.8A-D). Interestingly, metformin also rescued the inhibitory effect of diet on T cell recruitment to the liver (Fig.8E-F). These data suggest that metformin reduces diet-induced increases in angiogenesis, steatosis, lipotoxicity and nonresolving inflammation and restores T cell infiltration and potentially surveillance.
Figure 7: Metformin rescues diet enhanced angiogenesis, steatosis, apoptosis and proliferation in NASH-associated HCC larvae.

(A) Representative 3D reconstructions of livers in HCC and HCC+HFD larvae treated with metformin or control. (B) Graph showing vessel density index by liver volume in HCC and HCC+HFD larvae with metformin or control (HCC N=12, HCC+HFD N=20, HCC+HFD+Met=20). (C) Representative images of livers stained with Oil Red; HCC and HCC+HFD larvae treated with metformin or control. (D) Chi-square graph showing percentage of larvae with different scoring of liver steatosis (HCC N= 30, HCC+HFD N= 38, HCC+HFD-Met N= 30). (E) Representative 3D reconstructions of liver and Active Caspase 3 in HCC and HCC+HFD larvae treated with metformin or control. (F) Graph showing active-caspase 3 positive cells density in liver in HCC and HCC+HFD larvae treated with metformin or control (HCC N=28, HCC+HFD N= 28, HCC+HFD+Met=33). (G) Representative 3D reconstructions of liver and EDU in HCC and HCC+HFD larvae treated with metformin or control. (H) Graph showing EDU positive cells density in liver in HCC and HCC+HFD larvae treated with metformin or control (HCC N=18, HCC+HFD N= 29, HCC+HFD+Met=22). Scale bar= 40μm. All data are from at least three independent experimental replicates. LS-Means analysis with Tukey method in R was performed in all data, with exception of steatosis scoring (D) analyzed with a Chi-square test. Dot plots show mean ±SEM, significant p values are shown in each graph.
Figure 8: Metformin reduces diet-enhanced inflammation and rescues T Cell infiltration in HCC larvae.

(A) Representative 3D reconstructions of TNFα cells in livers from HCC and HCC+HFD larvae larvae treated with metformin or control. (B) Graph showing TNFα positive cell density in livers of HCC and HCC+HFD larvae treated with metformin or control (HCC N= 25, HCC+HFD N= 20, HCC+HFD-Met N= 30). (C) Representative 3D reconstructions of neuthrophil recruitment in livers from HCC and HCC+HFD larvae larvae treated with metformin or control. (D) Graph showing neutrophil density in livers of HCC and HCC+HFD larvae treated with metformin or control (HCC N= 23, HCC+HFD N= 37, HCC+HFD-Met N= 28). (E) Representative 3D reconstructions of T cell recruitment in livers from HCC and HCC+HFD larvae treated with metformin or control. (F) Graph showing T cell density in livers of HCC and HCC+HFD larvae treated with metformin or control (HCC N= 23, HCC+HFD N= 51, HCC+HFD-Met N= 34). Scale bar= 40μm. All data plotted comprise at least three independent experimental replicates. LS-Means analysis with Tukey method in R was performed in all data. Dot plots show mean ±SEM, significant p values are shown in each graph.
Discussion
HCC incidence is increasing worldwide, particularly NASH-associated HCC. Unfortunately, treatments for these types of cancer are limited. Better understanding of the cell and molecular players in the liver TME is crucial to identify therapeutics to treat the different types of HCC. It is particularly important to understand the effect of western diet on factors that affect the risk of uncontrolled inflammation that occur in NASH, which can enhance liver tumorigenesis but also alters patient’s response to therapy. A key gap is the ability to live image intercellular interactions within the liver microenvironment that mediate inflammation and contribute to disease progression. Here we employ tools to visualize features of disease progression and inflammation phenotypes in real time in zebrafish NAFLD/NASH and HCC larval models. We also probe the effect of the drug metformin on inflammation and progression in NASH-associated HCC.
Our findings demonstrate that high fat diet exacerbates larval HCC including increasing liver size and angiogenesis. These findings are consistent with previous reports showing increased angiogenesis in NASH 29–31, although here we show increased angiogenesis at early stages after introduction of a HFD. Importantly, high fat diet also induced alterations in nuclear parameters associated with malignancy during early progression in this HCC model. Most notably, high fat diet induced the increased formation of micronuclei, indicating DNA damage, likely associated with lipotoxicity and an increase in oxidative stress47. To our knowledge this is the first time that these changes have been visualized in vivo, and after short a duration of a high fat diet, suggesting that short-term dietary changes can enhance hepatocarcinogenesis.
Myeloid cell infiltration has been associated with HCC in humans and in experimental models, but not previously in this zebrafish model of β-catenin induced carcinogenesis, in particular at this stage of progression22. This pro-inflammatory phenotype is likely an early driver of the malignant process. Neutrophils can be pro-tumorigenic and enhance hepatocarcinogenesis 48 by releasing growth factors that promote angiogenesis and tumor proliferation 49, or chemotactic cues that modulate recruitment and polarization of macrophages and regulatory T cells 50. Increasing neutrophil-to-lymphocyte ratios have been associated with poor prognosis in patients with HCC and are being used as a prognostic factor 51. In addition to the increased liver neutrophil infiltration, NASH-associated HCC larvae also had a decrease in the total number of T cells suggesting that diet may modulate T cell numbers in the liver and potentially tumor surveillance. Interestingly, this effect on T cells is consistent with what was reported by Chi Ma et al 14 showing that NAFLD limits liver tumor T-cell surveillance in a mouse model due to reduced numbers of CD4+ T lymphocytes.
Our finding that high fat diet induces changes in macrophage polarization into a pro-inflammatory TNFα-positive population without affecting overall cell number is intriguing. TNFα is a key inflammatory component associated with lipotoxicity in NASH-associated HCC progression 52–54. This pro-inflammatory cytokine not only serves as a key mediator of hepatocyte apoptosis resulting in liver damage but also plays an important role in cellular proliferation leading to liver regeneration or hepatocarcinogenesis 39. Indeed, we observed that high fat diet induced proliferation in the liver of both control and HCC larvae. Several cells in the liver can express TNFα, including hepatic macrophages, neutrophils, dendritic cells, natural killer cells, lymphoid cells, endothelial cells and fibroblasts 39, 55. However, pro-inflammatory hepatic macrophages are the main source of TNFα in liver in NAFLD/NASH disease 40, 41, consistent with our findings. It has been reported by others that pro-inflammatory sets of macrophages and Kupffer cells play a major role in liver disease progression 56, specially in NAFLD/NASH 12. Macrophage activation in the liver occurs through sensing a wide variety of signals such as HMGB1, ATP, IL1β or ROS that are released from damaged hepatocytes due to lipotoxicity 57. In the case of HCC, tumor-associated macrophages (TAM) can play dual functional roles by clearing premalignant senescent hepatocytes and preventing progression to HCC or by providing tumorigenic signals which drive HCC progression 57. In our NAFLD/NASH-associated HCC zebrafish model, macrophage depletion also decreased HCC progression. Surprisingly, our data identified macrophages as key modulators of NAFLD/NASH-associated HCC progression in zebrafish but not for HCC alone. Overall, TAM infiltration is generally associated with poor prognosis in HCC and can contribute to HCC progression by promoting proliferation, angiogenesis and later metastasis 7, 11, 57. In the future it will be important to determine what macrophage-derived signals are involved in HCC progression to enable potential macrophage-specific drug targets for the treatment of NAFLD/NASH-associated HCC.
Metformin is mainly used as an anti-diabetic drug17 and in recent years, this drug has gained attention due to its pleiotropic effect and lower cancer incidence in treated patients17. Metformin may have tumor-suppressive therapeutic effects for HCC and other cancers15, 17 due to its inhibitory effects on inflammation, oxidative stress and angiogenesis58, 59, in addition to inducing autophagy or apoptosis60. Several in vivo and in vitro studies have supported the clinical use of metformin to treat HCC, althought its role in vivo is still unclear19. Our data suggest that the effect of metformin on HCC progression may depend on the type of HCC. In NASH-associated HCC in zebrafish, metformin abrogated the effect of high fat diet on HCC progression. Importantly, the inhibitory effect of metformin in NASH-associated HCC larvae was associated with decreased inflammation and hepatocyte proliferation, as well as affecting micronuclei formation. Metformin can antagonize cancer cell proliferation by multiple mechanisms including inhibition of mTOR signalling58, suppressing mitochondrial-dependent metabolic intermediates16,61, or indirectly through its effects on inflammation. Several studies have shown that metformin induces a downregulation in TNFα and hypoxia-inducible factor 1α, which can limit angiogenesis58. We found that metformin modulates the TME immune cell composition in the NASH-associated HCC zebrafish by reducing diet-induced nonresolving inflammation and increasing T cell infiltration. These data are in accordance with the literature, which shows that increased AMPK activity inhibits NF-κB and IL-6/STAT3 signaling activity suppressesing inflammation in the liver20. In the future, it will be interesting to determine if neutrophils and macrophages are involved in the effect of diet on liver tumor surveillance, and how metformin modulates this process.
In summary, these data suggest that high fat diet induces a nonresolving inflammatory microenvironment in HCC, decreasing tumor surveillance and accelerating liver tumorigenesis in a zebrafish model of NASH-associated HCC. Indeed, our findings show that metformin, a drug known to modulate macrophage polarization and reduce lipotoxicity in hepatocytes, provides beneficial effects in limiting inflammation and potentially restoring tumor surveillance in NASH-associated HCC zebrafish larvae. In the future, Metformin might be a useful therapeutic approach to specifically target NASH-associated HCC and decrease diet enhanced hepatocarcinogenesis.
Supplementary Material
Acknowledgements
We thank to Dr. Kimberley J. Evason for the zebrafish transgenic β-catenin HCC model, to Dr. Kirsten Sadler for the fabp10a promoter, to Dr. Randal T. Moon for the Tg(mpeg-NTR-eYFP) line, to Dr. Adam Hurlstone and Dr. David Langenau for TgBAC(cd4–1:mcherry)/Tg(lcK:egfp) line, Dr. M. Bagnat for the TNFα reporter line (Tg(tnfα:egfp)), Dr. Melissa Graham for assistance with telost histopathology, and Dr. Emily E. Rosowski and Dr. Davalyn R. Powell for careful manuscript reading and editing.
Grant Support: AH was funded by NCI CA085862; SdO is supported by EMBO ALTF 620–2015 and Cancer Research Institute/Fibrolamellar Cancer Foundation; NG is supported by Molecular Biosciences Training Grant T32-GM07215 and Laboratory for Optical and Computational Instrumentation and the Morgridge Institute for Research (KE); VM is supported by American Heart Association (17POST33410970)
Abbreviations used in this paper:
- NAFLD
Nonalcoholic fatty liver disease
- NASH
nonalcoholic steatohepatitis
- HCC
hepatocellular carcinoma
- HFD
high-fat diet
- TME
tumor microenvironment
- TNF
tumor necrosis factor
- dpf
days post-fertilization
- ND
normal diet
- MTZ
metronidazole
- NTR
nitroreductase
- Met
Metformin
Footnotes
Disclosures: The authors disclose no conflicts.
References
- 1.Estes C, Razavi H, Loomba R, et al. Modeling the epidemic of nonalcoholic fatty liver disease demonstrates an exponential increase in burden of disease. Hepatology 2018;67:123–133. [DOI] [PMC free article] [PubMed] [Google Scholar]
- 2.El-Serag HB. Hepatocellular carcinoma. N Engl J Med 2011;365:1118–27. [DOI] [PubMed] [Google Scholar]
- 3.El-Serag HB, Kanwal F. Epidemiology of hepatocellular carcinoma in the United States: where are we? Where do we go? Hepatology 2014;60:1767–75. [DOI] [PMC free article] [PubMed] [Google Scholar]
- 4.Pocha C, Kolly P, Dufour JF. Nonalcoholic Fatty Liver Disease-Related Hepatocellular Carcinoma: A Problem of Growing Magnitude. Semin Liver Dis 2015;35:304–17. [DOI] [PubMed] [Google Scholar]
- 5.Mantovani A, Targher G. Type 2 diabetes mellitus and risk of hepatocellular carcinoma: spotlight on nonalcoholic fatty liver disease. Ann Transl Med 2017;5:270. [DOI] [PMC free article] [PubMed] [Google Scholar]
- 6.Meli R, Mattace Raso G, Calignano A. Role of innate immune response in non-alcoholic Fatty liver disease: metabolic complications and therapeutic tools. Front Immunol 2014;5:177. [DOI] [PMC free article] [PubMed] [Google Scholar]
- 7.Capece D, Fischietti M, Verzella D, et al. The inflammatory microenvironment in hepatocellular carcinoma: a pivotal role for tumor-associated macrophages. Biomed Res Int 2013;2013:187204. [DOI] [PMC free article] [PubMed] [Google Scholar]
- 8.Kim J, Bae JS. Tumor-Associated Macrophages and Neutrophils in Tumor Microenvironment. Mediators Inflamm 2016;2016:6058147. [DOI] [PMC free article] [PubMed] [Google Scholar]
- 9.Grivennikov SI, Greten FR, Karin M. Immunity, inflammation, and cancer. Cell 2010;140:883–99. [DOI] [PMC free article] [PubMed] [Google Scholar]
- 10.Powell DR, Huttenlocher A. Neutrophils in the Tumor Microenvironment. Trends in immunology 2016;37:41–52. [DOI] [PMC free article] [PubMed] [Google Scholar]
- 11.Tacke F Targeting hepatic macrophages to treat liver diseases. J Hepatol 2017;66:1300–1312. [DOI] [PubMed] [Google Scholar]
- 12.Ganz M, Bukong TN, Csak T, et al. Progression of non-alcoholic steatosis to steatohepatitis and fibrosis parallels cumulative accumulation of danger signals that promote inflammation and liver tumors in a high fat-cholesterol-sugar diet model in mice. J Transl Med 2015;13:193. [DOI] [PMC free article] [PubMed] [Google Scholar]
- 13.Luo W, Xu Q, Wang Q, et al. Effect of modulation of PPAR-gamma activity on Kupffer cells M1/M2 polarization in the development of non-alcoholic fatty liver disease. Sci Rep 2017;7:44612. [DOI] [PMC free article] [PubMed] [Google Scholar]
- 14.Ma C, Kesarwala AH, Eggert T, et al. NAFLD causes selective CD4(+) T lymphocyte loss and promotes hepatocarcinogenesis. Nature 2016;531:253–7. [DOI] [PMC free article] [PubMed] [Google Scholar]
- 15.Dreher LS, Hoppe T. ERADicate Tumor Progression with Metformin. Mol Cell 2018;71:481–482. [DOI] [PubMed] [Google Scholar]
- 16.Griss T, Vincent EE, Egnatchik R, et al. Metformin Antagonizes Cancer Cell Proliferation by Suppressing Mitochondrial-Dependent Biosynthesis. PLoS Biol 2015;13:e1002309. [DOI] [PMC free article] [PubMed] [Google Scholar]
- 17.Pernicova I, Korbonits M. Metformin--mode of action and clinical implications for diabetes and cancer. Nat Rev Endocrinol 2014;10:143–56. [DOI] [PubMed] [Google Scholar]
- 18.Baffy G, Brunt EM, Caldwell SH. Hepatocellular carcinoma in non-alcoholic fatty liver disease: an emerging menace. J Hepatol 2012;56:1384–91. [DOI] [PubMed] [Google Scholar]
- 19.Bhat M, Chaiteerakij R, Harmsen WS, et al. Metformin does not improve survival in patients with hepatocellular carcinoma. World J Gastroenterol 2014;20:15750–5. [DOI] [PMC free article] [PubMed] [Google Scholar]
- 20.Zheng L, Yang W, Wu F, et al. Prognostic significance of AMPK activation and therapeutic effects of metformin in hepatocellular carcinoma. Clin Cancer Res 2013;19:5372–80. [DOI] [PubMed] [Google Scholar]
- 21.Li J, Hernanda PY, Bramer WM, et al. Anti-tumor effects of metformin in animal models of hepatocellular carcinoma: a systematic review and meta-analysis. PLoS One 2015;10:e0127967. [DOI] [PMC free article] [PubMed] [Google Scholar]
- 22.Evason KJ, Francisco MT, Juric V, et al. Identification of Chemical Inhibitors of beta-Catenin-Driven Liver Tumorigenesis in Zebrafish. PLoS Genet 2015;11:e1005305. [DOI] [PMC free article] [PubMed] [Google Scholar]
- 23.Goessling W, Sadler KC. Zebrafish: an important tool for liver disease research. Gastroenterology 2015;149:1361–77. [DOI] [PMC free article] [PubMed] [Google Scholar]
- 24.Yoo SK, Deng Q, Cavnar PJ, et al. Differential regulation of protrusion and polarity by PI3K during neutrophil motility in live zebrafish. Dev Cell 2010;18:226–36. [DOI] [PMC free article] [PubMed] [Google Scholar]
- 25.Progatzky F, Sangha NJ, Yoshida N, et al. Dietary cholesterol directly induces acute inflammasome-dependent intestinal inflammation. Nat Commun 2014;5:5864. [DOI] [PMC free article] [PubMed] [Google Scholar]
- 26.Vincent WJ, Freisinger CM, Lam PY, et al. Macrophages mediate flagellin induced inflammasome activation and host defense in zebrafish. Cell Microbiol 2016;18:591–604. [DOI] [PMC free article] [PubMed] [Google Scholar]
- 27.Dai W, Wang K, Zheng X, et al. High fat plus high cholesterol diet lead to hepatic steatosis in zebrafish larvae: a novel model for screening anti-hepatic steatosis drugs. Nutr Metab (Lond) 2015;12:42. [DOI] [PMC free article] [PubMed] [Google Scholar]
- 28.Zhao Y, Huang X, Ding TW, et al. Enhanced angiogenesis, hypoxia and neutrophil recruitment during Myc-induced liver tumorigenesis in zebrafish. Sci Rep 2016;6:31952. [DOI] [PMC free article] [PubMed] [Google Scholar]
- 29.Coulon S, Francque S, Colle I, et al. Evaluation of inflammatory and angiogenic factors in patients with non-alcoholic fatty liver disease. Cytokine 2012;59:442–9. [DOI] [PubMed] [Google Scholar]
- 30.Bocca C, Novo E, Miglietta A, et al. Angiogenesis and Fibrogenesis in Chronic Liver Diseases. Cell Mol Gastroenterol Hepatol 2015;1:477–488. [DOI] [PMC free article] [PubMed] [Google Scholar]
- 31.Ciupinska-Kajor M, Hartleb M, Kajor M, et al. Hepatic angiogenesis and fibrosis are common features in morbidly obese patients. Hepatol Int 2013;7:233–40. [DOI] [PMC free article] [PubMed] [Google Scholar]
- 32.Asaoka Y, Terai S, Sakaida I, et al. The expanding role of fish models in understanding non-alcoholic fatty liver disease. Dis Model Mech 2013;6:905–14. [DOI] [PMC free article] [PubMed] [Google Scholar]
- 33.Tandra S, Yeh MM, Brunt EM, et al. Presence and significance of microvesicular steatosis in nonalcoholic fatty liver disease. J Hepatol 2011;55:654–659. [DOI] [PMC free article] [PubMed] [Google Scholar]
- 34.Hatch EM, Fischer AH, Deerinck TJ, et al. Catastrophic nuclear envelope collapse in cancer cell micronuclei. Cell 2013;154:47–60. [DOI] [PMC free article] [PubMed] [Google Scholar]
- 35.Ioannou GN. The Role of Cholesterol in the Pathogenesis of NASH. Trends Endocrinol Metab 2016;27:84–95. [DOI] [PubMed] [Google Scholar]
- 36.Schneider C, Tacke F. Distinct anti-tumoral functions of adaptive immune cells in liver cancer. Oncoimmunology 2012;1:937–939. [DOI] [PMC free article] [PubMed] [Google Scholar]
- 37.Schneider C, Teufel A, Yevsa T, et al. Adaptive immunity suppresses formation and progression of diethylnitrosamine-induced liver cancer. Gut 2012;61:1733–43. [DOI] [PMC free article] [PubMed] [Google Scholar]
- 38.Nguyen-Chi M, Laplace-Builhe B, Travnickova J, et al. Identification of polarized macrophage subsets in zebrafish. Elife 2015;4:e07288. [DOI] [PMC free article] [PubMed] [Google Scholar]
- 39.Jang MK, Kim HS, Chung YH. Clinical aspects of tumor necrosis factor-alpha signaling in hepatocellular carcinoma. Curr Pharm Des 2014;20:2799–808. [DOI] [PubMed] [Google Scholar]
- 40.Nakashima H, Ogawa Y, Shono S, et al. Activation of CD11b+ Kupffer cells/macrophages as a common cause for exacerbation of TNF/Fas-ligand-dependent hepatitis in hypercholesterolemic mice. PLoS One 2013;8:e49339. [DOI] [PMC free article] [PubMed] [Google Scholar]
- 41.Tosello-Trampont AC, Landes SG, Nguyen V, et al. Kuppfer cells trigger nonalcoholic steatohepatitis development in diet-induced mouse model through tumor necrosis factor-alpha production. J Biol Chem 2012;287:40161–72. [DOI] [PMC free article] [PubMed] [Google Scholar]
- 42.Petrie TA, Strand NS, Yang CT, et al. Macrophages modulate adult zebrafish tail fin regeneration. Development 2014;141:2581–91. [DOI] [PMC free article] [PubMed] [Google Scholar]
- 43.Smith BK, Marcinko K, Desjardins EM, et al. Treatment of nonalcoholic fatty liver disease: role of AMPK. Am J Physiol Endocrinol Metab 2016;311:E730–E740. [DOI] [PubMed] [Google Scholar]
- 44.Chen L, Shu Y, Liang X, et al. OCT1 is a high-capacity thiamine transporter that regulates hepatic steatosis and is a target of metformin. Proc Natl Acad Sci U S A 2014;111:9983–8. [DOI] [PMC free article] [PubMed] [Google Scholar]
- 45.Hattori Y, Hattori K, Hayashi T. Pleiotropic benefits of metformin: macrophage targeting its anti-inflammatory mechanisms. Diabetes 2015;64:1907–9. [DOI] [PubMed] [Google Scholar]
- 46.Jing Y, Wu F, Li D, et al. Metformin improves obesity-associated inflammation by altering macrophages polarization. Mol Cell Endocrinol 2018;461:256–264. [DOI] [PubMed] [Google Scholar]
- 47.Algire C, Moiseeva O, Deschenes-Simard X, et al. Metformin reduces endogenous reactive oxygen species and associated DNA damage. Cancer Prev Res (Phila) 2012;5:536–43. [DOI] [PubMed] [Google Scholar]
- 48.Yan C, Huo X, Wang S, et al. Stimulation of hepatocarcinogenesis by neutrophils upon induction of oncogenic kras expression in transgenic zebrafish. J Hepatol 2015;63:420–8. [DOI] [PMC free article] [PubMed] [Google Scholar]
- 49.Kuang DM, Zhao Q, Wu Y, et al. Peritumoral neutrophils link inflammatory response to disease progression by fostering angiogenesis in hepatocellular carcinoma. J Hepatol 2011;54:948–55. [DOI] [PubMed] [Google Scholar]
- 50.Zhou SL, Zhou ZJ, Hu ZQ, et al. Tumor-Associated Neutrophils Recruit Macrophages and T-Regulatory Cells to Promote Progression of Hepatocellular Carcinoma and Resistance to Sorafenib. Gastroenterology 2016;150:1646–1658 e17. [DOI] [PubMed] [Google Scholar]
- 51.Lue A, Serrano MT, Bustamante FJ, et al. Neutrophil-to-lymphocyte ratio predicts survival in European patients with hepatocellular carcinoma administered sorafenib. Oncotarget 2017;8:103077–103086. [DOI] [PMC free article] [PubMed] [Google Scholar]
- 52.Park EJ, Lee JH, Yu GY, et al. Dietary and genetic obesity promote liver inflammation and tumorigenesis by enhancing IL-6 and TNF expression. Cell 2010;140:197–208. [DOI] [PMC free article] [PubMed] [Google Scholar]
- 53.Matthews RP, Lorent K, Manoral-Mobias R, et al. TNFalpha-dependent hepatic steatosis and liver degeneration caused by mutation of zebrafish S-adenosylhomocysteine hydrolase. Development 2009;136:865–75. [DOI] [PMC free article] [PubMed] [Google Scholar]
- 54.Nakagawa H, Umemura A, Taniguchi K, et al. ER stress cooperates with hypernutrition to trigger TNF-dependent spontaneous HCC development. Cancer Cell 2014;26:331–343. [DOI] [PMC free article] [PubMed] [Google Scholar]
- 55.Choi YS, Jung MK, Lee J, et al. Tumor Necrosis Factor-producing T-regulatory Cells Are Associated With Severe Liver Injury in Patients With Acute Hepatitis A. Gastroenterology 2018;154:1047–1060. [DOI] [PMC free article] [PubMed] [Google Scholar]
- 56.Osterreicher CH, Penz-Osterreicher M, Grivennikov SI, et al. Fibroblast-specific protein 1 identifies an inflammatory subpopulation of macrophages in the liver. Proc Natl Acad Sci U S A 2011;108:308–13. [DOI] [PMC free article] [PubMed] [Google Scholar]
- 57.Krenkel O, Tacke F. Liver macrophages in tissue homeostasis and disease. Nat Rev Immunol 2017;17:306–321. [DOI] [PubMed] [Google Scholar]
- 58.Bhat A, Sebastiani G, Bhat M. Systematic review: Preventive and therapeutic applications of metformin in liver disease. World J Hepatol 2015;7:1652–9. [DOI] [PMC free article] [PubMed] [Google Scholar]
- 59.Hirsch HA, Iliopoulos D, Struhl K. Metformin inhibits the inflammatory response associated with cellular transformation and cancer stem cell growth. Proc Natl Acad Sci U S A 2013;110:972–7. [DOI] [PMC free article] [PubMed] [Google Scholar]
- 60.Li K, Zhang TT, Hua F, et al. Metformin reduces TRIB3 expression and restores autophagy flux: an alternative antitumor action. Autophagy 2018;14:1278–1279. [DOI] [PMC free article] [PubMed] [Google Scholar]
- 61.Sullivan LB, Luengo A, Danai LV, et al. Aspartate is an endogenous metabolic limitation for tumour growth. Nat Cell Biol 2018;20:782–788. [DOI] [PMC free article] [PubMed] [Google Scholar]
Associated Data
This section collects any data citations, data availability statements, or supplementary materials included in this article.