

Abstract
European foulbrood is a globally distributed brood disease affecting honey bees. It may lead to lethal infections of larvae and, in severe cases, even to colony collapse. Lately, a profound genetic and phenotypic diversity was documented for the causative agent Melissococcus plutonius. However, experimental work on the impact of diverse M. plutonius strains on hosts with different genetic background is completely lacking and the role of secondary invaders is poorly understood. Here, we address these issues and elucidate the impact and interaction of both host and pathogen on one another. Moreover, we try to unravel the role of secondary bacterial invasions in foulbrood‐diseased larvae. We employed in vitro infections with honey bee larvae from queens with different genetic background and three different M. plutonius strains. Larvae infection experiments showed host‐dependent survival dynamics although M. plutonius strain 49.3 consistently had the highest virulence. This pattern was also reflected in significantly reduced weights of 49.3 strain‐infected larvae compared to the other treatments. No difference was found in groups additionally inoculated with a secondary invader (Enterococcus faecalis or Paenibacillus alvei) neither in terms of larval survival nor weight. These results suggest that host background contributes markedly to the course of the disease but virulence is mainly dependent on pathogen genotype. Secondary invaders following a M. plutonius infection do not increase disease lethality and therefore may just be a colonization of weakened and immunodeficient, or dead larvae.
Keywords: Apis mellifera, brood disease, clonal complex, foulbrood, host–parasite interaction, sequence type
1. INTRODUCTION
European foulbrood (EFB) is a globally distributed brood disease (Ellis & Munn, 2005) mainly infecting early‐stage honey bee larvae of different honey bee species (Apis mellifera (Bailey, 1956), A. cerana (Bailey, 1974), A. laboriosa (Allen, Ball, & Underwood, 1990)). In the worst cases, EFB can lead to colony death. Diseased larvae are characterized by a change in color from white (via yellow, orange, and brown) to grayish‐black with a foul or sour smell and usually do not reach or complete the pupation stage (reviewed in Forsgren, 2010). The gram‐positive bacterium Melissococcus plutonius was identified as the disease‐causing agent (Bailey, 1956, 1957a, 1957b, 1983; White, 1912, 1920) along with some secondary invaders (Achromobacter eurydice, Bacillus pumilus, Brevibacillus laterosporus, Enterococcus faecalis, Paenibacillus alvei, Paenibacillus dendritiformis; Erler, Denner, Bobiş, Forsgren, & Moritz, 2014; Forsgren, 2010; Gaggia et al., 2015). However, the existence of Achromobacter eurydice is still controversial (Erler, Lewkowski, Poehlein, & Forsgren, 2018) and the few experimental studies which investigated the impact of secondary invaders focused exclusively the role of P. alvei (Giersch, Barchia, & Hornitzky, 2010; Tarr, 1936).
Prevalence of M. plutonius is not only high in symptomatic colonies but also in adult bees and larvae of colonies without EFB symptoms located close to EFB‐symptomatic hives (Belloy et al., 2007; Budge et al., 2010; Forsgren, Lundhagen, Imdorf, & Fries, 2005; McKee, Djordjevic, Goodman, & Hornitzky, 2003; Roetschi, Berthoud, Kuhn, & Imdorf, 2008). Even colonies of EFB‐free and (non)symptomatic American foulbrood (caused by Paenibacillus larvae) apiaries, far away from EFB‐outbreak regions, have tested positive for M. plutonius (Budge et al., 2010; Erban et al., 2017). This means the disease may stay in an enzootic state in apparently healthy colonies (Pinnock & Featherstone, 1984). Transmission between colonies/apiaries occurs via robbing and drifting (White, 1920) where worker bees are the carrier of the bacterium (Belloy et al., 2007). The disease can also be transmitted to artificially reared larvae by using a larval diet inoculated with M. plutonius cells (McKee, Goodman, & Hornitzky, 2004).
While early studies assumed low genetic diversity in M. plutonius, Allen and Ball (1993) could show potential genetic variability of M. plutonius using serological reactivity (polyclonal M. plutonius antisera) with heterologous responses reflecting different geographic and host origin of the tested cultures. More recent studies group the approx. 30 different M. plutonius sequence types (ST) into three clonal complexes (CC 3, CC12, and CC13) (Budge et al., 2014; Haynes, Helgason, Young, Thwaites, & Budge, 2013; Takamatsu et al., 2014). Sequence types are determined by means of multilocus sequence typing (MLST) and can be detected on both very narrow local scales and widespread across countries (Budge et al., 2014; Haynes et al., 2013; Takamatsu et al., 2014). The different clonal complexes divide M. plutonius strains into two subtypes with CC3 and CC13 (including the type strain ST1) containing the typical strains, and CC12 containing the atypical strains (Budge et al., 2014; Haynes et al., 2013; Takamatsu et al., 2014). Typical and atypical (M. plutonius‐like) strains can both be isolated from diseased larvae with clinical signs of EFB. However, they differ in their cultural and biochemical characteristics, and their ability to cause disease after laboratory in vitro cultivation (Arai et al., 2012).
Even though all described M. plutonius strains (belonging to different clonal complexes) were isolated from naturally diseased honey bee larvae, they seem to differ in virulence to their host. From field pathology data, without experimental testing, CC3 and CC12 are more virulent than CC13, (Budge et al., 2014). Under improved inoculation conditions (potassium‐rich medium/diet) and in vitro larvae infection assays, Nakamura and coworkers proved that CC13 is the least virulent (possibly even avirulent) clonal complex followed by CC3, with CC12 being extremely virulent (Nakamura et al., 2016). Strains of CC13 may lose their infectivity/virulence due to in vitro subcultivation which is a well‐known phenomenon for decades (Bailey, 1956; Bailey & Locher, 1968; Nakamura et al., 2016). Though this loss might be rescued following several in vivo passages in honey bee worker larvae (Bailey, 1963).
Most of the studies focusing on honey bee host–parasite (pathogen) interactions studied pathogen genotypic effects (Genersch, Ashiralieva, & Fries, 2005) rather than host–parasite/pathogen genotypic interactions (Evison et al., 2013). For bacterial bee diseases in particular, host genotypic effects are usually disregarded. Here, we investigate the virulence of several M. plutonius isolates (belonging to CC3 and CC13 complex) on different host genetic backgrounds using standard in vitro larvae rearing. Furthermore, we tested the most virulent M. plutonius strain, in combination with two secondary invaders (P. alvei and E. faecalis), for their putative additive pathogenic effects.
2. MATERIAL AND METHODS
2.1. Ethics statement
Endangered or protected species were not used in this study. Experiments and observations conform with the laws of Germany in relation to animal protection. No specific ethics certification is required for this research.
2.2. Impact of host background
2.2.1. Larvae grafting and in vitro rearing
Honey bee larvae (Apis mellifera) were grafted, reared in vitro and received worker larval diet as described in Crailsheim et al. (2013). To test for variance in M. plutonius CC‐type virulence and colony effects, hatched larvae were grafted from two different colonies (A— queen of Czech‐German origin, B—queen of French‐German origin), following queen caging for 24 hr, and assigned randomly to one of the four following treatment groups per colony. Treatment group 1: control (uninfected), and three groups (group 2–4)—larvae infected with M. plutonius strains 49.3 (Switzerland/Jenaz), 119 (Switzerland/Köniz) or 4–127 (Sweden). Both colonies were treated against Varroa destructor using Bayvarol stripes (Bayer) according to the manufacturer recommendations and were checked regularly for clinical signs of common bee diseases. No symptoms, such as bees having crippled wings (DWV) or diarrhea (Nosema sp.) were observed, indicating a similar healthy status of both colonies.
2.2.2. Bacteria cultivation and infection
M. plutonius strains 49.3 (ST 3, CC3), 119 (ST 20, CC13), 4–127 (ST1, CC13), and LMG 20360 (ST1, CC13) were cultivated in a liquid medium consisting of 5 g/L yeast extract, 2 g/L sucrose, 10 g/L glucose, 6.75 g/L KH2PO4, 6.75 g/L K2HPO4, 1 g/L L‐cysteine hydrochloride, and 5 g/L homogenized drone pupae (white eye), adjusted to pH 6.6 with KOH and incubated at 35°C with 10% CO2. Cultivation success and bacteria species was verified by sequencing according to Erler et al. (2014).
Worker bee larvae were grafted on a 5 µl day 1 diet (Crailsheim et al., 2013) and subsequently fed with 5 μl of a diet‐inoculum mix (19:1) containing one of the respective bacterial strain cultures or sterile medium (controls). The absorbance of the bacterial solutions was adjusted to 0.3 (OD600 nm) beforehand. From day 2 postgrafting till day 6 postgrafting, bee larvae received a standard diet following Crailsheim et al. (2013).
To estimate the effective colony‐forming units (CFUs) fed to the larvae, 20 μl of diluted inoculum (diet with bacteria) (1:50, 1:1,000, 1:10,000), as well as noninoculated food, were plated on solid medium plates (1.5% agar) according to Forsgren, Budge, Charrière, and Hornitzky (2013). CFUs were counted after 3 days incubation (35°C, 10% CO2) and are given per ml culture medium.
2.2.3. Larval survival, weight, and relative M. plutonius infection intensity
Larval survival was monitored on a daily basis until pupation of all larvae of the noninfected control groups. Pupation means that each larva had a clearly recognizable head–thorax–abdomen structure and six legs. Lastly, every individual that did not fully pupate the same day as the control bees was counted as dead. Larvae of all groups that died on day 1 postgrafting were excluded from the survival analysis due to potential grafting errors (Crailsheim et al., 2013). Larval weight was measured on day seven for all larvae of all groups, before placing them into new plates (covered with cellulose) for pupation (Crailsheim et al., 2013).
Larval infection intensity was measured from 8 to 12 white larvae per treatment group (minimum 4 larvae per group and for at least 2 grafting events), randomly selected on day 10 ± 1 postgrafting. White larvae which did not defecate were selected to get a consistent picture of M. plutonius replication by excluding extremes (e.g., brown, gray, and black rotten larvae). DNA isolation was performed following standard phenol–chloroform–isoamyl alcohol (25:24:1) protocol. Initially larvae were homogenized in 400 μl extraction buffer pH 8.0 (100 mmol/L Tris/HCl, 100 mmol/L NaCl, 10 mmol/L EDTA, 1 mmol/L SDS) with 1 μl Tween20, and incubated for 5 min on ice. At the final step of the extraction procedure the dried DNA pellet was resuspended in 20–30 μl elution buffer (10 mmol/L Tris pH 7.4, 1 mmol/L EDTA pH 8.0). DNA quality and quantity were determined on a NanoDrop 1000 (Thermo Fisher Scientific). Samples with more than 1 μg/μl were diluted 1:50 and samples below 1 μg/μl 1:20 with DEPC water prior to M. plutonius quantification (qPCR) using the CFX Connect Real‐Time PCR Detection System (Bio‐Rad), SensiMix‐SYBR No‐ROX Kit (Bioline), and M. plutonius‐specific primers (EFB‐primer; Budge et al., 2010). Relative M. plutonius bacterial load per larvae (Forsgren et al., 2013) was estimated by normalizing bacterial load to the amount of honey bee mitochondrial DNA (COI‐primer) as recommend by Behrens, Forsgren, Fries, and Moritz (2010). The same qPCR protocol was used for each 10 μl reaction (including 1 μl diluted DNA) and one of the two primer pairs (forward and reverse, each with 0.3 μmol/L): initial denaturation at 95°C for 10 min, 40 cycles of 95°C for 15 s, 60°C for 30 s and 72°C for 30 s. The melting curve of the amplicons was measured from 50°C to 98°C, every 5 s with 1°C increment. Each sample was analyzed in duplicates and repeated if between replicate difference (delta Cq) was higher than 0.5. PCR efficiency for each primer pair was estimated using DNA dilutions: PCReff (EFB‐primer) = 1.93, PCReff (COI‐primer) = 1.89. Finally, data were collected for the two colonies, four treatment groups and for each combination of larvae from two to three grafting events. Details on exact sample sizes are summarized in Table S1.
2.2.4. Statistics
All statistical analyses were performed using R (ver. 3.3.2). Larval survival was evaluated by means of Kaplan–Meier survival analysis with subsequent log‐rank tests, for colony and treatment effects.
Data for larval weight and relative M. plutonius infection intensity were tested for deviation from a normal distribution by Kolmogorov–Smirnov tests. As a normal distribution could not be confirmed for both, nonparametric tests were used to test for significant differences between colonies (Mann–Whitney U test) and treatment groups (Kruskal–Wallis ANOVA). P‐values were adjusted for multiple testing using Bonferroni correction.
2.3. Impact of coinfection
2.3.1. Larvae grafting and in vitro rearing
In a second set up we tested the impact of secondary invaders on larval survival and weight. Grafting, rearing, and infection of larvae were performed as described above using larvae from a strong colony (colony C—queen of German origin) of the university stock. Experiments were run in four replicates. The first replicate contained control and M. plutonius strain 49.3‐infected individuals while the following three replicates additionally included treatments with M. plutonius strain 49.3 combined with Enterococcus faecalis or Paenibacillus alvei.
2.3.2. Bacteria cultivation and infection
M. plutonius strain 49.3 was cultivated and applied as described for the first experiment. On day 3 postinfection with M. plutonius strain 49.3, the larvae received 30 μl of standard larval diet (Crailsheim et al., 2013) mixed with vegetative cells of a secondary invader (E. faecalis or P. alvei, approx. 6 × 10⁴ CFUs per larvae for each bacteria species) or sterile medium (control—just M. plutonius treatment). Enterococcus faecalis (LMG 7937) and Paenibacillus alvei (LMG 13253) were provided by BCCM/LMG Bacteria Collection (Ghent University, Ghent, Belgium) and grown in specific medium as described elsewhere (Erler et al., 2014). The absorbance of both bacterial cultures was adjusted to 0.3 (OD600 nm) and bacteria were fed to larvae as described above (approx. 6 × 10⁴ CFUs per larvae). CFUs for E. faecalis and P. alvei finally consumed by the larvae were determined with 20 μl diluted inoculum (infective diet) (E. faecalis: 1:10,000, 1:100,000; P. alvei: 1:1,000, 1:10,000) and plated on specific solid medium (1.5% agar), as well as noninoculated food. The colonies were counted after 1 day of incubation at 35°C and are given per ml of culture medium (Table S2).
2.3.3. Larval survival and weight
Larval survival was determined as described above but the weight was measured on day eight to account for the growth of the secondary invaders.
2.3.4. Statistics
Survival analysis was performed with a nested Cox regression mixed‐effects model (coxme package in R) fitted by maximum likelihood with treatment as fixed effect and replicate as random effect (treatment groups nested in replicates) to account for the variance in the replicates, as replicates 1 and 3 differed significantly from 2 and 4 but not from each other respectively.
Larval weights were analyzed as described previously.
3. RESULTS
Before examining variable virulence of several natural M. plutonius isolates, we examined the in vitro virulence of a commercially available M. plutonius strain (LMG 20360, ST1, CC13, the only one commercially available) in larvae from colonies of different origin (colony A and B). However, neither a significant impact on larval weight on day 7 (MWU test: W = 2447.5, p = .14, Table S3) nor on larval mortality (Kaplan–Meier survival analysis with log‐rank test, p = .32, Figure S1) was observed in M. plutonius exposed larvae, but a significant weight difference between larvae of different origin (MWU test: W = 2428.5, p < .0001, Table S3) with larvae of colony B being lighter compared to colony A.
3.1. Impact of host background
Comparing overall larval survival of the noninfected control groups for colony A and B revealed a reduced survival rate of larvae grafted from colony B (Kaplan–Meier survival: Z = 3.24, p = .0012). The same effect was observed when pooling all larvae (across all treatment groups) of colony A and B (Z = 5.18, p < .0001), however, with the exception that mortality at the larval stage (day 1–6 postgrafting, Figure 1) was lower for colony B than for colony A. Nevertheless, virulence of the three different M. plutonius strains tested showed to be similar for both colonies. Strain 49.3 (CC3) was the most virulent leading to mortality rates higher than 85% at day 12 postgrafting and differing from all other groups (log‐rank tests, p < .001) (Figure 1). No difference was measured between the noninfected control groups and larvae infected with strain 4–127 (CC13) (log‐rank tests, p > .05) (Figure 1). Variable results for strain virulence have been observed for strain 119 (CC13), showing no difference from controls and larvae infected with 4–127 for colony A and B (log‐rank tests, p > .05). For colony A, the difference in mortality was highly significant between strains 119 and 49.3 (log‐rank test, p < .001) but not for colony B (log‐rank test, p = .017, Bonferroni adjusted significance level: p < .016) (Figure 1). This borderline nonsignificant difference for colony B, following p‐value adjustment, indicates potential variable virulence for strain 119 depending on host genetic background and/or general health conditions of the tested colonies.
Figure 1.
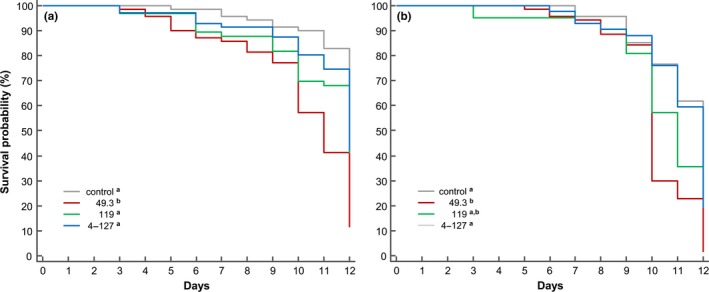
Larval survival over 12 days (starting from day 1—grafting) for control groups and larvae infected with M. plutonius (strain 49.3, 119 and 4‐127) from two unrelated colonies (a) colony A, (b) colony B. Different superscript letters in the legend for treatment groups show significant differences in larval survival, following Kaplan–Meier survival analyses with Bonferroni adjusted posthoc log‐rank tests (p < .016)
Larval weight was again lower for control larvae grafted from colony B (72.21 mg ± 31.96, mean ± SD) compared to colony A (101.25 ± 25.73) (MWU test: Z = 4.59, p < .0001) as well as overall treatment groups (MWU test: Z = 7.44, p < .0001) (Table 1). Weight differences between treatment groups and strains showed similar patterns for colonies A and B. All groups (control, strain 119 and 4–127) did not differ from each other but from 49.3 which had the lightest larvae (colony A: 62.92 mg ± 30.2, colony B: 46.99 mg ± 19.14) (Kruskal–Wallis ANOVA: H colony A = 48.76, H colony B = 31.84, posthoc multiple comparisons: p < .0001 for both) (Table 1). The least significant difference was again observed for colony B with larvae infected with the strains 49.3 and 119 (p = .006, all other comparisons: p < .00015) (Table 1).
Table 1.
Larval weight (mean ± SD) on day 7 (day 6 postinfection) for control groups (uninfected) and larvae infected with M. plutonius (strain 49.3, 119 and 4–127) from two unrelated colonies (A and B)
| Colony | Treatment | Weight (mg) | N |
|---|---|---|---|
| A | Control | 101.3 ± 25.7a | 65 |
| 49.3 | 62.9 ± 30.2b | 59 | |
| 119 | 92.9 ± 33.8a | 58 | |
| 4–127 | 94.7 ± 28.0a | 65 | |
| Total | 247 | ||
| B | Control | 72.2 ± 32.0a | 44 |
| 49.3 | 47.0 ± 19.1b | 76 | |
| 119 | 72.8 ± 41.3a | 38 | |
| 4–127 | 81.1 ± 37.3a | 39 | |
| Total | 197 |
Different superscript letters show significant differences between treatment groups.
The number of colony‐forming units (CFUs) per larva used for infection was different for strains 4–127 in comparison with 49.3 and 119 (One‐way ANOVA with log‐transformed data: F = 8.39, p = .002, Bonferroni posthoc tests: 4–127 vs. 49.3: p = .048, 4–127 vs. 119: p = .001) but not between the last two strains (Bonferroni posthoc test, p > .05) (Table S1). Irrespective of the dilution used to estimate CFUs, 4–127 always grew in much higher CFU number with a smaller size (colony diameter) than for the other two strains (49.3 and 119); at least, on agar plates in the CO2‐incubator.
No differences were detected for the relative M. plutonius infection intensity per larvae neither between colonies (means and 95% confidence intervals; colony A: 0.0070, CI 0.0038–0.0103; colony B: 0.0053, CI 0.0026–0.0081; MWU test: Z = 0.77, p > .05) nor between strains (means and 95% confidence intervals; 49.3: 0.0038, CI 0.0025–0.0051; 119: 0.0068, CI 0.0033–0.0102; 4–127: 0.0088, CI 0.0029–0.0147; Kruskal–Wallis ANOVA: H = 2.03, p > .05). All infected larvae tested were positive for M. plutonius (Cq values across colonies and strains: 21.05 ± 2.05, mean ± SD) and all noninfected control larvae were negative.
3.2. Impact of co‐infection
Although, all infection treatment groups (irrespective of a secondary bacterium combination or solely M. plutonius) had significantly higher mortality rates compared to the noninfected controls (Cox regression mixed‐effects model: p < .001), there was no significant difference between the treatment with M. plutonius only (M) and the treatments with an additional infection (E. faecalis: ME, P. alvei: MP) (log‐rank test pairwise comparisons, Bonferroni adjusted: M‐ME p = .38, M‐MP p = .91, MP‐ME p = .38, Figure 2).
Figure 2.
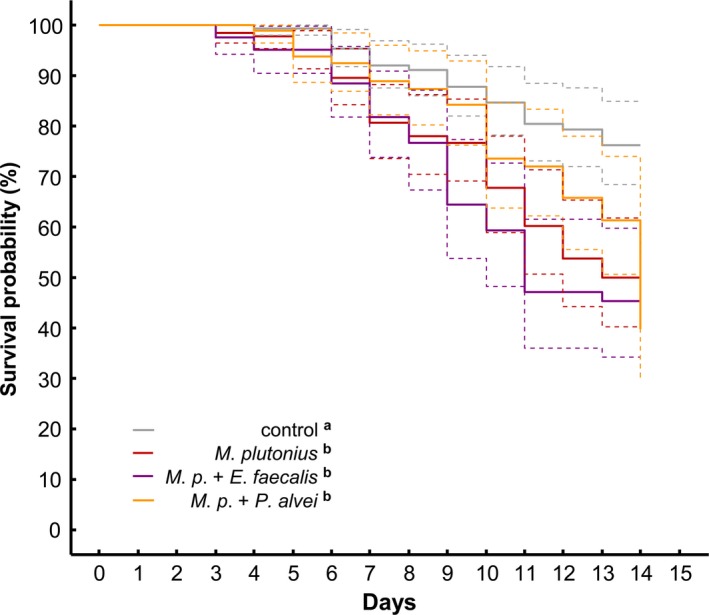
Larval survival over 14 days (starting from day 1—grafting) for control group and larvae infected with M. plutonius strain 49.3, M. plutonius + E. faecalis or M. plutonius + P. alvei. Different superscript letters in the legend for treatment groups show significant differences in larval survival, following nested Cox regression mixed‐effects model analyses with Bonferroni adjusted posthoc log‐rank tests. (Dashed lines: 95% confidence intervals)
For the larval weights we observed a similar outcome. Infection treatments resulted in significantly lower larval weight compared to controls (Kruskal–Wallis ANOVA: H = 16.88, p = .0007; posthoc multiple comparisons, Bonferroni adjusted: M‐C p = .004, ME‐C p = .02, MP‐C p = .02, Table 2) with approx. 15% mean weight reduction in infected individuals (Table 2). Consistently, no weight differences were detected between infected groups (posthoc multiple comparisons, Bonferroni adjusted: M‐ME, M‐MP, MP‐ME p > .05, Table 2).
Table 2.
Larval weight (mean ± SD) on day 8 (day 7 postinfection with M. plutonius strain 49.3) for control groups (uninfected) and larvae infected with M. plutonius strain 49.3 only or M. plutonius and secondary invaders E. faecalis or P. alvei on day 4 (day 3 postinfection with M. plutonius)
| Treatment | Weight (mg) | N |
|---|---|---|
| Control | 134.7 ± 24.3a | 83 |
| M. p. | 113.7 ± 40.0b | 62 |
| M. p. + E. f.* | 115.4 ± 37.7b | 40 |
| M. p. + P. a.* | 113.7 ± 40.6b | 42 |
| Total | 227 |
*M. p. treatment on day 1.
Different superscript letters show significant differences between treatment groups.
The CFUs per larva used for infection varied between replicates, especially in E. faecalis treatments (Table S2), although it did not correlate with larval mortality or weight, neither for M. plutonius infected larvae nor larvae treated with an additional infection.
4. DISCUSSION
In this study, we observed variation in virulence for four different M. plutonius strains and a divergent response of hosts depending on genetic background. Here, the determinative host trait for the resulting variation of pathogen impact seems to be the developmental differences (specifically body size) of the honey bee larvae. Host body size and developmental speed may be crucial factors in host–pathogen interactions where the pathogen may be obliged to multiply as fast as possible to overcome clearance by the host (Cable, Enquist, & Moses, 2007). This might particularly be critical for a pathogen infecting a host via the oral–fecal route. In the case of the honey bee larvae, clearance refers to defecation before pupation. An alternative hypothesis explaining variance in larval susceptibility might be enhanced defense mechanisms of specific host genotypes (McKee et al., 2004).
The observed weight differences of infected larvae of different origin are negatively correlated with mortality (Pearson correlation: n = 8, r = −.97, p < .0001). At larval stage, the mortality of the lighter phenotype (colony B) was lower compared to the heavier one (colony A) (Figure 1). That lower weight appears to be advantageous, is presumably due to reduced multiplication rates of the pathogen. However, in the pupal stage, the apparently slower growth rate of larvae from colony B phenotype led to a reduced nutrient supply during metamorphosis and ultimately resulted in a higher mortality of pupae. Malnutrition caused by M. plutonius infections, leading to reduced larval and pupal weight, was already discussed several times (Bailey, 1959, 1960; Nakamura et al., 2016). However, at this point no inferences could be made on the cause(s) leading to malnutrition, either due to host–pathogen competition for nutrients or due to less nutrients feed to the larvae in the colony or both.
Mortality of the different honey bee strains used for larval infection was strongly influenced by the host background and sequence type of the M. plutonius strain. With the limited number of different sequence types tested per clonal complex (CC3 and CC13), we cannot make any final conclusion on virulence diversity of the different clonal complexes. The most interesting case concerning virulence was strain 119 which can cause variable mortality depending on the host background (Figure 1). In a previous study, M. plutonius strain 119 showed high virulence leading to mortality rates of 70% in 2 weeks (Riessberger‐Gallé, Hernández‐López, Rechberger, Crailsheim, & Schuehly, 2016). This corresponds to the higher virulence in colony B of the current study (Figure 1).
Future studies should investigate additional representative pathogen genotypes of the different clonal complexes or genetically modified strains to understand the connection of M. plutonius genotype and virulence. More importantly, the degree of virulence and the impact of mixed infections with typical and atypical M. plutonius strains is not well understood and adds to a far more complicated picture. In the current study, we exclusively tested typical strains. From previous studies, we know that both M. plutonius strain types can be detected by duplex PCR and cultivation in the same larvae samples (Arai et al., 2014) and several strains (sequence types) might participate in single EFB outbreaks of the same apiary, which, at least in Japan, might be common (Takamatsu et al., 2014).
The results of Giersch et al. (2010) for M. plutonius infections and a disease‐specific secondary invader, could not be confirmed in this study. They found higher mortality and infection rates in M. plutonius‐ and P. alvei‐inoculated larvae and observed much stronger typical symptoms compared to only M. plutonius‐infected larvae. By using a comparative infection assay (time of infections) here, some major differences have to be mentioned. Giersch et al. (2010) used different methods determining bacteria/spore concentrations and CFUs, a different feeding protocol, spores instead of vegetative cells for P. alvei, and genotypes of M. plutonius (putatively CC13, ST4) and P. alvei strains were of Australian origin. At least for adult bees, a recent study showed that single infection with E. faecalis does not decrease mortality (Dickel, Münch, Amdam, Mappes, & Freitak, 2018). This may confirm that we did not find any additive mortality by coinfecting larvae, as previously mentioned by Bailey (1963). However, this is highly speculative and has to be verified by infection experiments with healthy larvae and E. faecalis or P. alvei only.
Although, during the current study there was an EFB‐typical foul smell perceptible in diseased larvae of the M. plutonius/P. alvei treatment as well as in M. plutonius/E. faecalis treatment, no differences for larval mortality or weight were observed for the different infection treatments. Similar to virulence of M. plutonius there might also be strain specificity in the secondary invaders like P. alvei and E. faecalis and they may even originate from the larval gut microbiota (commensals) (Overstreet & Lotz, 2016). So far, we have no conclusive explanation for the different outcome of both infection studies (Giersch et al., 2010; present study), except for the bacterial strains and host genetic background. Both experiments shown here, revealed that infection dose might not play a central role for the outcome of the infection, once a minimum threshold (not determined) has been reached. Similarly, variance in CFUs for M. plutonius and secondary invader correlated neither with mortality, weight, nor with infection intensity.
For artificial infections, the quality of the larval food (batch of royal jelly) seems to be of high importance for infection success (Giersch et al., 2010). M. plutonius cell numbers can be significantly reduced by a highly antimicrobial royal jelly water extract, based on major royal jelly protein 1, fatty acids and other substances (Vezeteu, Bobiş, Moritz, & Buttstedt, 2017; and references therein). We did not examine the resistance of M. plutonius strains to larval food used in this study. However, a recent study showed that clonal complex affiliation and number of days precultured are major factors explaining resistance for in vitro growth in medium containing royal jelly or 10‐hydroxy‐2‐decenoic‐acid (10‐HDA) (Takamatsu, Osawa, Nakamura, Yoshiyama, & Okura, 2017).
Another point of M. plutonius pathogenicity, not analyzed in the current study, is the delay of symptoms under non‐natural conditions. Artificially infected colonies show a disease symptom delay of up to 12 days under natural conditions (Bailey, 1957b). Laboratory artificial infections of bee larvae also lead to a delay in defecation and subsequent, if any, pupation (McKee et al., 2004). The same study described that some larvae even survived the infection and reached pupation. This might be the result of M. plutonius variability of multiplication speed and virulence or host susceptibility.
5. CONCLUSION
The environment of the colony has to be mentioned as an important factor which profoundly affects the course of the disease. However, the details are nearly unknown (Bailey & Locher, 1968; White, 1920). Former studies on M. plutonius epidemiology showed that visible EFB‐symptoms can disappear spontaneously from infected colonies after an epidemic peak (about June in the northern hemisphere) which appears to be unrelated to changes in the susceptibility of the larvae as they still can be infected in vitro (Bailey, 1959, 1960; Burnside, 1938; White, 1920).
To get a deeper understanding of the pathogenicity of M. plutonius and the nature of EFB it is imperative to study the natural epidemiology of the disease in combination with in vitro and in vivo assays investigating the growth and virulence of the diverse M. plutonius types (typical vs. atypical), clonal complexes and genotypes (sequence types). From the current and all previous studies, the whole infection process seems to be a complex interaction of the honey bees’ and M. plutonius genotype, in combination with several secondary invaders.
CONFLICT OF INTEREST
The authors declared no potential conflict of interest.
Supporting information
ACKNOWLEDGMENTS
Financial support was granted by the German Research Foundation—DFG (ER 786/1‐1 to S.E.). Further, we acknowledge the financial support of the Open Access Publication Fund of the Martin‐Luther‐University Halle‐Wittenberg. We are grateful to Sandra Ehrenberg, Juliane Fischer, Jenifer Heidler, and Elisa Kathe for help with lab work, in particular larvae grafting and in vitro rearing; and to Benjamin H Conlon for critical linguistic suggestions and helpful comments. Further, we thank COLOSS (Prevention of honey bee COlony LOSSes) for fostering international collaboration between honey bee researchers. Finally, we greatly acknowledge Jean‐Daniel Charrière (Swiss Bee Research Center, Agroscope) and Eva Forsgren (Swedish University of Agricultural Sciences, Uppsala) for providing the different M. plutonius strains; without their kind support this study would not have been completed.
Lewkowski O, Erler S. Virulence of Melissococcus plutonius and secondary invaders associated with European foulbrood disease of the honey bee. MicrobiologyOpen. 2019;8:e649 10.1002/mbo3.649
Contributor Information
Oleg Lewkowski, Email: oleg.lewkowski@zoologie.uni-halle.de.
Silvio Erler, Email: erler.silvio@gmail.com.
REFERENCES
- Allen, M. F. , & Ball, B. V. (1993). The cultural characteristics and serological relationships of isolates of Melissococcus pluton . Journal of Apicultural Research, 32, 80–88. 10.1080/00218839.1993.11101291 [DOI] [Google Scholar]
- Allen, M. F. , Ball, B. V. , & Underwood, B. A. (1990). An isolate of Melissococcus pluton from Apis laboriosa . Journal of Invertebrate Pathology, 55, 439–440. 10.1016/0022-2011(90)90090-S [DOI] [Google Scholar]
- Arai, R. , Miyoshi‐Akiyama, T. , Okumura, K. , Morinaga, Y. , Wu, M. , Sugimura, Y. , … Takamatsu, D. (2014). Development of duplex PCR assay for detection and differentiation of typical and atypical Melissococcus plutonius strains. Journal of Veterinary Medical Science, 76, 491–498. 10.1292/jvms.13-0386 [DOI] [PMC free article] [PubMed] [Google Scholar]
- Arai, R. , Tominaga, K. , Wu, M. , Okura, M. , Ito, K. , Okamura, N. , … Takamatsu, D. (2012). Diversity of Melissococcus plutonius from honeybee larvae in Japan and experimental reproduction of European foulbrood with cultured atypical isolates. PLoS ONE, 7, e33708 10.1371/journal.pone.0033708 [DOI] [PMC free article] [PubMed] [Google Scholar]
- Bailey, L. (1956). Ætiology of European foul brood; a disease of the larval honey‐bee. Nature, 178, 1130 10.1038/1781130a0 [DOI] [Google Scholar]
- Bailey, L. (1957a). European foul brood: A disease of the larval honeybee (Apis mellifera L.) caused by a combination of Streptococcus pluton (Bacillus pluton White) and Bacterium eurydice White. Nature, 180, 1214–1215. 10.1038/1801214a0 [DOI] [Google Scholar]
- Bailey, L. (1957b). The cause of European foul brood. Bee World, 38, 85–89. 10.1080/0005772X.1957.11094983 [DOI] [Google Scholar]
- Bailey, L. (1959). An improved method for the isolation of Streptococcus pluton, and observations on its distribution and ecology. Journal of Insect Pathology, 1, 80–85. [Google Scholar]
- Bailey, L. (1960). The epizootiology of European foulbrood of the larval honeybee, Apis mellifera Linnaeus. Journal of Insect Pathology, 2, 67–83. [Google Scholar]
- Bailey, L. (1963). The pathogenicity of honey‐bee larvae of microorganisms associated with European foulbrood. Journal of Insect Pathology, 5, 198–205. [Google Scholar]
- Bailey, L. (1974). An unusual type of Streptococcus pluton from the eastern hive bee. Journal of Invertebrate Pathology, 23, 246–247. 10.1016/0022-2011(74)90192-X [DOI] [PubMed] [Google Scholar]
- Bailey, L. (1983). Melissococcus pluton, the cause of European foulbrood of honey bees (Apis spp.). Journal of Applied Bacteriology, 55, 65–69. 10.1111/j.1365-2672.1983.tb02648.x [DOI] [Google Scholar]
- Bailey, L. , & Locher, N. (1968). Experiments on the etiology of European foul brood of the honeybee. Journal of Apicultural Research, 7, 103–107. 10.1080/00218839.1968.11100197 [DOI] [Google Scholar]
- Behrens, D. , Forsgren, E. , Fries, I. , & Moritz, R. F. A. (2010). Lethal infection thresholds of Paenibacillus larvae for honeybee drone and worker larvae (Apis mellifera). Environmental Microbiology, 12, 2838–2845. 10.1111/j.1462-2920.2010.02257.x [DOI] [PubMed] [Google Scholar]
- Belloy, L. , Imdorf, A. , Fries, I. , Forsgren, E. , Berthoud, H. , Kuhn, R. , & Charrière, J.‐D. (2007). Spatial distribution of Melissococcus plutonius in adult honey bees collected from apiaries and colonies with and without symptoms of European foulbrood. Apidologie, 38, 136–140. 10.1051/apido:2006069 [DOI] [Google Scholar]
- Budge, G. E. , Barrett, B. , Jones, B. , Pietravalle, S. , Marris, G. , Chantawannakul, P. , … Brown, M. A. (2010). The occurrence of Melissococcus plutonius in healthy colonies of Apis mellifera and the efficacy of European foulbrood control measures. Journal of Invertebrate Pathology, 105, 164–170. 10.1016/j.jip.2010.06.004 [DOI] [PubMed] [Google Scholar]
- Budge, G. E. , Shirley, M. D. F. , Jones, B. , Quill, E. , Tomkies, V. , Feil, E. J. , … Haynes, E. G. (2014). Molecular epidemiology and population structure of the honey bee brood pathogen Melissococcus plutonius . ISME Journal, 8, 1588–1597. 10.1038/ismej.2014.20 [DOI] [PMC free article] [PubMed] [Google Scholar]
- Burnside, C. E. (1938). Observations on resistance of some dark races of honeybees to European foulbrood. Journal of Economic Entomology, 31, 573–575. 10.1093/jee/31.5.573 [DOI] [Google Scholar]
- Cable, J. M. , Enquist, B. J. , & Moses, M. E. (2007). The allometry of host‐pathogen interactions. PLoS ONE, 2, e1130 10.1371/journal.pone.0001130 [DOI] [PMC free article] [PubMed] [Google Scholar]
- Crailsheim, K. , Brodschneider, R. , Aupinel, P. , Behrens, D. , Genersch, E. , Vollmann, J. , & Riessberger‐Gallé, U. (2013). Standard methods for artificial rearing of Apis mellifera larvae . Journal of Apicultural Research, 52, 1–16. 10.3896/IBRA.1.52.1.05 [DOI] [Google Scholar]
- Dickel, F. , Münch, D. , Amdam, G. V. , Mappes, J. , & Freitak, D. (2018). Increased survival of honeybees in the laboratory after simultaneous exposure to low doses of pesticides and bacteria. PLoS ONE, 13, e0191256 10.1371/journal.pone.0191256 [DOI] [PMC free article] [PubMed] [Google Scholar]
- Ellis, J. D. , & Munn, P. A. (2005). The worldwide health status of honey bees. Bee World, 86, 88–101. 10.1080/0005772X.2005.11417323 [DOI] [Google Scholar]
- Erban, T. , Ledvinka, O. , Kamler, M. , Nesvorna, M. , Hortova, B. , Tyl, J. , … Hubert, J. (2017). Honeybee (Apis mellifera)‐associated bacterial community affected by American foulbrood: Detection of Paenibacillus larvae via microbiome analysis. Scientific Reports, 7, 5084 10.1038/s41598-017-05076-8 [DOI] [PMC free article] [PubMed] [Google Scholar]
- Erler, S. , Denner, A. , Bobiş, O. , Forsgren, E. , & Moritz, R. F. A. (2014). Diversity of honey stores and their impact on pathogenic bacteria of the honeybee, Apis mellifera . Ecology and Evolution, 4, 3960–3967. 10.1002/ece3.1252 [DOI] [PMC free article] [PubMed] [Google Scholar]
- Erler, S. , Lewkowski, O. , Poehlein, A. , & Forsgren, E. (2018). The curious case of Achromobacter eurydice, a Gram‐variable pleomorphic bacterium associated with European foulbrood disease in honeybees. Microbial Ecology, 75, 1–6. 10.1007/s00248-017-1007-x [DOI] [PubMed] [Google Scholar]
- Evison, S. E. F. , Fazio, G. , Chappell, P. , Foley, K. , Jensen, A. B. , & Hughes, W. H. O. (2013). Host‐parasite genotypic interactions in the honey bee: The dynamics of diversity. Ecology and Evolution, 3, 2214–2222. 10.1002/ece3.599 [DOI] [PMC free article] [PubMed] [Google Scholar]
- Forsgren, E. (2010). European foulbrood in honey bees. Journal of Invertebrate Pathology, 103, S5–S9. 10.1016/j.jip.2009.06.016 [DOI] [PubMed] [Google Scholar]
- Forsgren, E. , Budge, G. E. , Charrière, J.‐D. , & Hornitzky, M. A. Z. (2013). Standard methods for European foulbrood research. Journal of Apicultural Research, 52, 1–14. 10.3896/IBRA.1.52.1.12 [DOI] [Google Scholar]
- Forsgren, E. , Lundhagen, A. C. , Imdorf, A. , & Fries, I. (2005). Distribution of Melissococcus plutonius in honeybee colonies with and without symptoms of European foulbrood. Microbial Ecology, 50, 369–374. 10.1007/s00248-004-0188-2 [DOI] [PubMed] [Google Scholar]
- Gaggia, F. , Baffoni, L. , Stenico, V. , Alberoni, D. , Buglione, E. , Lilli, A. , … Porrini, C. (2015). Microbial investigation on honey bee larvae showing atypical symptoms of European foulbrood. Bulletin of Insectology, 68, 321–327. [Google Scholar]
- Genersch, E. , Ashiralieva, A. , & Fries, I. (2005). Strain‐ and genotype‐specific differences in virulence of Paenibacillus larvae subsp. larvae, a bacterial pathogen causing American foulbrood disease in honeybees. Applied and Environmental Microbiology, 71, 7551–7555. 10.1128/AEM.71.11.7551-7555.2005 [DOI] [PMC free article] [PubMed] [Google Scholar]
- Giersch, T. , Barchia, I. , & Hornitzky, M. (2010). Can fatty acids and oxytetracycline protect artificially raised larvae from developing European foulbrood? Apidologie, 41, 151–159. 10.1051/apido/2009066 [DOI] [Google Scholar]
- Haynes, E. , Helgason, T. , Young, J. P. W. , Thwaites, R. , & Budge, G. E. (2013). A typing scheme for the honeybee pathogen Melissococcus plutonius allows detection of disease transmission events and a study of the distribution of variants. Environmental Microbiology Reports, 5, 525–529. 10.1111/1758-2229.12057 [DOI] [PubMed] [Google Scholar]
- McKee, B. A. , Djordjevic, S. P. , Goodman, R. D. , & Hornitzky, M. A. (2003). The detection of Melissococcus pluton in honey bees (Apis mellifera) and their products using a hemi‐nested PCR. Apidologie, 34, 19–27. 10.1051/apido:2002047 [DOI] [Google Scholar]
- McKee, B. A. , Goodman, R. D. , & Hornitzky, M. A. (2004). The transmission of European foulbrood (Melissococcus plutonius) to artificially reared honey bee larvae (Apis mellifera). Journal of Apicultural Research, 43, 93–100. 10.1080/00218839.2004.11101117 [DOI] [Google Scholar]
- Nakamura, K. , Yamazaki, Y. , Shiraishi, A. , Kobayashi, S. , Harada, M. , Yoshiyama, M. , … Takamatsu, D. (2016). Virulence differences among Melissococcus plutonius strains with different genetic backgrounds in Apis mellifera larvae under an improved experimental condition. Scientific Reports, 6, 33329 10.1038/srep33329 [DOI] [PMC free article] [PubMed] [Google Scholar]
- Overstreet, R. M. , & Lotz, J. M . (2016). Chapter 2: Host‐symbiont relationships: Understanding the change from guest to pest In: Hurst C. J. (Eds.), The rasputin effect: When commensals and symbionts become parasitic. advances in environmental microbiology 3. Switzerland: Springer; 10.1007/978-3-319-28170-4_2 [DOI] [Google Scholar]
- Pinnock, D. E. , & Featherstone, N. E. (1984). Detection and quantification of Melissococcus pluton infection in honeybee colonies by means of enzyme‐linked immunosorbent assay. Journal of Apicultural Research, 23, 168–170. 10.1080/00218839.1984.11100627 [DOI] [Google Scholar]
- Riessberger‐Gallé, U. , Hernández‐López, J. , Rechberger, G. , Crailsheim, K. , & Schuehly, W. (2016). Lysophosphatidylcholine acts in the constitutive immune defence against American foulbrood in adult honeybees. Scientific Reports, 6, 30699 10.1038/srep30699 [DOI] [PMC free article] [PubMed] [Google Scholar]
- Roetschi, A. , Berthoud, H. , Kuhn, R. , & Imdorf, A. (2008). Infection rate based on quantitative real‐time PCR of Melissococcus plutonius, the causal agent of European foulbrood, in honeybee colonies before and after apiary sanitation. Apidologie, 39, 362–371. 10.1051/apido:200819 [DOI] [Google Scholar]
- Takamatsu, D. , Morinishi, K. , Arai, R. , Sakamoto, A. , Okura, M. , & Osaki, M. (2014). Typing of Melissococcus plutonius isolated from European and Japanese honeybees suggests spread of sequence types across borders and between different Apis species. Veterinary Microbiology, 171, 221–226. 10.1016/j.vetmic.2014.03.036 [DOI] [PubMed] [Google Scholar]
- Takamatsu, D. , Osawa, A. , Nakamura, K. , Yoshiyama, M. , & Okura, M. (2017). High‐level resistance of Melissococcus plutonius clonal complex 3 strains to antimicrobial activity of royal jelly. Environmental Microbiology Reports, 9, 562–570. 10.1111/1758-2229.12590 [DOI] [PubMed] [Google Scholar]
- Tarr, H. L. A. (1936). Studies on European foul brood of bees II. The production of the disease experimentally. Annals of Applied Biology, 23, 558–584. 10.1111/j.1744-7348.1936.tb06111.x [DOI] [Google Scholar]
- Vezeteu, T. V. , Bobiş, O. , Moritz, R. F. A. , & Buttstedt, A. (2017). Food to some, poison to others ‐ honeybee royal jelly and its growth inhibiting effect on European Foulbrood bacteria. MicrobiologyOpen, 6, e00397 10.1002/mbo3.397 [DOI] [PMC free article] [PubMed] [Google Scholar]
- White, G. F . (1912). The cause of European foul brood. U.S. Department of Agriculture, Circular No. 157, p. 1‐15.
- White, G. F . (1920). European foulbrood. U.S. Department of Agriculture, Bulletin No. 810, p. 1‐48.
Associated Data
This section collects any data citations, data availability statements, or supplementary materials included in this article.
Supplementary Materials