

Abstract
Background
Several preliminary analyses suggested an association between neprilysin (NEP) levels and myocardial infarction.
Hypothesis
The objective was to assess whether NEP plasma levels following reperfusion might be a surrogate for infarct size (IS) or predict adverse outcomes in acute ST‐segment elevation myocardial infarction (STEMI) patients.
Methods
We measured NEP levels in a prospective cohort of 203 patients with STEMI referred for primary percutaneous coronary intervention. Circulating soluble NEP was measured by enzyme‐linked immunosorbent assay at admission (t0) and 4 hours later (t4) following reperfusion and on 7 times points (t0, t4, t12, t24, t48, day 7 and day 30) in a subset of 21 patients. IS and left ventricular ejection fraction (LVEF) were measured at 1 month by cardiac magnetic resonance. Adverse cardiovascular outcomes were collected at 12‐month follow‐up.
Results
Median t0 and t4 NEP levels in 203 patients were respectively 88.3 pg/mL (interquartile range [IQR] [14; 375.4]) and 101.5 pg/mL (IQR [18.5; 423.8]). These levels remained unchanged over 1 month (P = 0.70). NEP levels did not correlate significantly with IS (P = 0.51) or LVEF (P = 0.34). There was no correlation between NEP and troponin, creatine kinase and interleukin‐6 levels at h0 and h4. NEP levels above the median were not associated with adverse outcomes at follow‐up (hazard ratio = 1.28, 95% confidence interval [0.69; 2.37]; P = 0.42).
Conclusions
NEP serum levels were widely distributed and did not change significantly in the first hours and 1‐month period following reperfusion in STEMI patients. There was no significant relationship with markers of infarct size and inflammation, and 1‐year adverse outcomes.
Keywords: CMR, interleukine‐6, neprilysin, STEMI
ABBREVIATIONS
- ARNI
angiotensin receptor‐neprilysin inhibitors
- BNP
brain natriuretic peptide
- CALLA
common acute lymphoblastic leukemia antigen
- CK
creatine kinase
- CMR
cardiac magnetic resonance
- CRP
C‐reactive protein
- DE
delayed enhancement
- ELISA
enzyme‐linked immunosorbent assay
- EQ5D
EuroQol Group questionnaire
- HR
hazard ratio
- IL‐6
interleukin‐6
- IQR
interquartile range
- IS
infarct size
- LAD
left anterior descending
- LV
left ventricular
- LVEDV
left ventricular end diastolic volume index
- LVESV
left ventricular end systolic volume index
- LVEF
left ventricular ejection fraction
- MI
myocardial infarction
- NEP
neprilysin
- NYHA
New York Heart Association
- PCI
percutaneous coronary intervention
- STEMI
ST‐segment elevation myocardial infarction
- TIMI
thrombolysis in myocardial infarction
1. INTRODUCTION
Neprilysin (NEP) is a zinc metalloprotease that was initially identified in the brush border of rabbit proximal renal tubule microvilli,1 and later in multiple organs, such as the brain, lungs, heart, kidneys, testes, as well as in adipose tissue.2 It is known under different names, including endopeptidase‐24.11, CD10, enkephalinase, neutral endopeptidase, and common acute lymphoblastic leukemia antigen (CALLA).3, 4 The molecular weight of NEP is 93 kDa, and this ubiquitous enzyme can be a soluble circulating enzyme or present on the plasma membranes of neutrophils.5 Its biological effects are broad and include insulin regulation, inflammation control, natriuretic peptide degradation in cardiovascular disease, and beta‐amyloid degradation in the brain.5
In cardiovascular disease, several studies have shown that NEP is involved in the regulation of vasodilator peptides, such as natriuretic peptides, angiotensin II, bradykinin, substance P, adrenomedullin, and endothelin‐1.2 Recent clinical studies indicate a significant relationship between NEP levels and adverse outcomes in acute6 and chronic heart failure.7 Furthermore, in the recent PARADIGM trial, NEP inhibition combined with angiotensin II receptor blockade by LCZ696 induced a significant improvement of adverse outcomes in chronic heart failure patients compared to angiotensin‐converting enzyme ‐inhibitors alone.8
Preliminary studies suggest an effect of NEP on natriuretic peptide degradation, inflammation, and myocardial remodeling after myocardial infarction (MI). Lueder et al.9 and Suematsu et al.10 showed that angiotensin receptor‐NEP inhibitors (ARNI) significantly attenuated myocardial remodeling and contractile dysfunction in an experimental model of acute MI. Some studies report a role of NEP directly or secondarily to natriuretic peptides on wall stress reduction, atherosclerotic regulation, and inflammatory response after MI.5, 11, 12, 13, 14, 15, 16 However, to the best of our knowledge, whether NEP plasma levels are related to infarct size and predict clinical outcomes has never been investigated in acute MI patients.
The objective of the present study was, therefore, to assess NEP levels and its kinetics following reperfusion in acute ST‐segment elevation myocardial infarction (STEMI) patients and assess their relationship with infarct size and adverse outcomes.
2. METHODS
From March 2012 to October 2015, all patients admitted for acute STEMI to the cardiology department of the Louis Pradel University Hospital (Lyon, France) and for whom the clinical decision was made to treat with percutaneous coronary intervention (PCI) were included. An additional sample of 21 consecutive patients with the same characteristics was included in 2017 (January to June) to measure NEP levels over 1 month after acute MI repeatedly.
STEMI was defined according to the current consensus statement of the European Society of Cardiology, that is, the presence of clinical symptoms of ischemia associated with an ST elevation of more than 0.2 mV in 2 contiguous leads on a standard 12‐lead electrocardiogram and significant troponin elevation.17
All participants provided written informed consent, and the local ethics committee approved the study design and protocol.
2.1. Blood sampling protocol and NEP measurement
Two blood samples were collected for each patient. The first one was collected at admission in the catheterization laboratory (h0) and the second one 4 hours after admission (h4) in the cardiac intensive care unit.
For the additional subset of 21 patients, five samples were collected at 12 hours (h12), 24 hours (h24), 48 hours (h48), 7 days (d7) and 1 month (M1) after admission in the cardiac intensive care unit. All samples were stored at −80°C at the hospital biobank (NeuroBioTec Biological Resource Center) as 500 μL aliquots of serum that were used to analyze NEP levels. NEP and Interleukine‐6 (IL‐6) were analyzed on samples that had not been freeze‐thawed.
NEP was measured using an enzyme‐linked immunosorbent assay (ELISA) kit (R&D systems, Minneapolis); reproducibility of measurements was assessed by performing two independent measurements in 19 patients (R = 0.98). IL‐6 was measured using an ELISA kit (eBioscience, San Diego). Troponin I and total creatine kinase (CK) were measured at the same times using immunoanalyzer Architect Abbott with electro‐chemiluminescence for troponin I and enzymatic method with spectrophotometric measurement for CK.
2.2. Clinical data
Ongoing medication, medical history, cardiovascular risk factors, co‐morbidities, thrombolysis in MI (TIMI) flow grade (at admission and end of PCI), ischemic time (defined as the time between first symptoms to complete revascularization by PCI) were recorded prospectively for each patient at the time of their admission.
2.3. Cardiac magnetic resonance protocol and image analysis
One month after admission for MI, patients underwent a complete CMR investigation. All patients were scanned in a supine position on a 1.5 T MAGNETOM Avanto TIM system (Siemens, Erlangen, Germany).
Cine free precession sequences in multiple planes (two chambers, four chambers, and ventricular short axis planes) were used for quantitative ventricular measurements.
Myocardial delayed enhancement (DE) sequences were performed 10‐15 minutes after the administration of 0.2 mmol/kg gadolinium‐based contrast agent. DE was performed in short‐ and long‐axis planes with a non‐selective 180° inversion recovery pre‐pulse and TI nulling adjustment.
Infarct size was obtained using CMRSegTools segmentation plugin (CREATIS, Lyon, France) with OsiriX software (Pixmeo, Geneva, Switzerland). Late gadolinium enhancement regions were quantified with a full‐width at half maximum algorithm,18 and infarct size was expressed as a percentage of left ventricular (LV) mass.
Left ventricular ejection fraction (LVEF), left ventricular end‐diastolic volume index (LVEDV), LV end‐systolic volume index (LVESV), and LV mass were measured offline on all short‐axis views in the cine images (Philips View Forum, Philips Healthcare, Amsterdam, the Netherlands).
2.4. Follow‐up and clinical outcomes
All patients were followed‐up in 2017 by a trained clinical research coordinator. The patient's vital status, any adverse cardiovascular events (hospitalization for acute heart failure, new acute MI, or hospitalization for any other cardiovascular cause (including hospitalization for heart arrhythmia, chest pain, and pericarditis), the New York Heart Association (NYHA) score, and quality of life using the EuroQol Group questionnaire EQ5D19 were recorded during a telephone interview and completed from patient's hospital record.
There was no event adjudication committee, and all cardiovascular events were collected from phone interviews and corresponding hospitalization reports when available.
2.5. Statistical analysis
Categorical variables are expressed as numbers (percentage). Quantitative variables are expressed as the mean ± SD or median with interquartile range (IQR) for variables with non‐normal distribution. Correlations were analyzed using Pearson correlation test. Bivariate comparisons were made using Student's t test for continuous variables or the Wilcoxon test when assumptions were not validated. Quartile comparison and evolution of NEP serum concentration over time were made using anova or Kruskal Wallis test when assumptions were not validated. χ 2 tests (or Fisher's exact test when the expected cell frequency was <5) were used for categorical variables. Log‐transformations were used for variables with a non‐normal distribution such as NEP, troponin, and CK.
Survival curves were constructed using the Kaplan‐Meier method. The statistical significance between NEP quartile groups was evaluated using the Log‐rank test. No adjustment was performed to estimate the relationship between NEP levels and outcomes in the Cox proportional hazards model (univariate analysis). We further examined the potential relationship between NEP levels and clinical outcomes using a nonlinear fit. For this, we built a restricted cubic spline Cox model and penalized splines Cox model. Statistical analyses were performed with two‐tailed α set to 0.05 and using R statistical software version 3.3.3 (March 6, 2017) “Another Canoe.”
3. RESULTS
3.1. Baseline characteristics
A total of 203 patients were admitted for acute STEMI and had a CMR 1 month later. The mean age was 58 ± 12 years, and 77% were male. Median (IQR) ischemia time was 165 (108‐240) minutes. The culprit vessel was the left anterior descending (LAD) for 95 (47%) and a non‐LAD coronary artery for 106 (52%) patients. Optimal angiographic reperfusion with a TIMI flow >2 was obtained in 185 (95%) patients.
3.2. NEP levels and other biomarkers
NEP levels and their distribution at h0 and h4 are reported in Figure 1. At admission (h0), median NEP serum concentration was 88.3 pg/mL (IQR [14; 375.4]) and 4 hours later (h4), it was 101.5 pg/mL (IQR [18.5; 423.8]; P = 0.70). Conversely, there were a significant increase in troponin median from 0.5 μg/L (IQR [0.1; 2.6]) at h0 to 33.8 μg/L (IQR [9.2; 74.2] at h4, P < 0.0001). CK median raised from 229.5 UI/L (IQR [113.8; 502]) at h0 to 1523 UI/L (IQR [671; 3059.5] at h4, P < 0.0001) and median IL‐6 from 1.5 pg/L (IQR [0.9; 2.4]) at t0 to 2.4 pg/L (IQR [1.6; 4.3] at h4, P < 0.0001). NEP was not detectable in 18 (8.9%) patients.
Figure 1.

Neprilysin levels and distributions at t0 and t4. There was no significant variation and a wild distribution of neprilysin between admission and 4 hours later
For the subset of 21 patients, there was no significant variation of NEP levels over the whole time period overall (P = 0.7). Median NEP serum concentration was 239.7 pg/mL (IQR [133.8; 595.6]) at h0, 253.5 pg/mL (IQR [117.6; 635.9] at h4), 230.5 pg/mL (IQR [120.3; 627.3] at h12), 234 pg/mL (IQR [123.9; 656.9] at h24), 209.9 pg/mL (IQR [111.8; 617.8] at h48), 168.4 pg/mL (IQR [40.76; 439.8] at d7), and 143.9 pg/mL (IQR [23.44; 447.6] at M1).
NEP serum concentration at h0 and h4 did not correlate with inflammatory makers; IL‐6 (r = 0.01, P = 0.89 at h0 and r = 0.03, P = 0.62 at h4), C‐reactive protein (CRP) (r = 0.01, P = 0.52 at h0 and r = 0.01, P = 0.51 at h4), and leucocytes (r = 0.12, P = 0.09 at h0 and r = 0.12, P = 0.08 at h4).
All clinical, biological, and CMR characteristics according to quartile NEP admission levels are reported in Tables 1, 2, 3. There was no significant difference in clinical characteristics, biomarker characteristics (Table 1), and CMR parameters between patients stratified according to h0 NEP concentration quartiles (Table 1) except for LVESV and LVEDV.
Table 1.
Biological and cardiac magnetic resonance characteristics according to t0 neprilysin levels quartiles
| Total | Quartile 1 | Quartile 2 | Quartile 3 | Quartile 4 | P‐value | |
|---|---|---|---|---|---|---|
| n = 203 | n = 50 | n = 51 | n = 51 | n = 51 | ||
| Neprilysin at admission t0 (pg/mL) | 88.3 (14; 375.4) | 3.5 (0; 7.9) | 43.2 (29.4; 65.2) | 185.8 (137.3; 247.3) | 1321.2 (595.6; 2753.6) | — |
| Admission biological characteristics | ||||||
| Serum creatinine (μmol/L) | 75.9 ± 21.7 | 74.7 ± 15.1 | 79.9 ± 29.5 | 74 ± 20.7 | 74.7 ± 18.6 | 0.504 |
| Hemoglobin (g/L) | 13.9 ± 1.6 | 13.6 ± 1.7 | 13.9 ± 1.7 | 13.9 ± 1.6 | 14.2 ± 1.4 | 0.437 |
| CRP (mg/L) | 2.9 (1.5; 6) | 2 (1.2; 3) | 3.6 (2.7; 8) | 3.8 (2.1; 7.6) | 1.8 (1.1; 3.1) | 0.111 |
| Leucocytes (G/L) | 11.9 ± 4.1 | 11.9 ± 4.5 | 10.9 ± 3.1 | 12 ± 3.4 | 13 ± 5 | 0.073 |
| t0 IL‐6 | 1.5 (0.9; 2.4) | 1.3 (0.9; 2.2) | 1.5 (1; 2.3) | 1.8 (1.1; 2.6) | 1.1 (0.6; 2.1) | 0.063 |
| t4 IL‐6 | 2.4 (1.6; 4.3) | 2.4 (1.6; 4.3) | 2.5 (1.6; 4.2) | 2.8 (1.9; 5) | 2 (1.2; 3.2) | 0.036 |
| t4 troponin (μg/mL) | 33.8 (9.2; 74.2) | 44.4 (15.2; 119.7) | 41.5 (8.8; 71.5) | 35.5 (12.2; 76.6) | 28.6 (6; 66.1) | 0.234 |
| t4 CK (UI/L) | 1523 (671; 3059.5) | 1794 (733.8; 3514.5) | 1501.5 (631.8; 2595.5) | 1452.5 (713.5; 3150.5) | 1416 (503.5; 2723.5) | 0.665 |
| CMR at 1 month | ||||||
| LV ejection fraction (%) | 57 ± 12 | 54 ± 11 | 59 ± 11 | 57 ± 13 | 57 ± 12 | 0.12 |
| LV end‐diastolic volume index (mL/m2) | 77.1 ± 40.7 | 81.9 ± 46.2 | 61.9 ± 19.1 | 77.4 ± 39.5 | 87.3 ± 48 | 0.011 |
| LV end‐systolic volume index (mL/m2) | 35.2 ± 24.8 | 40.9 ± 31.6 | 26.4 ± 12.3 | 35.2 ± 24.5 | 38.4 ± 25.1 | 0.021 |
| Infarct size (% of LV mass) | 13.4 ± 9.2 | 13.7 ± 9.8 | 11.8 ± 8.1 | 14.7 ± 10.1 | 13.4 ± 8.6 | 0.50 |
CRP, C‐reactive protein; CMR, cardiac magnetic resonance; IL, Interleukin; LV, left ventricular; CK, creatine kinase.
Data are presented as percentage or as mean ± SD or median with IQR.
Table 2.
Demographics, medical history, procedural, and hemodynamics characteristics according to t0 neprilysin levels quartiles
| Total | Quartile 1 | Quartile 2 | Quartile 3 | Quartile 4 | P‐ value | |
|---|---|---|---|---|---|---|
| n = 203 | n = 50 | n = 51 | n = 51 | n = 51 | ||
| Demographics | ||||||
| Age, years | 58 ± 12 | 59 ± 12 | 58 ± 11 | 58 ± 12 | 56 ± 11 | 0.589 |
| Male sex, n (%) | 156 (77) | 38 (76) | 39 (76) | 37 (73) | 42 (82) | 0.7 |
| Body mass index, kg/m2 | 27 ± 4.5 | 26.2 ± 4.6 | 27.4 ± 4.4 | 27 ± 3.7 | 27.5 ± 5.1 | 0.476 |
| Medical history | ||||||
| History of coronary artery disease, n (%) | 15 (7) | 2 (4) | 5 (10) | 2 (4) | 6 (12) | 0.392 |
| Current smoking, n (%) | 137 (67) | 33 (66) | 32 (63) | 38 (75) | 34 (67) | 0.629 |
| Diabetes mellitus, n (%) | 35 (17) | 4 (8) | 9 (18) | 10 (20) | 12 (24) | 0.203 |
| Hypertension, n (%) | 79 (39) | 18 (36) | 22 (43) | 18 (35) | 21 (41) | 0.813 |
| Dyslipidemia, n (%) | 65 (32) | 11 (22) | 21 (41) | 18 (35) | 15 (29) | 0.197 |
| Procedural and clinical characteristics | ||||||
| Ischemia time (min) | 165 (107.5; 240) | 150 (105; 206.8) | 165 (110; 275) | 175 (107.5; 308) | 170 (120; 213) | 0.899 |
| Killip class at admission, n (%) | — | — | — | — | — | 0.982 |
| I | 181/197 (92) | 45/49 (92) | 47/51 (92) | 45/49 (92) | 44/48 (92) | — |
| II | 14/197 (7) | 3/49 (6) | 4/51 (8) | 4/49 (8) | 3/48 (6) | — |
| III | 2/197 (1) | 1/49 (2) | 0/51 (0) | 0/49 (0) | 1/48 (2) | — |
| IV | 0/197 (0) | 0/49 (0) | 0/51 (0) | 0/49 (0) | 0/48 (0) | — |
| Admission hemodynamics characteristics | ||||||
| Systolic blood pressure (mm hg) | 125 ± 25 | 127 ± 24 | 128 ± 25 | 120 ± 24 | 125 ± 27 | 0.413 |
| Heart rate (beats/min) | 76 ± 15 | 74 ± 15 | 74 ± 16 | 77 ± 15 | 79 ± 14 | 0.301 |
Data are presented as percentage or as mean ± SD or median with inter quartile range.
Table 3.
One‐year follow‐up characteristics according to t0 neprilysin levels quartiles
| Total | Quartile 1 | Quartile 2 | Quartile 3 | Quartile 4 | P‐value | |
|---|---|---|---|---|---|---|
| n = 203 | n = 50 | n = 51 | n = 51 | n = 51 | ||
| Follow up | ||||||
| VO2 max at 1 month (mL/kg/min) | 18.5 ± 4.8 | 19.4 ± 4.9 | 17.4 ± 3.7 | 18.4 ± 4.2 | 19 ± 6.1 | 0.32 |
| 1 month BNP (pg/mL)* | 130 (58.2; 380.5) | 289 (134; 628.5) | 546 (471; 965) | 133 (55; 304.5) | 58 (37; 94) | 0.001 |
| Events at 1 year, n (%) | 41 (21) | 7 (14) | 12 (24) | 13 (27) | 9 (20) | 0.485 |
| NYHA at 1 year, n (%) | — | — | — | — | — | 0.123 |
| I | 138/178 (78) | 34/42 (81) | 31/45 (69) | 33/46 (72) | 40/45 (89) | — |
| II | 30/178 (17) | 4/42 (10) | 11/45 (24) | 10/46 (22) | 5 / 45 (11) | — |
| III | 9/178 (5) | 3/42 (7) | 3/45 (7) | 3/46 (7) | 0/45 (0) | — |
| IV | 1/178 (1) | 1/42 (2) | 0/45 (0) | 0/46 (0) | 0/45 (0) | — |
| EQ5D score | 0.85 ± 0.23 | 0.84 ± 0.23 | 0.85 ± 0.22 | 0.86 ± 0.2 | 0.84 ± 0.28 | 0.965 |
| EQ5D VAS | 69 ± 18 | 69 ± 16 | 71 ± 16 | 66 ± 2 | 70 ± 1 | 0.84 |
Abbreviations: BNP, brain natriuretic peptide; EQ5D: EuroQuol‐5 dimension; NYHA: New York Heart Association; VAS visual analog scale; VO2max: maximal aerobic capacity.
Data are presented as percentage or as mean ± SD or median with IQR. *Brain Natriuretic Peptide (BNP) levels were available only in 42/203 patients.
3.3. CMR results
One month after MI, infarct size averaged 13.4 ± 9.2% of the LV mass, LVEF was 57 ± 12%, LVEDV was 77.1 ± 40.7 mL/m2, and LVESV was 35.2 ± 24.8 mL/m2.
Four hours after revascularization, NEP concentration did not correlate with infarct size (r = 0.05, P = 0.50), nor with LVEF (r = 0.07, P = 0.12). However, there was a significant relationship between NEP and LVEDV (r = 0.01, P = 0.011), and LVESV (r = 0.04, P = 0.021) (Table 1). Troponin I (r = 0.63, P < 0.001) and CK (r = 0.7, P < 0.001) concentration at h4 were significantly correlated to infarct size.
3.4. Follow‐up and adverse events
During a mean ± SD follow‐up period of 18.5 ± 9.6 months, 3 (1%) patients died (all from cardiovascular causes), 4 (2%) were hospitalized for acute heart failure, 13 (6%) were admitted for a new acute MI, and 21 (10%) were hospitalized for another cardiovascular cause. There was no significant difference in rate of adverse events for patients with NEP level at h0 above the median vs patient with NEP level at h0 below the median (hazard ratio = 1.28, 95% confidence interval [0.69; 2.37]; P = 0.42). Kaplan‐Meier survival curves according to NEP levels are presented in Figure 2.
Figure 2.
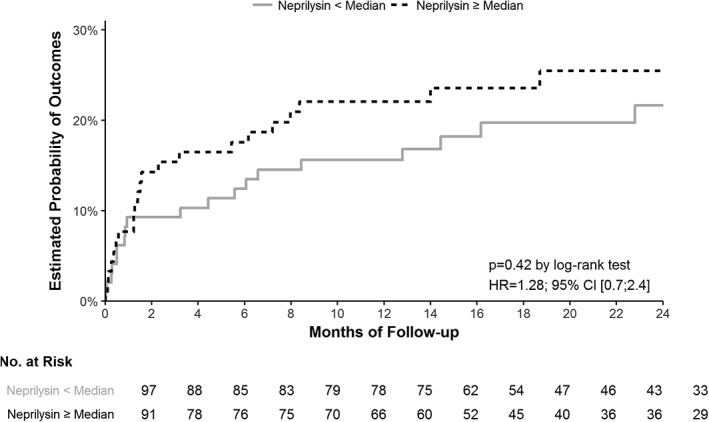
Kaplan‐Meier curves for the composite outcome of death from any cause, myocardial infarction or hospitalization for cardiovascular cause according to t0 neprilysin (NEP) levels. There was no relationship between NEP level and adverse cardiovascular events: hazard ratio = 1.28, 95% confidence interval [0.69; 2.37]; P = 0.42
In the nonlinear restricted cubic spline cox and penalized splines Cox models, we observed test statistic value of 3.76 on 3.1° of freedom with a P‐value of 0.30. Thus, the nonlinear fit showed that there was no particular NEP level in which a change in NEP was statistically associated with an increase or decrease of outcomes.
4. DISCUSSION
The present study found that, (a) there was no significant variation in NEP serum concentration following reperfusion after STEMI, as opposed to troponin I, CK, and IL‐6; (b) NEP levels did not significantly change over 1‐month period following myocardial infarction; (c) there was no correlation between NEP concentration and infarct size or LVEF measured by CMR, and (d) no significant relationship between NEP level and adverse cardiovascular events.
To our knowledge, our study is the first to thoroughly assess the serum kinetics of NEP in the specific setting of acute myocardial infarction. A few published studies that have investigated NEP in patients with heart failure found that serum levels were increased.6, 7, 20, 21 In heart failure patients with reduced ejection fraction, NEP levels are consistently reported above 300 pg/mL. Bayes‐Genis et al. reported levels in acute heart failure patients (median: 670 pg/mL, IQR [370;1290])6 and in chronic heart failure patients (median: 642 pg/mL IQR [385;1219])).7 In heart failure patients with preserved ejection fraction, Goliasch et al.21 reported even higher levels of NEP (median: 2862 pg/mL, IQR [2068;3827]). Vodovar et al.20 also found increased NEP levels in patients with noncardiac dyspnea (median: 256 pg/mL, IQR [58;339]) compared to healthy volunteers, which indicates that NEP is not specific of myocardial disease and can be found in several pathological situations different from heart failure. The use of different assays between all these studies precludes a firm conclusion. Also, taken together these reports highlight the wide distribution of NEP values within different populations, which was also found herein. Notably, in our study, almost a 10th of patients had undetectable NEP, and the distribution was not normally‐shaped with a wide range of values.
Another finding in our study is the absence of specific patient phenotype associated with the different NEP quartiles. There was no significant difference between patients stratified according to NEP level regarding clinical, biological, or myocardial characteristics except for LV volumes. In previous studies, higher levels of NEP were significantly associated with adverse outcomes in acute and chronic heart failure patients.6, 7 To the best of our knowledge, except a modest correlation with age7 (r = 0.16; P < 0.001) this is the only clinical status associated with NEP levels. In these previous studies also, there was little data on any clinical phenotype and NEP levels. There was no relationship with gender, LVEF, heart failure etiology, treatment during admission, number of hospitalization days, or initial NT‐proBNP levels. Bayes‐Genis et al. only reported a trend toward more frequent NEP reduction in nonischemic patients.
We find a significant nonlinear link between LV volumes and NEP. Experimental studies have shown that NEP inhibition in combination with angiotensin receptor blockade significantly reduced LV remodeling, myocardial fibrosis, and improved myocardial function following myocardial infarction.9, 10 However, the direct and specific effect of NEP on LV remodeling remains unknown. One hypothesis is that increased NEP levels are required to face the increased production of natriuretic peptides by hearts stretched by the ischemia‐reperfusion insult. Further experimental and clinical studies are needed to explore this pathophysiology.
Concerning NEP serum kinetics, very little is known. Bayes‐Genis et al. reported a NEP significant decrease in acute heart failure patients between admission and discharge (700 pg/mL vs 520 pg/mL, respectively, P = 0.06).6 Herein, there was no significant difference in serum NEP concentration between admission and 4 hours following reperfusion. NEP levels also remained stable over a 1 month period for a subgroup of 21 patients. Conversely, there was a significant increase of CK and troponin I between h0 and h4, while we found no correlation between NEP and CMR infarct size. This strongly suggests that NEP is not a marker of the severity of the acute ischemia‐reperfusion injury.
There is a significant inflammatory response that occurs at reperfusion including a massive infiltration of the injured myocardium. We did not find a significant correlation between NEP and inflammatory biomarkers, such as CRP, leucocytes, or IL‐6 ‐ an early inflammatory biomarker secreted after myocardial injury.22, 23 Even in late measures of NEP in our subgroup of 21 patients, we did not observe a detectable variation unlike what is seen after acute MI for NT pro‐BNP or CRP.23, 24, 25, 26
Another exploratory finding of the present study was the absence of association of NEP levels with adverse cardiovascular events during follow‐up. In previous studies, higher levels of NEP have been significantly associated with adverse outcomes in acute and chronic heart failure patients.6, 7 It was possibly because of a lack of statistical power.
4.1. Study limitations
The study has limitations. First, we might have missed important information because of the absence of measurement of NEP levels beyond h4. The absence of noticeable NEP serum variation in our subset of 21 patients, however, suggests that this late modification in NEP levels likely does not exist. Second, the lack of statistical power when compared to larger trials render the consideration of clinical outcomes only exploratory.27 Third, Bayes‐Genis et al.28 and Vodovar et al.20 showed a modest correlation between circulation NEP concentration and NEP enzymatic activity in heart failure. It is therefore uncertain that soluble NEP reflects tissue enzymatic activity.
Our study might be subject to selection bias, since not all consecutive patients were enrolled even if this was our initial intention. In this study, we only included patients who were able to undergo a complete CMR study 1 month later. About 25% of STEMI patients, we treat at our institution were enrolled during our study period.
5. CONCLUSION
In a population of STEMI patients, NEP serum levels did not change significantly in the first hours and 1‐month following reperfusion. NEP levels were neither reflecting myocardial damage or inflammation nor predictive of clinical outcomes after 1 year of follow‐up. Further studies are needed to understand better the pathophysiology and predictive value of circulating NEP.
CONFLICTS OF INTEREST
The authors declare no potential conflict of interests.
ACKNOWLEDGMENTS
This work was supported by the RHU MARVELOUS (ANR‐16‐RHUS‐0009) of Université de Lyon, within the program “Investissements d'Avenir”operated by the French National Research Agency (ANR). The authors would like to thank the Clinical Investigation Center for all the work that has been performed in data collection and management for this study with a special mention to Jehanne Mercy.
Bernelin H, Mewton N, Si‐Mohamed S, et al. Neprilysin levels at the acute phase of ST‐elevation myocardial infarction. Clin Cardiol. 2019;42:32–38. 10.1002/clc.23090
Funding information French National Research Agency; Université de Lyon
REFERENCES
- 1. George SG, Kenny AJ. Studies on the enzymology of purified preparations of brush border from rabbit kidney. Biochem J. 1973;134:43‐57. [DOI] [PMC free article] [PubMed] [Google Scholar]
- 2. Mangiafico S, Costello‐Boerrigter LC, Andersen IA, Cataliotti A, Burnett JC Jr. Neutral endopeptidase inhibition and the natriuretic peptide system: an evolving strategy in cardiovascular therapeutics. Eur Heart J. 2013;34:886‐893. [DOI] [PMC free article] [PubMed] [Google Scholar]
- 3. Ritz J, Pesando JM, Notis‐McConarty J, Lazarus H, Schlossman SF. A monoclonal antibody to human acute lymphoblastic leukaemia antigen. Nature. 1980;283:583‐585. [DOI] [PubMed] [Google Scholar]
- 4. Brown G, Hogg N, Greaves M. Candidate leukaemia‐specific antigen in man. Nature. 1975;258:454‐456. [DOI] [PubMed] [Google Scholar]
- 5. Bayes‐Genis A, Barallat J, Richards AM. A test in context: neprilysin: function, inhibition, and biomarker. J Am Coll Cardiol. 2016;68:639‐653. [DOI] [PubMed] [Google Scholar]
- 6. Bayés‐Genís A, Barallat J, Pascual‐Figal D, et al. Prognostic value and kinetics of soluble neprilysin in acute heart failure: a pilot study. JACC Heart Fail. 2015;3:641‐644. [DOI] [PubMed] [Google Scholar]
- 7. Bayés‐Genís A, Barallat J, Galán A, et al. Soluble neprilysin is predictive of cardiovascular death and heart failure hospitalization in heart failure patients. J Am Coll Cardiol. 2015;65:657‐665. [DOI] [PubMed] [Google Scholar]
- 8. McMurray JJ, Packer M, Desai AS, et al. Angiotensin–neprilysin inhibition versus enalapril in heart failure. N Engl J Med. 2014;371:993‐1004. [DOI] [PubMed] [Google Scholar]
- 9. von Lueder TG, Wang BH, Kompa AR, et al. Angiotensin receptor neprilysin inhibitor LCZ696 attenuates cardiac remodeling and dysfunction after myocardial infarction by reducing cardiac fibrosis and hypertrophy. Circ Heart Fail. 2015;8:71‐78. [DOI] [PubMed] [Google Scholar]
- 10. Suematsu Y, Miura S, Goto M, et al. LCZ696, an angiotensin receptor–neprilysin inhibitor, improves cardiac function with the attenuation of fibrosis in heart failure with reduced ejection fraction in streptozotocin‐induced diabetic mice. Eur J Heart Fail. 2016;18:386‐393. [DOI] [PubMed] [Google Scholar]
- 11. Levin ER, Gardner DG, Samson WK. Natriuretic Peptides. N Engl J Med. 1998;339:321‐328. [DOI] [PubMed] [Google Scholar]
- 12. Thygesen K, Mair J, Mueller C, et al. Recommendations for the use of natriuretic peptides in acute cardiac careA position statement from the study group on biomarkers in cardiology of the ESC working group on acute cardiac care. Eur Heart J. 2012;33:2001‐2006. [DOI] [PubMed] [Google Scholar]
- 13. Chen Y, Burnett JC Jr. Biochemistry, therapeutics, and biomarker implications of neprilysin in cardiorenal disease. Clin Chem. 2017;63:108‐115. [DOI] [PMC free article] [PubMed] [Google Scholar]
- 14. Shipp MA, Stefano GB, Switzer SN, Griffin JD, Reinherz EL. CD10 (CALLA)/neutral endopeptidase 24.11 modulates inflammatory peptide‐induced changes in neutrophil morphology, migration, and adhesion proteins and is itself regulated by neutrophil activation. Blood. 1991;78:1834‐1841. [PubMed] [Google Scholar]
- 15. Roques BP, Noble F, Daugé V, Fournié‐Zaluski MC, Beaumont A. Neutral endopeptidase 24.11: structure, inhibition, and experimental and clinical pharmacology. Pharmacol Rev. 1993;45:87‐146. [PubMed] [Google Scholar]
- 16. Connelly JC, Skidgel RA, Schulz WW, Johnson AR, Erdös EG. Neutral endopeptidase 24.11 in human neutrophils: cleavage of chemotactic peptide. Proc Natl Acad Sci U S A. 1985;82:8737‐8741. [DOI] [PMC free article] [PubMed] [Google Scholar]
- 17. Thygesen K, Alpert JS, Jaffe AS, Simoons ML, Chaitman BR, White HD. Third universal definition of myocardial infarction. Circulation. 2012;126:2020‐2035. [DOI] [PubMed] [Google Scholar]
- 18. Flett AS, Hasleton J, Cook C, et al. Evaluation of techniques for the quantification of myocardial scar of differing etiology using cardiac magnetic resonance. JACC Cardiovasc Imaging. 2011;4:150‐156. [DOI] [PubMed] [Google Scholar]
- 19. Rabin R, de Charro F. EQ‐5D: a measure of health status from the EuroQol Group. Ann Med. 2001;33:337‐343. [DOI] [PubMed] [Google Scholar]
- 20. Vodovar N, Séronde MF, Laribi S, et al. Elevated plasma B‐type natriuretic peptide concentrations directly inhibit circulating neprilysin activity in heart failure. JACC Heart Fail. 2015;3:629‐636. [DOI] [PubMed] [Google Scholar]
- 21. Goliasch G, Pavo N, Zotter‐Tufaro C, et al. Soluble neprilysin does not correlate with outcome in heart failure with preserved ejection fraction. Eur J Heart Fail. 2016;18:89‐93. [DOI] [PubMed] [Google Scholar]
- 22. Ørn S, Manhenke C, Ueland T, et al. C‐reactive protein, infarct size, microvascular obstruction, and left‐ventricular remodelling following acute myocardial infarction. Eur Heart J. 2009;30:1180‐1186. [DOI] [PubMed] [Google Scholar]
- 23. Liebetrau C, Hoffmann J, Dörr O, et al. Release kinetics of inflammatory biomarkers in a clinical model of acute myocardial infarction. Circ Res. 2015;116:867‐875. [DOI] [PubMed] [Google Scholar]
- 24. Liebetrau C, Gaede L, Dörr O, et al. Release kinetics of N‐terminal pro‐B‐type natriuretic peptide in a clinical model of acute myocardial infarction. Clin Chim Acta. 2014;429:34‐37. [DOI] [PubMed] [Google Scholar]
- 25. Cameron VA, Rademaker MT, Ellmers LJ, Espiner EA, Nicholls MG, Richards AM. Atrial (ANP) and brain natriuretic peptide (BNP) expression after myocardial infarction in sheep: ANP is synthesized by fibroblasts infiltrating the infarct*this work was supported by grants from the Health Research Council of New Zealand, the National Heart Foundation of New Zealand, the Canterbury Medical Research Foundation, and the lotteries Grants board. Endocrinology. 2000;141:4690‐4697. [DOI] [PubMed] [Google Scholar]
- 26. Ferraro S, Ardoino I, Boracchi P, et al. Inside ST‐elevation myocardial infarction by monitoring concentrations of cardiovascular risk biomarkers in blood. Clin Chim Acta. 2012;413:888‐893. [DOI] [PubMed] [Google Scholar]
- 27. Steg PG, James S, Harrington RA, et al. Group for the PS. Ticagrelor versus clopidogrel in patients with ST‐elevation acute coronary syndromes intended for reperfusion with primary percutaneous coronary intervention clinical perspective: a Platelet Inhibition and Patient Outcomes (PLATO) Trial Subgroup Analysis. Circulation. 2010;122:2131‐2141. [DOI] [PubMed] [Google Scholar]
- 28. Bayes‐Genis A, Prickett TC, Richards AM, Barallat J, Lupón J. Soluble neprilysin retains catalytic activity in heart failure. J Heart Lung Transplant. 2016;35:684‐685. [DOI] [PubMed] [Google Scholar]