

Abstract
Background
Studies have shown that higher body mass index (BMI) is associated with improved prognosis in heart failure (HF), and this is often termed the obesity paradox.
Hypothesis
Analysis of body composition may reveal that muscle mass rather than adipose tissue accounts for the obesity paradox.
Methods
Bioelectrical impedance analysis of body composition in 359 outpatients with HF was performed using an In Body 520 body composition scale (Biospace Inc., California). Body fat and lean mass were indexed by height (m2). The cohort was stratified by median fat and lean mass indexed by height.
Results
The mean age of patients studied was 56 ± 14; mean left ventricular ejection fraction was 38 ± 16%. Patients with higher indexed body fat mass had improved 5‐year survival over patients with lower indexed body fat mass (90.2% vs 80.1%, P = 0.008). There was also improved survival in patients with high vs low indexed lean body mass (89.3% vs 80.9%, P = 0.036). On multivariable analysis, higher indexed body fat mass, but not lean body mass, was independently associated with improved survival (HR 0.89, per kg/m2 increase in indexed body fat mass, P = 0.044); however, this was attenuated after adjustment for diabetes. The combination of low lean with low‐fat mass was independently associated with poor prognosis.
Conclusions
Our data suggest that higher fat mass—and to a lesser extent higher lean mass—is associated with improved outcomes in HF. Further investigations of specific components of body composition and outcomes in HF are warranted.
Keywords: body composition, heart failure, obesity paradox, outcomes
1. INTRODUCTION
According to the US National Health and Nutrition Examination Survey data, 39% of the US population is obese by body mass index (BMI), and the distribution of BMI in the United States has drastically shifted toward higher values in recent decades.1, 2 Obesity has potentially adverse effects on left ventricular structure/function, and is associated with additional risk factors for heart failure (HF), including hypertension and coronary artery disease. Thus, it is not surprising then that HF incidence and prevalence is increased in overweight and obese patients.3, 4, 5, 6, 7
Although obesity is a risk factor for the development of HF, higher BMI is associated with improved survival in patients with established HF, and this has been termed the “obesity paradox”.8, 9, 10 Although the obesity paradox has traditionally been described in terms of BMI, the validity of BMI as a marker for obesity has been questioned, as it does not account for body composition, that is, differences in lean and fat mass, or distribution of fat.11, 12
This study used bioelectrical impedance analysis (BIA) to assess body composition in 359 chronic stable HF outpatients and assessed the relationship between body composition, that is, lean body mass (LBM) and body fat mass (BFM), and outcomes in HF. Our previous study showed that higher waist circumference, which closely tracks with visceral adiposity, is associated with better HF survival.13 Furthermore, prior studies have suggested that higher fat‐free mass or lean appendicular mass are associated with improved outcomes in HF.14, 15 Thus, we hypothesized that both increased LBM indexed to height and increased BFM indexed to height would be independently associated with better outcomes in HF. To the best of our knowledge, this type of analysis of body composition is among the first studies of this kind in outpatients with HF.
2. METHODS
The study was composed of consecutive outpatients referred to the Ahmanson‐University of California, Los Angeles (UCLA) Cardiomyopathy Center from 2011 to 2014 who underwent BIA. Subjects were followed in a comprehensive HF management program, as previously described.16 Medical record review was approved by the Medical Institutional Review Board of the UCLA.
The assessment of body composition with the InBody 520 body composition analyzer occurred either during the time of initial referral or at subsequent clinic visits. Laboratory testing and echocardiography occurred at time of initial referral or within the first 3 months of the initial referral. Medical history was extracted from medical record review.
2.1. Bioelectrical impedance analysis
BIA was performed with the InBody 520 device (Biospace Inc., California), which performs 15 impedance measurements per patient, by measuring conductance of electrical current across five body segments (legs, arms, and trunk) at three frequencies each (5, 50, and 500 kHz).17 The accuracy of body composition measurement in obese populations using single frequency BIA had previously been called into question, as the hyper‐hydrated status of obese individuals may violate the assumption used in BIA that water accounts for 60% of body mass in healthy adults. The InBody 520 skirts these concerns as a multi‐frequency, multi‐segmental bioelectrical impedance instrument; measurements at 5, 50, and 500 kHz have been found to yield evaluations of total body water, intracellular and extracellular water in obese populations comparable to those given by Dual Energy X‐ray Absorptiometry (DEXA).18, 19 Patients with pacemakers and implantable defibrillators were included in the study, based on our prior research, which determined use of the InBody 520 to be safe for these patients.20
BFM (kg) and LBM (kg) were obtained from BIA. Body fat mass index (BFMi) and lean body mass index (LBMi) were calculated by dividing the subjects' BFM or LBM in kg by the square of the subject's height in meters. BFMi and LBMi were analyzed both as continuous variables and categorical variables, stratified by their median values within the overall cohort; median BFMi and LBMi were 8.2 and 19.1 kg/m2, respectively. Low BFMi was defined as ≤8.2 kg/m2 and high BFMi as >8.2 kg/m2. Low LBMi was defined as ≤19.1 kg/m2 and high as >19.1 kg/m2. We also created the following four categories of body composition based on the aforementioned median thresholds: a combination of low LBMi/LBFMi, low LBMi/high BFMi, high LBMi/low BFMi and high LBMi/BFMi. BMI was calculated using reported weight and height, with high BMI defined as BMI > 24.99 kg/m2.
2.2. Statistical analysis
Death was the primary endpoint in this study. Patients were censored at time of heart transplant or ventricular assist device. Survival curves were calculated using Kaplan‐Meier estimates, and differences between curves were calculated using log‐rank statistics. Univariate survival analyses were performed with the likelihood ratio test, using the Cox model for baseline variables of BFMi and LBMi separately, and also the combination four‐variable categorical variable. Given the small sample size and limited number of events, limited multivariate analysis adjusting for known predictors in HF including age, gender, BNP, left ventricular ejection fraction (LVEF), and in a second model diabetes, was performed. Body composition variables were analyzed both as categorical and continuous variables. BNP was transformed to lnBNP because of its skewed distribution. The Cox model retained all independent variables with P‐values <0.15. Statistical analyses were performed using SPSS version 25.0 (IBM, Armonk, New York).
3. RESULTS
The mean age of patients studied was 56 ± 14 and the mean LVEF was 38 ± 16%. The baseline characteristics of the study population stratified by median LBMi and BFMi are described in Table 1. Patients with high BFMi were similar to those with low BFMi in terms of blood pressure, LVEF, and cholesterol levels. Patients with high BFMi had higher WC and were more likely to have diabetes and higher HbA1c levels. High LBMi was associated with younger age, higher WC, and male gender (Table 1). Subjects were also stratified by both BFMi and LBMi for analysis of baseline characteristics (Supporting Information Table S1).
Table 1.
Baseline characteristics of the total population, and the population stratified by body fat mass indexed to BSA (BFMi) and by lean body mass indexed to BSA (LBMi)
| Low BFMi (≤ 8.2 kg/m2) (n = 182) | High BFMi (≥8.2 kg/m2) (n = 175) | P‐value | Low LBMi (≤ 19.1 kg/m2) (n = 179) | High LBMi (≥ 19.1 kg/m2) (n = 180) | P‐value | |
|---|---|---|---|---|---|---|
| BMI (kg/m2) | 24.3 ± 3.5 | 32.3 ± 5.0 | 0.0001 | 24.9 ± 4.1 | 31.6 ± 5.4 | 0.0001 |
| Waist circumference (cm) | 90.0 ± 13.5 | 109.5 ± 12.9 | 0.0001 | 90.1 ± 12.7 | 108.4 ± 14.5 | 0.0001 |
| Percent body fat (%) | 23.1 ± 6.9 | 37.9 ± 6.1 | 0.0001 | 30.2 ± 9.7 | 30.7 ± | 0.640 |
| Age (years) | 56.2 ± 15.2 | 55.5 ± 12.5 | 0.561 | 58.0 ± 15.2 | 53.8 ± 12.2 | 0.003 |
| Systolic blood pressure (mm Hg) | 114 ± 19 | 116 ± 19 | 0.283 | 113 ± 19 | 117 ± 19 | 0.025 |
| Heart rate (bpm) | 71 ± 13 | 74 ± 15 | 0.111 | 73 ± 15 | 72 ± 13 | 0.659 |
| LVEF (%) | 38 ± 16 | 35 ± 16 | 0.147 | 38 ± 16 | 34 ± 16 | 0.041 |
| Left ventricular end diastolic dimension (mm) | 55 ± 13 | 60 ± 13 | 0.003 | 54 ± 12 | 61 ± 13 | 0.0001 |
| Creatinine (mg/dL) | 1.3 ± 1.5 | 1.2 ± 0.6 | 0.269 | 1.3 ± 1.5 | 1.2 ± 0.5 | 0.232 |
| Total cholesterol (mg/dL) | 160 ± 45 | 157 ± 42 | 0.607 | 160 ± 45 | 157 ± 42 | 0.596 |
| B‐type natriuretic peptide (pg/mL) | 175 (52‐565) | 109 (21‐383) | 0.025 | 187 (40‐584) | 117 (30‐307) | 0.032 |
| HbA1c (%) | 5.8 ± 1.3 | 6.9 ± 2.2 | 0.001 | 6.1 ± 1.8 | 6.7 ± 1.9 | 0.075 |
| Diabetes (%) | 17.8 | 30.6 | 0.005 | 19.9 | 28.7 | 0.057 |
| NYHA 1/2/3/4 | 29.7/41.3/26.1/ 2.9 | 11.8/49.3/34.6/4.4 | 0.005 | 46.0/32.4/2.9 | 48.0/28.1/4.4 | 0.559 |
| Women (%) | 27.5 | 27.7 | 0.964 | 46.9 | 8.3 | 0.0001 |
Abbreviations: BMI, body mass index, LVEF, left ventricular ejection fraction, HbA1c, hemoglobin A1c, NYHA, New York Heart Association Class.
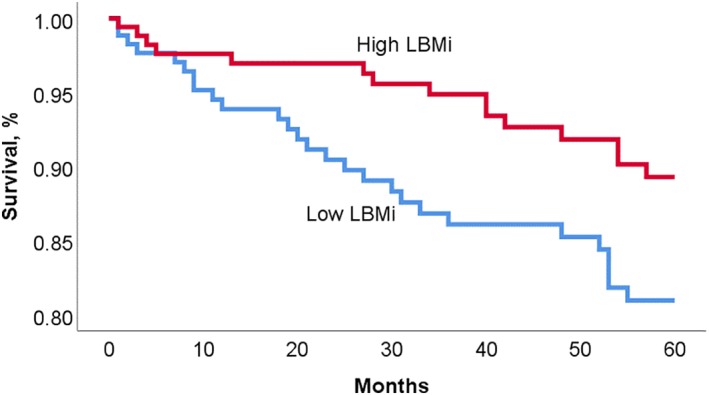
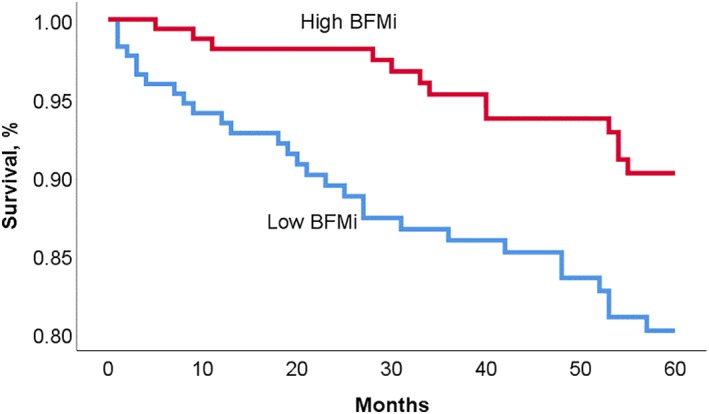
Over the 5‐year follow‐up, there were 42 deaths and 37 transplants/ventricular assist devices. Subjects in the high BFMi group had significantly improved survival compared to subjects with low BFMi (90.2% vs 80.1%, P = 0.008), with a univariate hazard ratio (HR) and 95% confidence interval (CI) of 2.3 (1.2‐4.5) (Figure 1). There was also improved 5‐year survival in patients with high LBMi when compared to patients with low LBMi (89.3% vs 80.9%, P = 0.036); univariate HR 1.9 (1.0‐3.7) (Figure 2). Five‐year survival from death was also compared in the four categories of body composition; patients with both high LBMi and BFMi had the best 5‐year outcomes; 5‐year survival was 76.2% in low LBMi and low BFMi patients, 86.3% in high LBMi and low BFMi patients, 88.3% in the low LBMi and high BFMi group, and 91.4% in the high LBMi and BFMi group (P across groups = 0.014) (Figure 3).
Figure 1.
Kaplan‐Meier survival curve for patients with high vs low body fat mass indexed to BSA (BFMi)
Figure 2.
Kaplan‐Meier survival curve for patients with high vs low lean body mass indexed to BSA (LBMi)
Figure 3.
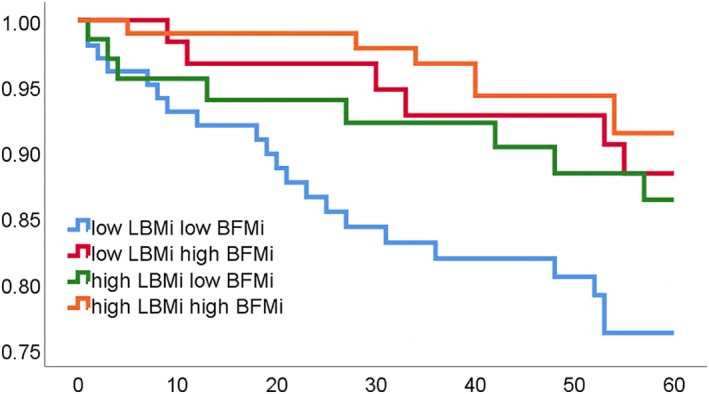
Kaplan–Meier survival curve for four categories of body composition: Low lean body mass indexed to height (LBMi) and low body fat mass indexed to height (BFMi); low LBMi and high BFMi; high LBMi and low BFMi; high LBMi and high BFMi
We then assessed survival by LBMi and BFMi, each one entered separately in a multivariate model (Models 1a and1b), adjusting for age, sex, LVEF, and B‐type natriuretic peptide (BNP). Models 2a and 2b included all the variables of Models 1a and 1b with the addition of the variable presence or absence of type 2 diabetes. On multivariable analysis, higher BFMi was associated with improved survival while LBMi was not independently associated with outcomes; after addition of DM, the relationship between BFMi and survival was diminished. BNP was the strongest predictor of outcomes in all models (Table 2). On analysis of the four body composition categories, the combination of low BFMi and low LBMi was significantly associated with 4‐5x increased risk of death compared to patients with both high BFMi and LBMi. This association was seen in multivariable models both with and without diabetes (HR of 4.67 [P = 0.02] and 4.15 [P = 0.04], respectively). Higher BMI was also associated with improved outcomes, similar in magnitude to BFMi (see Table S2).
Table 2.
Cox regression multivariate model using BFMi and LBMi as categorical and continuous variables
| BFMi or LBMi as categorical variables | BFMi or LBMi as continuous variables | |||||
|---|---|---|---|---|---|---|
| HR | 95% CI | P‐value | HR | 95% CI | P‐value | |
| Model 1a | ||||||
| BFMib | 0.48 | (1.00‐5.27) | 0.049 | 0.89 | (0.79‐1.00) | 0.044 |
| Female sex | 1.77 | (0.70‐4.50) | 0.70 | 1.76 | (0.70‐4.47) | 0.23 |
| Age (years) | 0.51 | (0.23‐1.13) | 0.10 | 0.56 | (0.25‐1.23) | 0.15 |
| LVEF (%) | 0.69 | (0.99‐1.025) | 0.69 | 1.00 | (0.97‐1.03) | 0.77 |
| lnBNP | 1.73 | (1.21‐2.47) | 0.003 | 1.70 | (1.20‐2.41) | 0.003 |
| Model 1b | ||||||
| LBMib | 0.48 | (0.87‐5.05) | 0.10 | 0.87 | (0.73‐1.03 | 0.11 |
| Female sex | 2.14 | (0.82‐5.57) | 0.12 | 2.56 | (0.88‐7.44) | 0.09 |
| Age (years) | 0.61 | (0.27‐1.39) | 0.24 | 0.603 | (0.27‐1.37) | 0.23 |
| LVEF (%) | 1.00 | (0.97‐1.02) | 0.72 | 1.0 | (0.97‐1.03) | 0.76 |
| lnBNP | 1.64 | (1.16‐2.33) | 0.005 | 1.60 | (1.12‐2.29) | 0.01 |
| Model 2a | ||||||
| BFMib | 0.49 | (0.88‐4.78) | 0.10 | 0.90 | (0.80‐1.01) | 0.08 |
| Female sex | 1.66 | (0.63‐4.39) | 0.31 | 1.63 | (0.62‐4.27) | 0.32 |
| Age (years) | 0.48 | (0.20‐1.14) | 0.10 | 0.52 | (0.21‐1.25) | 0.144 |
| Diabetes | 1.28 | (0.50‐3.31) | 0.61 | 1.18 | (0.46‐1.06) | 0.732 |
| LVEF (%) | 0.99 | (0.96‐1.02) | 0.54 | 0.99 | (0.96‐1.02) | 0.73 |
| lnBNP | 1.72 | (1.19‐2.48) | 0.004 | 1.68 | (1.17‐2.41) | 0.73 |
| Model 2b | ||||||
| LBMia | 0.47 | (0.84‐5.32) | 0.11 | 0.89 | (0.74‐1.06) | 0.20 |
| Female sex | 2.00 | (0.74‐5.36) | 0.17 | 2.30 | (0.74‐7.13) | 0.15 |
| Age (years) | 0.55 | (0.22‐1.35) | 0.19 | 0.53 | (0.22‐1.32) | 0.17 |
| Diabetes | 1.24 | (0.48‐3.20) | 0.65 | 1.31 | (0.51‐3.40) | 0.57 |
| LVEF (%) | 0.99 | (0.96‐1.02) | 0.57 | 0.99 | (0.96‐1.02) | 0.63 |
| lnBNP | 1.63 | (1.13‐2.33) | 0.008 | 1. 61 | (1.11‐2.34) | 0.01 |
Abbreviations: BFMi, body fat mass indexed; lnBNP, natural log of B‐type natriuretic peptideLBMi, lean body mass indexed, LVEF, left ventricular ejection fraction.
Low vs high for categorical, per unit increase for continuous.
BFMi and LBMi were each entered into their own models separately, due to the high correlation between these two variables. Models 1a and 1b include as variables sex, left ventricular ejection fraction, B‐type natriuretic peptide, and age. Models 2a and 2b include all variables in Model 1 plus diabetes.
4. DISCUSSION
In our study, we demonstrated that mortality is inversely related with BFMi in patients with established HF; higher BFM was independently associated with improved survival. Higher LBM was also associated with improved survival, although this finding was not significant in multivariable analyses. Patients with both high fat and high lean mass had the best outcomes.
4.1. The obesity paradox and heart failure
Although elevated BMI is well established as a risk factor for HF, a surprising relationship between BMI and outcomes in those with established HF has been observed.8 This counterintuitive epidemiologic association has now been termed the “obesity paradox,” and has been well documented in numerous studies of HF patients as well as other types of cardiovascular disease and other chronic disease states.10, 21, 22, 23, 24
One potential explanation for the paradoxical link between obesity and HF is the way that most studies have chosen to identify obesity. For reasons of widespread acceptance and ease of use, BMI has been used to identify overweight, obese, and morbidly obese patients. However, the reliability of BMI as a true representation of adiposity has been questioned.24 A limitation of previous studies investigating the obesity paradox is a lack of full assessment or examination of body composition in relation to survival. In a previous study by our group, we showed that high waist circumference (WC), an alternative anthropometric index of obesity more specific to abdominal adiposity, high BMI, and the combination of high WC/high BMI were each associated with improved outcomes in the HF cohort studied.13 Another study investigated the complementary role of mid‐upper arm circumference (MUAC), as a surrogate for LBM, to BMI in risk stratification in HF and found that those patients with low BMI but high MUAC carried a better prognosis than those patients with low BMI and low MUAC.26 Similar studies investigating body composition and mortality in coronary heart disease have estimated LBM and BFM by the sum of the skin‐fold method24; this study also found that higher LBM and BFM were associated with improved outcomes. Multiple recent review articles have synthesized existing evidence and explanations for an obesity paradox in HF.25, 26
4.2. Body composition
BIA is a noninvasive method, albeit slightly more costly and less readily available compared to more traditional methods (BMI and WC), to evaluate changes in body composition. In a community‐based study in the United Kingdom, 1025 patients with chronic HF underwent BIA; percent BF, fat mass, and fat‐free mass were associated with increased risk, and percent BF was a significant predictor of mortality in a multivariable model.14 Our study found BIA to be safe for use with pacemakers and defibrillators, broadening its potential use in advanced HF populations.18 Dual‐energy X‐ray absorptiometry (DEXA) utilizes two low‐level X‐ray beams to develop estimates of fat‐free mass, fat mass, and bone mineral density.27, 28 A recent study found that low muscle mass as measured by DEXA predicted higher rates of HF hospitalizations in the elderly.28 Computed tomography (CT) and magnetic resonance imaging (MRI) are now considered to be the most accurate methods for measuring quantity, quality, and distribution of adipose tissue and lean muscle mass; however, their use in research and clinical practice is limited by expense and radiation dose.27
4.3. Potential explanations
At first glance, these results may appear surprising or counterintuitive. However, essential fat is required to provide metabolic fuel for energy production and other normal bodily functions.29, 30 Similar to other chronic diseases, HF is a catabolic state, and increased BFM may serve as an essential energy reserve in this population. Cardiac cachexia is a syndrome involving progressive weight loss and alterations in body composition that carries a devastating prognosis in HF as well as in other disease states. A previous study found that wasting of fat but not lean mass was predictive of adverse outcomes in HF patients, suggesting that fat loss is a marker of enhanced catabolism, or body fat mass is protective in the context of advanced HF.31
Adipose tissue may provide protection by mitigating the inflammatory state in HF.32 Studies have shown that patients with HF and cachexia have higher circulating levels of tumor necrosis factor‐alpha (TNF‐α).33 Adipose tissue is known to produce soluble TNF‐α receptors that could have a protective effect in HF by binding TNF‐α and neutralizing its adverse biological effects.34 On the other hand, Streng et al found a higher waist‐to‐hip ratio (a proxy measure for abdominal adiposity) to be associated with a higher risk of mortality and elevated levels of inflammation markers in female HF patients, although not male ones.35 It has been suggested that higher blood pressure in obesity could lead to greater tolerance of guideline‐directed medical therapy in those with elevated fat mass. Patients with high‐fat mass may have a different, more benign etiology or genotype compared to patients with normal body fat who develop HF, a potential area for further study. In addition to the benefits of adipose tissue itself, there has been an association between increased adiposity and greater muscular strength in HF patients with reduced ejection fraction, which may explain some of the clinical benefits seen in obese patients.36 It has been suggested that increased skeletal muscle could improve HF prognosis in patients with reduced ejection fraction.37 One study found that higher lean mass was associated with prognostically beneficial surrogate markers in HF, such as C‐reactive protein, N‐terminal pro B‐type natriuretic peptide (NT‐pro BNP) and nutritional status.38 A protective role of lean mass may be supported by recent research which found loss of muscle mass in HF patients to be more associated with reductions in quality of life than weight loss alone.39
We acknowledge both strengths and limitations to this study. The study was conducted out of a single center, allowing accurate and thorough follow‐up. The single‐center design involving a referral population may limit the generalizability of conclusions drawn from the data. Although the data did remain significant in multi‐variable analysis, the size of the study population and the relatively low number of events are limiting. In addition, the InBody 520 was located in an outpatient facility and requires patients stand on it, excluding from this study any patients hospitalized for disease or confined to wheelchairs or beds. We also did not have data on fitness levels or weight change over time, which are known to influence the relationship between BMI and outcomes in HF.38, 40 Fitness levels may modulate the obesity paradox in HF, making inclusion of patient fitness level data a prudent idea for follow‐up study.41, 42
BIA is a safe and convenient way to measure BFM and LBM; however, there are some limitations. Although the BIA methodology of the Inbody system may accurately assess body composition even in the presence of edema,17 additional investigation of its accuracy in HF and obesity is warranted. BIA is not as accurate as CT or MRI, which can differentiate between subcutaneous and visceral adiposity.27 Our paper does not address whether body composition is a better predictor of outcomes in HF than the traditionally‐used BMI. Our cohort was relatively small with relatively few mortality events over the follow‐up period. Inclusion or exclusion of additional prognostic variables as well as residual measured or unmeasured confounding variables may have impacted these findings.
5. CONCLUSIONS
Our findings indicate that high BFM is an independent predictor of better survival in those with chronic HF. High LBM is not an independent predictor of outcomes. Although weight loss is often encouraged in patients with cardiovascular disease, it should be recommended with caution to those with HF. Additional studies are needed to validate our findings and to determine the optimal body composition in patients with HF; this information may ultimately guide diet and exercise recommendations in HF populations.
CONFLICTS OF INTEREST
Dr Fonarow reports a potential conflict of interest pertaining to research support from the National Institute of Health (significant) and consulting work for Amgen (modest), Janssen (modest), Medtronic (modest), Novartis (significant), and St Jude (modest). Dr Horwich reports a potential conflict of interest pertaining to research support from the National Institute of Health (significant) and Samsung (modest).
Supporting information
Table S1. Baseline characteristics presented of patients in four categories based on body composition.
Table S2. Cox Regression Multivariate Model Using BFMi and LBMi as Categorical and Continuous Variables
Thomas E, Gupta PP, Fonarow GC, Horwich TB. Bioelectrical impedance analysis of body composition and survival in patients with heart failure. Clin Cardiol. 2019;42:129–135. 10.1002/clc.23118
REFERENCES
- 1. Hales CM, Fryar CD, Carroll MD, Freedman DS, Aoki Y, Ogden CL. Differences in obesity prevalence by demographic characteristics and urbanization level among adults in the United States, 2013‐2016. JAMA. 2018;319(23):2419‐2429. 10.1001/jama.2018.7270. [DOI] [PMC free article] [PubMed] [Google Scholar]
- 2. Benjamin EJ, Virani SS, Callaway CW, et al. Heart Disease and Stroke Statistics—2018 Update: A Report From the American Heart Association. Heart disease and stroke statistics—2018 update: A report From the American Heart Association. 2018;137(12):e67‐e492. 10.1161/CIR.0000000000000558. [DOI] [PubMed] [Google Scholar]
- 3. Kenchaiah S, Evans JC, Levy D, et al. Obesity and the risk of heart failure. N Engl J Med. 2002;347(5):305‐313. 10.1056/NEJMoa020245. [DOI] [PubMed] [Google Scholar]
- 4. Lauer MS, Anderson KM, Kannel WB, Levy D. The impact of obesity on left ventricular mass and geometry. The Framingham heart study. JAMA. 1991;266(2):231‐236. 10.1001/jama.1991.03470020057032. [DOI] [PubMed] [Google Scholar]
- 5. Kasper EK, Hruban RH, Baughman KL. Cardiomyopathy of obesity: a clinicopathologic evaluation of 43 obese patients with heart failure. Am J Cardiol. 1992;70(9):921‐924. 10.1016/0002-9149(92)90739-L. [DOI] [PubMed] [Google Scholar]
- 6. Wilhelmsen L, Rosengren A, Eriksson H, Lappas G. Heart failure in the general population of men ‐ morbidity, risk factors and prognosis. J Intern Med. 2001;249(3):253‐261. 10.1111/j.1365-2796.2001.00801.x. [DOI] [PubMed] [Google Scholar]
- 7. Kenchaiah S, Pocock SJ, Wang D, et al. Body mass index and prognosis in patients with chronic heart failure: insights from the Candesartan in Heart failure: Assessment of Reduction in Mortality and morbidity (CHARM) program. Circulation. 2007;116(6):627‐636. 10.1161/CIRCULATIONAHA.106.679779. [DOI] [PubMed] [Google Scholar]
- 8. Horwich TB, Fonarow GC, Hamilton MA, MacLellan WR, Woo MA, Tillisch JH. The relationship between obesity and mortality in patients with heart failure. J Am Coll Cardiol. 2001;38(3):789‐795. 10.1016/S0735-1097(01)01448-6. [DOI] [PubMed] [Google Scholar]
- 9. Sharma A, Lavie CJ, Borer JS, et al. Meta‐analysis of the relation of body mass index to all‐cause and cardiovascular mortality and hospitalization in patients with chronic heart failure. Am J Cardiol. 2015;115:1428‐1434. 10.1016/j.amjcard.2015.02.024. [DOI] [PubMed] [Google Scholar]
- 10. Kapoor JR, Heidenreich PA. Obesity and survival in patients with heart failure and preserved systolic function: a U‐shaped relationship. Am Heart J. 2010;159(1):75‐80. 10.1016/j.ahj.2009.10.026. [DOI] [PubMed] [Google Scholar]
- 11. Ahima RS, Lazar MA. The health risk of obesity – better metrics imperative. Science. 2013;341(6148):856‐858. 10.1126/science.1241244. [DOI] [PubMed] [Google Scholar]
- 12. Lavie CJ, Osman AF, Milani RV, Mehra MR. Body composition and prognosis in chronic systolic heart failure: the obesity paradox. Am J Cardiol. 2003;91:891‐894. 10.1016/S0002-9149(03)00031-6. [DOI] [PubMed] [Google Scholar]
- 13. Clark AL, Fonarow GC, Horwich TB. Waist circumference, body mass index, and survival in systolic heart failure: the obesity paradox revisited. J Card Fail. 2011;17(5):374‐380. 10.1016/j.cardfail.2011.01.009. [DOI] [PubMed] [Google Scholar]
- 14. Futter JE, Cleland JGF, Clark AL. Body mass indices and outcome in patients with chronic heart failure. Eur J Heart Fail. 2011;13(2):207‐213. 10.1093/eurjhf/hfq218. [DOI] [PubMed] [Google Scholar]
- 15. DeBello JR, Miller R, Khandker R, Bourgeois N, Galway N, Clark R. Association between low muscle mass, functional limitations and hospitalisation in heart failure: NHANES 1999–2004. Age and Ageing. 2015;44:10‐26. 10.1093/ageing/afv129. [DOI] [PubMed] [Google Scholar]
- 16. Fonarow GC, Stevenson LW, Walden JA, et al. Impact of a comprehensive heart failure management program on hospital readmission and functional status of patients with advanced heart failure. J Am Coll Cardiol. 1997;30:725‐732. 10.1016/0735-1097(95)00341-X. [DOI] [PubMed] [Google Scholar]
- 17.Inbody 520 User's Manual. https://inbodyusa.com/support/documentation/. Last updated 11/22/11. Accessed 11/24/18.
- 18. Faria SL, Faria OP, Cardeal MDA, Ito MK. Validation study of multi‐frequency bioelectrical impedance with dual‐energy X‐ray absorptiometry among obese patients. Obes Surg. 2014;24:1476‐1480. 10.1007/s11695-014-1190-5. [DOI] [PubMed] [Google Scholar]
- 19. Mulasi U, Kuchnia AJ, Cole AJ, Earthman CP. Bioimpedance at the bedside: current applications, limitations and opportunities. Nutr Clin Pract. 2015;30(2):180‐193. 10.1177/0884533614568155. [DOI] [PubMed] [Google Scholar]
- 20. Buch E, Bradfield J, Larson T, Horwich T. Effect of bioimpedance body composition analysis on function of implanted cardiac devices. Pacing Clin Electrophysiol. 2012;35(6):681‐684. 10.1111/j.1540-8159.2012.03377.x. [DOI] [PubMed] [Google Scholar]
- 21. Gupta PP, Fonarow GC, Horwich TB. Obesity and the obesity paradox in heart failure. Can J Cardiol. 2015;31:195‐202. 10.1016/j.pcad.2018.05.005. [DOI] [PubMed] [Google Scholar]
- 22. Lavie CJ, De Schutter A, Parto P, et al. Obesity and prevalence of cardiovascular diseases and prognosis—the obesity paradox updated. Prog Cardiovasc Dis. 2016;58:537‐547. 10.1016/j.pcad.2016.01.008. [DOI] [PubMed] [Google Scholar]
- 23. De Schutter A, Lavie CJ, Kachur S, Patel DA, Milani RV. Body composition and mortality in a large cohort with preserved ejection fraction: untangling the obesity paradox. Mayo Clin Proc. 2014;89:1072‐1079. 10.1016/j.mayocp.2014.04.025. [DOI] [PubMed] [Google Scholar]
- 24. Lavie CJ, De Schutter A, Patel DA, Romero‐Corral A, Artham SM, Milani RV. Body Composition and survival in stable coronary heart disease: impact of lean mass index and body fat in the “obesity paradox”. J Am Coll Cardiol. 2012;60:1374‐1380. 10.1016/j.jacc.2012.05.037. [DOI] [PubMed] [Google Scholar]
- 25. Horwich TB, Fonarow GC, Clark AL. Obesity and the obesity paradox in heart failure. Prog Cardiovasc Dis. 2018;61:151‐156. 10.1016/j.pcad.2018.05.005. [DOI] [PubMed] [Google Scholar]
- 26. Lavie CJ, Sharma A, Alpert MA, et al. Update on obesity and obesity paradox in heart failure. Prog Cardiovasc Dis. 2016;58:393‐400. 10.1016/j.pcad.2015.12.003. [DOI] [PubMed] [Google Scholar]
- 27. Hu F. Measurements of Adiposity and Body Composition In: Hu F, ed. Obesity Epidemiology. New York, NY: Oxford University Press; 2008:53‐83. [Google Scholar]
- 28. Sun Q, van Dam RM, Spiegelman D, Heymsfield SB, Willett WC, Hu FB. Comparison of dual‐energy X‐ray absorptiometric and anthropometric measures of adiposity in relation to adiposity‐related biologic factors. Am J Epidemiol. 2010;172(12):1442‐1454. 10.1093/aje/kwq306. [DOI] [PMC free article] [PubMed] [Google Scholar]
- 29. Brown SP, Miller WC, Eason JM. Exercise Physiology: Basis of Human Movement in Health and Disease. 2nd ed. Philadelphia: Lippincott Williams & Wilkins;2006:p324. [Google Scholar]
- 30. Baumgartner RN, Roche AF, Guo S, Lohman T, Boileau RA, Slaughter MH. Adipose tissue distribution: the stability of principal components by sex, ethnicity and maturation stage. Hum Biol. 1986;58(5):719‐735. [PubMed] [Google Scholar]
- 31. Melenovsky V, Kotrc M, Borlaug BA, et al. Relationships between right ventricular function, body composition and prognosis in advanced heart failure. J Am Coll Cardiol. 2013;62:1660‐1670. 10.1016/j.jacc.2013.06.046. [DOI] [PubMed] [Google Scholar]
- 32. Kalantar‐Zadeh K, Block G, Horwich T, Fonarow GC. Reverse epidemiology of conventional cardiovascular risk factors in patients with chronic heart failure. J Am Coll Cardiol. 2004;43:1439‐1444. 10.1016/j.jacc.2003.11.039. [DOI] [PubMed] [Google Scholar]
- 33. Ponikowski P, Varney S, et al. Wasting as independent risk factor for mortality in chronic heart failure. Lancet. 1997;349(9058):1050‐1053. 10.1016/S0140-6736(96)07015-8. [DOI] [PubMed] [Google Scholar]
- 34. Conraads VM, Bosmans JM, Vrints CJ. Chronic heart failure: An example of a systemic chronic inflammatory disease resulting in cachexia. Int J Cardiol. 2000;85:33. [DOI] [PubMed] [Google Scholar]
- 35. Streng K et al. Waist‐to‐hip ratio and mortality in heart failure. European J Heart Failure. 2018;20:1269‐1277. 10.1002/ejhf.1244. [DOI] [PubMed] [Google Scholar]
- 36. Zavin A, Daniels K, Arena R, et al. Adiposity facilitates increased strength capacity in heart failure patients with reduced ejection fraction. Int J Cardiol. 2013;167:2468‐2471. 10.1016/j.ijcard.2012.06.007. [DOI] [PMC free article] [PubMed] [Google Scholar]
- 37. Lavie CJ, Forman DE, Arena R. Bulking up skeletal muscle to improve heart failure prognosis. JACC Heart Failure. 2016;4(4):274‐276. 10.1016/j.jchf.2015.12.005. [DOI] [PubMed] [Google Scholar]
- 38. Oreopoulos A, Ezekowitz JA, McAlister FA, et al. Association between direct measures of body composition and prognostic factors in chronic heart failure. Mayo Clin Proc. 2010;85(7):609‐617. 10.4065/mcp.2010.0103. [DOI] [PMC free article] [PubMed] [Google Scholar]
- 39. Emami A, Saitoh M, Valentova M, et al. Comparison of sarcopenia and cachexia in men with chronic heart failure: results from the Studies Investigating Co‐morbidities Aggravating Heart Failure (SICA‐HF). Eur J Heart Fail. 2018;20:1580‐1587. 10.1002/ejhf.1304. [DOI] [PubMed] [Google Scholar]
- 40. Oktay AA, Lavie CJ, Kokkinos PF, Parto P, Pandey A, Ventura HO. The interaction of cardiorespiratory fitness with obesity and the obesity paradox in cardiovascular disease. Prog Cardiovasc Dis. 2017;60:30‐44. 10.1016/j.pcad.2017.05.005. [DOI] [PubMed] [Google Scholar]
- 41. McAuley PA, Keteyian SJ, Brawner CA, et al. Exercise Capacity and the Obesity Paradox in Heart Failure: The FIT (Henry Ford Exercise Testing) Project. Mayo Clinic Proceedings. 2018;93:701‐708. 10.1016/j.mayocp.2018.01.026. [DOI] [PubMed] [Google Scholar]
- 42. Lavie CJ, Cahalin LP, Chase P, et al. Impact of cardiorespiratory fitness on the obesity paradox in patients with heart failure. Mayo Clin Proc. 2013;88(3):251‐258. 10.1016/j.mayocp.2012.11.020. [DOI] [PMC free article] [PubMed] [Google Scholar]
Associated Data
This section collects any data citations, data availability statements, or supplementary materials included in this article.
Supplementary Materials
Table S1. Baseline characteristics presented of patients in four categories based on body composition.
Table S2. Cox Regression Multivariate Model Using BFMi and LBMi as Categorical and Continuous Variables