Summary
Aims
Alpha‐synuclein (α‐syn) aggregation is a neuropathological hallmark of neurodegenerative synucleinopathies. This in vivo study explored glucose metabolism and dopaminergic and serotoninergic neurotransmission in KO α‐syn, wild‐type mice and an accelerated murine model of synucleinopathy (M83).
Methods
MicroPET acquisitions were performed in all animals aged 5‐6 months using five radiotracers exploring brain glucose metabolism ([18F]FDG), dopamine neurotransmission ([11C]raclopride, [11C]PE2I) and serotonin neurotransmission ([18F]MPPF, [11C]DASB). For all radiotracers, except [18F]FDG, PET data were analyzed with a MRI‐based VOI method and a voxel‐based analysis.
Results
MicroPET data showed a decrease in [11C]raclopride uptake in the caudate putamen of KO α‐syn mice, in comparison with M83 and WT mice, reflecting a lower concentration of D2 receptors. The increase in [18F]MPPF uptake in M83 vs WT and KO mice indicates overexpression of 5‐HT 1A receptors. The lack of change in dopamine and serotonin transporters in all groups suggests unchanged neuronal density.
Conclusions
This PET study highlights an effect of α‐syn modulation on the expression of the D2 receptor, whereas aggregated α‐syn leads to overexpression of 5‐HT 1A receptor, as a pathophysiological signature.
Keywords: alpha‐synuclein, animal model, dopamine, PET, serotonin
1. INTRODUCTION
Alpha‐synuclein (α‐syn) is a soluble endogenous protein that typically assumes a random coil structure. If its exact functions remain uncertain,1, 2 its preferential localization in presynaptic nerve terminals and interactions with vesicular phospholipids and proteins suggest a regulatory function in dopamine production, synaptic activity, and lipid vesicle trafficking.3, 4, 5, 6, 7 The term “synucleinopathy” refers collectively to a group of heterogeneous neurodegenerative disorders including Parkinsonism, autonomic dysfunction, and nonmotor deficits.8, 9, 10 All these disorders share an acceleration of oligomerization or protofibrillization of mutant α‐syn protein.11, 12 In Parkinson's disease (PD) and Dementia with Lewy Bodies (DLB), α‐syn tends to accumulate mostly in neurons, while in multiple system atrophy (MSA), there is extensive accumulation of α‐syn in oligodendroglial cells and, to a lesser extent, in neurons.13, 14, 15 A few cases of familial PD have been linked to missense point mutations in α‐syn with A53T, A30P, E46K, and more recently H50K and G51D.16, 17, 18, 19, 20
As the pathogenesis of human synucleinopathy remains unclear, animal genetic models are highly valuable for understanding the role of this protein in these neurodegenerative disorders.21, 22 Several strategies were used to produce transgenic mice with α‐syn overexpression, sometimes considered rather simplistically as models of PD. Although mouse models do not fully reproduce the pathological changes seen in synucleinopathy patients (ie, dopaminergic cell loss, presence of typical Lewy bodies, etc.), these models have contributed to clarifying the mechanism of α‐syn toxicity in vivo.23, 24, 25
One model of synucleinopathy consists of mice expressing the A53T mutant human α‐syn, under the control of the mouse prion promoter.23 These mice develop severe motor impairments during aging, with neuronal accumulation of aggregated α‐syn phosphorylated at serine 129 in the brain, reminiscent of that found in brain lesions of patients with PD.23 In terms of the behavior of this animal model, several authors reported anxious behavior, detected at the age of 2 months,26, 27, 28 before the onset of motor impairment which typically occurs at > 8 months of age.23 These motor manifestations were linked to loss of dopaminergic neurons in the substantia nigra pars compacta.29 Our team and others recently developed an alternative animal model with accelerated disease progression, more convenient for longitudinal studies and showing less interindividual variability.30, 31 Briefly, it consists in intracerebral inoculation of young (6‐8 weeks old) homozygous transgenic mice with brain homogenates from aged M83 mice with motor impairment. The inoculated mice develop the disease before the age of 8 months, typically 100‐150 days after the experimental challenge, and systematically present α‐syn aggregates in the brainstem and midbrain.23, 32, 33 Another animal model useful for understanding the pathophysiological involvement of α‐syn is the KO mouse model lacking α‐syn. These knockout mice, generated by partially deleting the SNCA gene, are viable, with normal lifespan.6 While α‐syn RNA and protein are undetectable in KO mice, their brains appear largely normal.
Neither murine model has yet been explored in terms of neurotransmission status. The aim of this study was therefore to study, in vivo and for the first time, glucose metabolism and dopaminergic and serotoninergic neurotransmission in murine models with different α‐syn statuses: (i) an α‐syn KO mouse, to reveal the influence of physiological α‐syn; (ii) the corresponding wild‐type model; and (iii) the M83 mouse model of synucleinopathy at an early disease stage, before expression of motor impairment.
The dopamine system was chosen because there is a large literature on the potential involvement of α‐syn in the regulation of dopamine neurotransmission 34 and involvement in the pathophysiology of Parkinson's disease.35 Although degeneration of midbrain dopamine neurons is at the core of the disease and is the main explanation for the motor disability, it is well‐known that α‐syn pathology is more widely distributed in the brain: Nondopaminergic systems are also affected, including the serotonergic neurons. Therefore, it is likely that α‐syn function or dysfunction in serotonergic systems contributes to the wider spectrum of symptoms, such as cognitive impairment and emotional disturbance.36
2. MATERIALS AND METHODS
2.1. Animals and study schedule
Studies were performed with the accelerated mouse model of synucleinopathy previously described.31, 32, 33 In brief, mice were 5 months old at the time of study, that is, 3 months after stereotactic inoculation of brain homogenate from aged M83 mice into the striatum (2 μL per mouse). At this time, none of the studied mice showed any motor signs. For all experiments, the transgenic mice were compared to age‐matched wild‐type (WT) C57Bl/6J mice and knock‐out (KO) α‐syn C57Bl/6S mice, presenting a deletion of the α‐syn locus (Harlan, Gannat, France).
Fifty‐nine female and nine male mice were used: 21 transgenic, 24 WT, and 22 KO. Due to the sensitivity of this animal model to repeated anesthesia and to PET radiotracer availability issues, not all animals could be studied at each test. All experiments were performed in accordance with the European guidelines for care of laboratory animals (2010/63/EU) and were approved by the University of Lyon review board.
The study was chronologically organized as follows (Figure 1): (i) animals were observed daily to detect any change in motor behavior; (ii) in their fifth month of life, the animals underwent MRI and microPET imaging examination (each animal had a maximum 5 microPET examinations, with 5 different radiotracers, within 1 month maximum; (iii) at the end of this imaging period, the animals were sacrificed and explored in vitro (detection of aggregated alpha‐synuclein by Western blot and Thioflavin‐S analysis).
Figure 1.
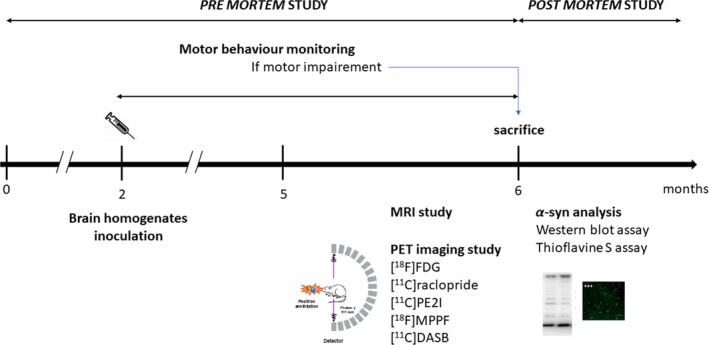
Organization of the experimental protocol. Animals were observed daily to detect any change in their motor behavior; in their fifth month, animals had anatomical MRI and microTEP imaging examinations (each animal had a maximum of 5 microTEP with 5 different radiotracers for a total of less than 1 month; at the end of this imaging period, animals were sacrificed and explored in vitro (detection of aggregated α‐syn by Western blot and Thioflavin‐S analysis)
2.2. Premortem magnetic resonance imaging (MRI)
In vivo imaging in mice requires precise and reproducible delineation of brain structures. This segmentation, performed on brain MRI images, is needed for extraction of regional time‐activity curves in PET studies.
MRI was performed on a 7‐Tesla Bruker system (Biospec®, Bruker Biospin GbmH, Germany) coupled to Bruker BGA12 (450 mT/m) gradients. A 72‐mm diameter Bruker volume coil was used for signal emission and a 15‐mm‐diameter surface coil for signal detection, to provide the best coverage around the mouse brain. Axial anatomical T2‐weighted RARE (Rapid Acquisition with Relaxation Enhancement) images were obtained with the following parameters: effective echo time = 60.28 ms, repetition time = 7500 ms, in‐plane resolution 78 × 78 μm2 and 47 slices of 330 μm thickness, RARE factor = 8, acquisition time = 24 minutes. The MRI images were obtained from scans of C57Bl/6J mice (WT).
The T2 MRI was manually segmented into 20 volumes of interest (VOIs): for example, right and left frontal, parietal, cingulate, temporal and occipital cortexes, right and left hippocampus, caudate putamen, thalamus, and cerebellum, and cerebellar white matter and brainstem, according to Paxinos and Watson's stereotaxic atlas.37 We used this single atlas dataset to extract regional PET measures.
2.3. Premortem microPET imaging
2.3.1. Radiotracers
The radiopharmaceutical [18F]FDG (GlucoTEP®) was obtained from Cyclopharma (Janneyrias, France) and had a chemical and radiochemical purity exceeding 98%.
[11C]raclopride, a D2 receptor antagonist, was synthesized in‐house, in the CERMEP imaging platform. Its chemical and radiochemical purity were determined by high‐performance liquid chromatography and exceeded 95%. Specific activity from the injected radiotracer ranged from 33.103 MBq/μmol to 185.103 MBq/μmol (0.9‐5.0 Ci/μmol).
[11C]PE2I, a dopamine transporter (DAT) radiotracer, was synthesized in‐house, in the CERMEP imaging platform. Its chemical and radiochemical purity were determined by high‐performance liquid chromatography and exceeded 95%. Specific activity from the injected radiotracer ranged from 33.103 MBq/μmol to 240.103 MBq/μmol (0.9‐6.5 Ci/μmol).
[18F]MPPF, a 5‐HT1A receptor radiotracer, was synthesized in‐house, in the CERMEP imaging platform. Its chemical and radiochemical purity were determined by high‐performance liquid chromatography and exceeded 98%. Specific activity from the injected radiotracer ranged from 85.103 MBq/μmol to 326.103 MBq/μmol (2.3‐8.8 Ci/μmol).
[11C]DASB, a serotonin transporter (SERT) radiotracer, was synthesized in‐house, in the CERMEP imaging platform. Its chemical and radiochemical purity were determined by high‐performance liquid chromatography and exceeded 95%. Specific activity from the injected radiotracer ranged from 26 × 103 MBq/μmol to 122 × 103 MBq/μmol (0.7‐3.3 Ci/μmol).
2.3.2. Imaging
Animals were anesthetized using isoflurane (4% induction and 2% maintenance). Breathing rate was monitored throughout the experiment. After catheterization of a caudal vein, the mouse head was centered in the field of view (FOV) of the PET/CT scanner (Inveon®, Siemens, Knoxville, TN, USA). PET scans were acquired in list mode, with a nominal in‐plane resolution of ~1.4 mm full‐width‐at‐half‐maximum in the center of the FOV. Images were reconstructed with attenuation and scatter correction by a 3D‐filtered back‐projection algorithm (Hamming filter; cutoff frequency 0.5 cycles/pixel) and a zoom factor of 2. The reconstructed volume was constituted of 159 slices of 128 × 128 voxels, in a bounding box of 49.7 × 49.7 × 126 mm and with voxel size 0.388 × 0.388 × 0.796 mm. The dynamic images were analyzed with the INVEON research Workplace (IRW, Siemens).
Sixty‐minute list‐mode acquisition started immediately after intravenous caudal injection of the radiotracer. Injected doses were 8.3 ± 1.1 MBq; 8.3 ± 0.6 MBq; 7.4 ± 0.8 MBq and 9.0 ± 0.5 MBq for [11C]raclopride, [11C]PE2I, [18F]MPPF, and [11C]DASB, respectively.
For [18F]FDG imaging, a 20‐minute list‐mode acquisition was made 1 hour after intra‐peritoneal injection of 7.2 ± 2.2 MBq.
2.3.3. Data analysis
Registration and normalization between PET and MRI were computed. PET measures were extracted using the resliced MRI in the PET space. For all radiotracers, PET data were analyzed in two ways:
MRI‐based volume of interest (VOI) method. PET data were extracted using MRI‐based VOIs and expressed as SUVs (Standard Uptake Values). Target‐to‐reference tissue standardized uptake value ratios (SUVRs) were also calculated using cerebellar gray matter as reference region, except for [18F]FDG, for which the temporal cortex was chosen as reference. Statistical analyses were performed using GraphPad Prism® 5.0 software. Two‐way ANOVA with Bonferroni's test for post hoc correction was performed for analyses within subregions. Values were considered to be significantly different for P‐values lower than 0.05.
Voxel‐based analysis. Data were analyzed using Statistical Parametric Mapping software (SPM 12, The Wellcome Trust Center for Neuroimaging, London, UK). We first build our own CT template: All CT scans of all animals were first summed to generate an average image. Each CT scan was then spatially normalized onto this average image, and a template was generated by averaging all the individual normalized CT scans. Each PET volume was then spatially normalized using our custom CT template and smoothed using an isotropic Gaussian filter [1.4 × 1.4 × 1.4 mm]. SPM comparisons were performed using one‐way repeated‐measures analysis of variance (ANOVA), that is, comparisons of M83 vs WT mice vs KO α‐syn mice and comparison of WT mice vs KO α‐syn mice. Global activities were normalized by proportional scaling using the whole brain mean activity of each radiotracer computed for each scan within a template mask of the brain. SPM‐t maps were thresholded at P < 0.001, uncorrected, at the voxel level. Only bilateral clusters were considered significant at this threshold if a‐priori hypothesis existed; otherwise, P FWE‐corrected < 0.05 was used.
2.4. Postmortem alpha‐synuclein detection by Western blot
After euthanasia, mouse brains were carefully removed and immediately frozen in dry ice. Brain tissue was collected, and homogenates were produced. About 20% of homogenates from a half brain were prepared in high‐salt buffer (50 mmol/L Tris‐HCl, pH 7.5, 750 mmol/L NaCl, 5 mmol/L EDTA, 1 mmol/L DTT, 1% phosphatase and protease inhibitor cocktails), using a mechanical homogenizer (grinding balls, FastPrep FPI20, Thermo). After heat denaturation (5 minutes at 100°C), proteins were separated by electrophoresis using 12% SDS polyacrylamide gels before being electroblotted onto polyvinylidene fluoride membranes (Bio‐Rad, Marnes La Coquette, France). α‐syn was probed with either mouse monoclonal antibody (mAb) clone 42 against α‐syn (1:2000) (BD Biosciences, ref 610787), or rabbit mAb against pSer129 α‐syn (1:1000) (Abcam, Cambridge, UK, ref ab51253). Membranes were then incubated with horseradish peroxidase conjugated goat anti‐mouse or anti‐rabbit immunoglobulin (Ig) secondary antibodies (1:1000). The immunocomplexes were visualized with chemiluminescent reagents (Supersignal WestDura, Thermo, ref 34076), followed by exposure on Biomax MR Kodak films, or CL‐Exposure films, and by analysis on dedicated software (Versa Doc system and Quantity One software, both from Bio‐Rad).
2.5. Postmortem Thioflavin‐S analysis
Coronal sections (30 μm thick) were cut across the brainstem, cerebellum, thalamus, hippocampus and cingulate and frontal cortices using a −20°C cryostat (Leica), thaw‐mounted on SuperFrost® glass slides and allowed to air‐dry before storage at −80°C until use. Brain sections were stained with thioflavin‐S (Sigma Aldrich). Staining was performed using sections postfixed in 4% paraformaldehyde. Sections were incubated in thioflavin‐S 0.05% followed by NaOH + H2O treatment. The induced fluorescence was observed on an imaging microscope (Axioplan‐2, Zeiss; Oberkochen, Germany), with an FITC filter (excitation 470 ± 20 nm, emission >515 nm). Images were captured using a digital camera interfaced with an image‐analysis computer (Axiovision 3.0 software, Zeiss).
3. RESULTS
3.1. Imaging
3.1.1. [18F]FDG neuroimaging
[18F]FDG uptake was decreased in the mouse model of synucleinopathy in the whole brain. The difference was significant for 4 regions: caudate putamen, cingulate cortex, hippocampus, and thalamus; SUVRs were 1.42 ± 0.03, 1.26 ± 0.03, 1.26 ± 0.02, and 1.27 ± 0.02, respectively, in M83 mice, vs 1.52 ± 0.02 (NS), 1.46 ± 0.04 (P < 0.0001), 1.37 ± 0.03 (NS) and 1.40 ± 0.03 (P < 0.05) in WT mice and 1.57 ± 0.02 (P < 0.01), 1.52 ± 0.02 (P < 0.0001), 1.39 ± 0.02 (P < 0.05), and 1.45 ± 0.03 (P < 0.0001) in KO α‐syn mice (Figure 2A,B).
Figure 2.
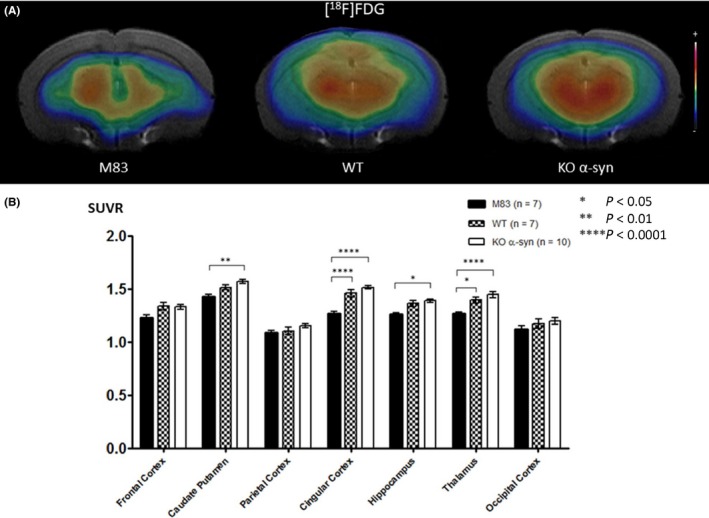
A, Coregistration of MRI and PET images in the transverse plane for M83, WT, and KO α‐syn mice groups. The PET images represent the summed distribution of [18F]FDG, a metabolism radiotracer. B, Results of [18F]FDG with MRI‐based VOI analysis (expressed as SUVR, mean ± SEM) showed significantly decreased radiotracer uptake in the caudate putamen area, parietal cortex, hippocampus, and thalamus of M83 vs KO α‐syn mice
3.1.2. [11C]raclopride PET neuroimaging
According to the MRI‐based VOI method, KO α‐syn mice (Figure 3A) showed a significant decrease in [11C]raclopride uptake in the caudate putamen compared to M83 and WT mice: SUVR was 2.05 ± 0.04 in KO α‐syn mice vs 2.72 ± 0.08 in M83 mice (P < 0.0001), and 2.64 ± 0.07 (P < 0.0001) in WT mice (Figure 3.B). A significant decrease in [11C]raclopride binding was also observed in parietal cortex in KO α‐syn mice (SUVR = 1.57 ± 0.05) compared to the M83 model (SUVR = 1.82 ± 0.05) (P < 0.01).
Figure 3.
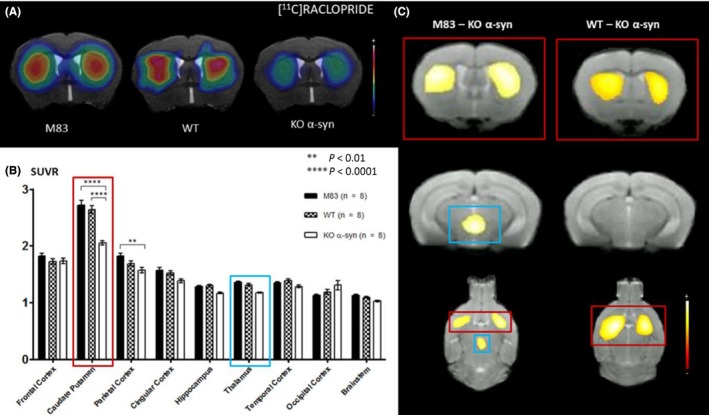
A, Coregistration of MRI and PET images in the transverse plane for M83, WT, and KO α‐syn mice groups. The PET images represent the summed distribution of [11C]raclopride, a D2 receptor antagonist radiotracer. B, Results of [11C]raclopride with MRI‐based VOI analysis (expressed in SUVR, mean ± SEM) showed significantly decreased uptake in the caudate putamen area and parietal cortex of KO α‐syn vs M83 mice. C, Results of voxel‐based analysis, overlaid onto MRI template (coronal slice), reflecting a significant (pFWE‐corrected < 0.05) regional decrease in [11C]raclopride uptake in KO α‐syn mice compared to M83 and WT mice
The voxel‐based analysis method showed a significant (pFWE‐corrected < 0.05) regional decrease in [11C]raclopride uptake in KO α‐syn mice compared to M83 and WT mice. Comparison between KO α‐syn and M83 mice revealed two significant clusters of 13.45 mm3 and 16.55 mm3 found in the right and left caudate putamen regions, respectively (Figure 3C, in red), and one of 3.82 mm3 in the thalamus (Figure 3C, in blue). Comparison between KO and WT mice revealed two significant clusters of 11.59 mm3 and 15.36 mm3 found in the right and left caudate putamen regions, respectively (Figure 3C, in red). No significant differences in [11C]raclopride binding were observed between M83 and WT mice with these two methods.
3.1.3. [11C]PE2I neuroimaging
MicroPET images (Figure 4A) showed a trend for increased [11C]PE2I uptake in the caudate putamen area in KO α‐syn vs M83 and WT mice: SUVR, 7.23 ± 0.21, 6.77 ± 0.32 and 6.38 ± 0.21, respectively. DAT overexpression seemed to be observed in the parietal cortex: SUVR, 3.37 ± 0.11 for M83, 2.87 ± 0.09 for WT and 2.98 ± 0.14 for KO α‐syn mice. Results are shown in Figure 4B.
Figure 4.
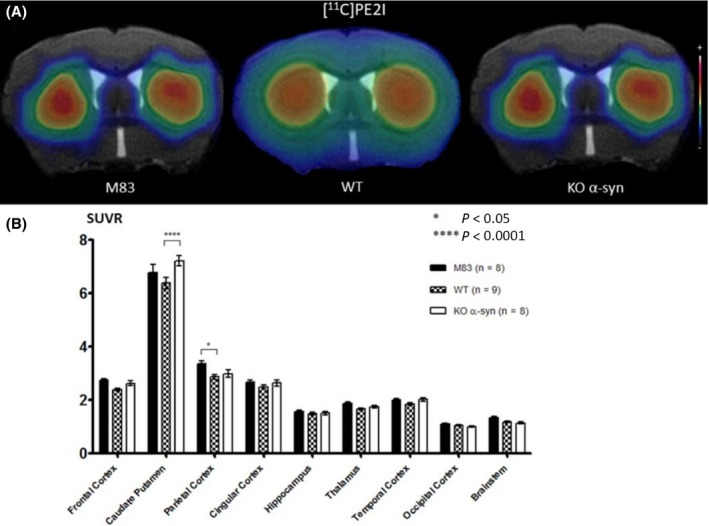
A, Coregistration of MRI and PET images in the transverse plane for M83, WT, and KO α‐syn mice groups. The PET images represent the summed distribution of [11C]PE2I, a dopamine transporter radiotracer. B, Results of [11C]PE2I with MRI‐based VOI analysis (expressed in SUVR, mean ± SEM) showed significantly increased uptake in the caudate putamen area of KO α‐syn vs WT mice and significantly increased uptake in the parietal cortex of M83 vs WT mice
Voxel‐based analysis revealed no significant differences for [11C]PE2I uptake between the three groups of mice.
3.1.4. [18F]MPPF neuroimaging
With the MRI‐based VOI method, microPET images (Figure 5A) showed significant differences in [18F]MPPF uptake in the M83 mouse model of synucleinopathy in comparison with KO α‐syn mice. SUVRs were 2.08 ± 0.17 and 1.51 ± 0.12 in the frontal and cingulate cortices in M83 mice, respectively, vs 1.61 ± 0.08 (NS) and 1.23 ± 0.10 (NS) in WT mice and 1.40 ± 0.07 (P < 0.05) and 0.95 ± 0.03 (P < 0.01) in KO α‐syn mice (Figure 5B). Significant differences in [18F]MPPF uptake were also observed between WT and KO α‐syn mice (<0.01) in the caudate putamen, and there were no significant differences between M83 vs KO α‐syn and WT mice in other brain regions, particularly in the hippocampus but also in parietal, temporal, and occipital cortices and, less obviously, in the brainstem. A staircase graph was observed, in which the upper third was represented by M83 mice and the lower third by KO α‐syn mice, with the mid‐third represented by WT mice.
Figure 5.
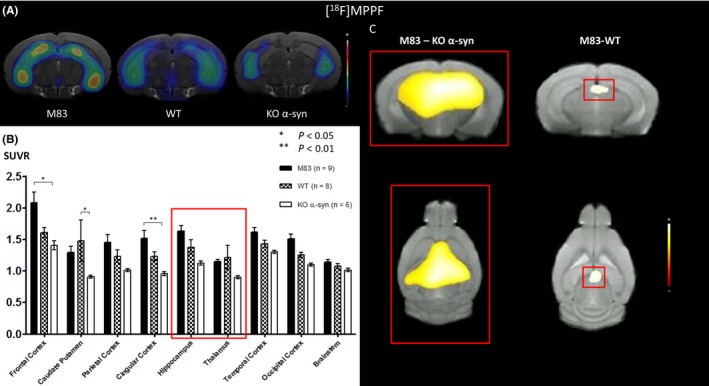
A, Coregistration of MRI and PET images in the transverse plane for M83, WT, and KO α‐syn mice groups. The PET images represent the summed distribution of [18F]MPPF, a 5‐HT 1A receptor antagonist radiotracer. B, Results of [18F]MPPF with MRI‐based VOI analysis (expressed in SUVR, mean ± SEM) showed significant differences of uptake in the frontal and cingular cortex of M83 vs KO α‐syn mice. C, Results of voxel‐based analysis, overlaid onto MRI template (coronal slice), reflecting a significant (PFWE‐corrected < 0.05) regional increase of [18F]MPPF uptake in hippocampus and thalamus in M83 mice compared to KO α‐syn mice. Results of voxel‐based analysis, overlaid onto MRI template (coronal slice), revealing one cluster of increased [18F]MPPF uptake (P < 0.001 uncorrected) in thalamus in M83 mice compared to WT mice
Voxel‐based analysis revealed a significant (P FWE‐corrected < 0.05) regional increase in [18F]MPPF uptake in M83 mice compared to KO α‐syn mice. One significant cluster of 55.26 mm3 was found in the hippocampus and thalamus areas (Figure 5C, in red). Comparison of M83 with WT mice revealed one cluster of 0.99 mm3 (P < 0.001 uncorrected) in the thalamus (Figure 5C in red). No significant differences in [18F]MPPF binding were observed between WT and KO α‐syn mice using this method.
3.1.5. [11C]DASB neuroimaging
No significant differences in [11C]DASB uptake were observed between the M83, WT, and KO mice groups, whatever the analysis method (Figure 6A,B).
Figure 6.
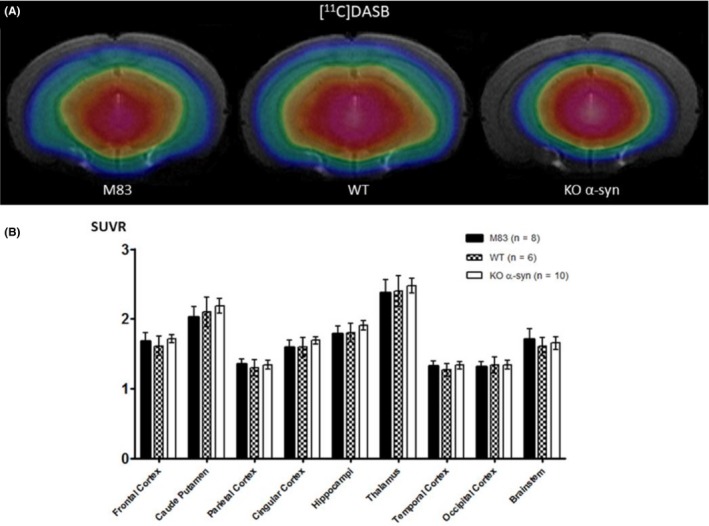
A, Coregistration of MRI and PET images in the transverse plane for M83, WT, and KO α‐syn mice groups. The PET images represent the summed distribution of [11C]DASB, a serotonin transporter radiotracer. B, Results of [11C]DASB with MRI‐based VOI analysis (expressed in SUVR, mean ± SEM). Data showed no significant differences in binding between the 3 groups of mice, regardless of the region of the brain studied
3.2. Animal monitoring
Results of behavioral monitoring are shown in Figure 7A. During the PET study period, 55% of mice developed neurological symptoms and were therefore sacrificed, in accordance with the guidelines for care of laboratory animals. Other mice were sacrificed at the end of PET study. All mice were between 5 and 6 months old.
Figure 7.
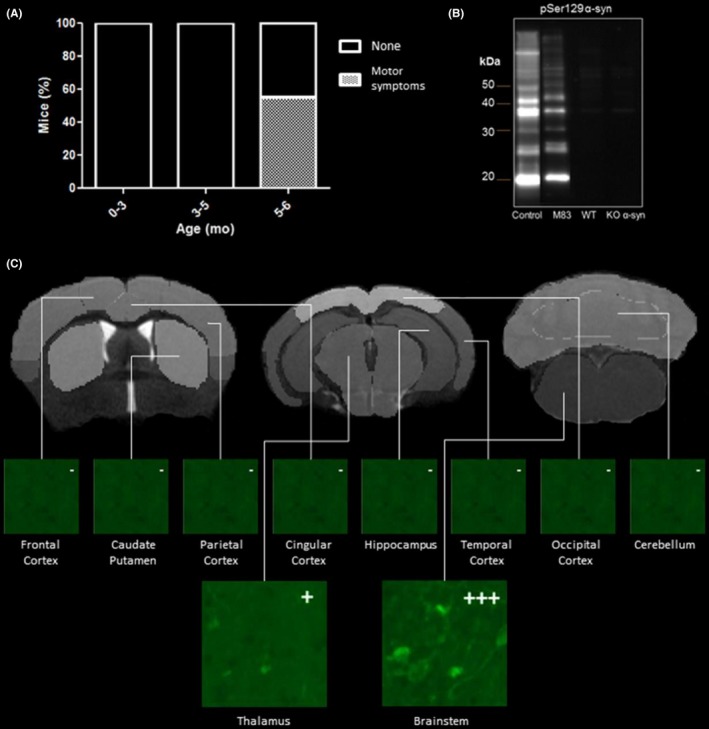
A, Panels show the occurrence of symptoms. B, Western blot detection of α‐syn using antibody pSer129 α‐syn in insoluble fraction after biochemical extraction of 20% half‐brain homogenates (m/v) from M83, W,T and α‐syn KO mice. The positions of molecular mass markers are depicted on the left. The Western blot shows accumulation of insoluble and aggregated α‐syn in M83 mice and total absence in WT and α‐syn KO mice (arrows). The positive control consists of symptomatic M83 brain tissue. C, Thioflavin‐S staining in M83 mice: β‐sheet structures are revealed mainly in the brainstem and, to a lesser extent, in the thalamus. No staining is visible in other VOIs studied
3.3. Alpha‐synuclein detection by Western blot and thioflavin‐S analysis
Western blot studies in brain tissue revealed insoluble pSer129 α‐syn in M83 mice. Accumulation of α‐syn was not detected in α‐syn KO mice (Figure 7B).
Thioflavin‐S staining in brain sections showed the presence of β‐sheet structures in the brainstem and thalamus in M83 mice. No fluorescent signal was observed in the frontal or cingulate cortices, cerebellum or hippocampus (Figure 7C). Fluorescence was negative in WT and α‐syn KO brain sections for all regions tested (data not shown).
4. DISCUSSION
To our knowledge, this is the first study that explored the role of α‐syn on neurotransmission using three animal models that express different levels of the protein: reduced expression in the KO model, physiological expression in the WT model, and pathological overexpression in the accelerated M83 model of synucleinopathy. We used PET as a unique nuclear medicine technology, enabling in vivo measurement of physiological processes, biochemical pathways and neurotransmitters, and thus having an important role in studying the pathophysiology and pharmacology of the brain.38 One of the main contributions of microPET is that it allows the same experiments to be performed in rodents, nonhuman primates, and humans, enabling longitudinal studies and facilitating translation between basic and clinical research, particularly in neurodegenerative diseases such as Parkinson's and Alzheimer's.39, 40
Our study focused on the prodromal stage of the accelerated animal model of synucleinopathy, with the aim of detecting changes in neurotransmission, which could be translated into clinical research as early biomarkers of neurodegenerative disease. At this stage (ie, the age of 5 months), pathological α‐syn was detected mainly in the brainstem and more moderately in the thalamus; no or only moderate neurological/motor symptoms were observed. These results are close to those described previously 31 and thus confirm the robustness of this animal model.
MicroPET data obtained with [18F]FDG revealed early hypometabolism in many brain regions of M83 mice, such as the caudate putamen, cingulate cortex, hippocampus, and thalamus. Although this decrease in glucose metabolism can be compared with similar studies in Parkinson' disease patients,39, 40 the limitation of this metabolic tracer is its lack of specificity and identification of specific molecular events. We therefore focused imaging exploration on dopaminergic and serotoninergic pathways, using, for each system, a receptor and a transporter radiotracer: D2 receptors ([11C]raclopride), dopamine transporter ([11C]PE2I), 5‐HT1A receptors ([18F]MPPF), and serotonin transporters ([11C]DASB).
In terms of methodology, the study was based on two classical methods of PET data processing, not in order to compare both methods but rather to be as exhaustive as possible in interpreting the PET data. MRI‐based VOI analysis involves a priori assumptions about the cerebral localization of the results. For the predefined analysis regions, we drew 20 VOIs throughout the brain covering the main cerebral structures. The limitation of this approach was mainly that significant variations were only observed after further segmentation of VOI “meta‐structures”.41 Voxel‐based analysis is a method based on the absence of a priori assumptions of brain regions of interest. It provides more information on the location of changes in neurotransmission, but has the disadvantage of being less sensitive.
Concerning the exploration of dopaminergic neurotransmission, the MRI‐based VOI method showed lower uptake of [11C]raclopride in the caudate putamen of KO α‐syn compared to M83 and WT mice. Voxel‐based analysis showed the same results: Two significant clusters were identified in the caudate putamen area, and one more in the thalamus comparing M83 vs KO α‐syn mice. Moreover, two significant clusters were identified in the caudate putamen area comparing WT vs KO α‐syn mice. These results confirm the role of α‐syn in dopamine neurotransmission. The low density of D2 receptors we observed is in accordance with the slight deficit of dopaminergic neurons in the substantia nigra of KO mice.42, 43 Our results are consistent with the hypothesis that α‐syn is important for normal synaptic function and integrity.
Complementarily, PET exploration with [11C]PE2I did not reveal any differences in DAT density between the three groups. SPM analysis confirmed this lack of effect of α‐syn status on transporter density. These results can be compared with previous studies reporting that DAT function increased occasionally in 2‐ to 4‐month‐old A53T mice but not at older ages when symptoms occurred.27 In our study, we were not able to follow longitudinally our mouse model because of the vulnerability of mice to repeated anesthesia. Therefore, we cannot exclude that a transitory overexpression of DAT might have occurred at an earlier stage of the M83 model of synucleinopathy. Our results, showing stable DAT binding, are in favor of unchanged dopaminergic neuron density in the three mouse models. This is in agreement with a previous electron microscopy study showing that the absence of α‐syn in KO transgenic mice had no effect on the levels of synaptic proteins, including synapsin, synaptophysin, and SNAP‐25.6 More generally, the presence of physiological or aggregated α‐syn seems to have functional (D2 density) more than neuroanatomical effects (DAT density) on dopaminergic neurotransmission.
Complementary microdialysis studies would help to understand the links between dopamine neurotransmission and physiological and pathological α‐syn expression.
Concerning the serotoninergic neurotransmission, the MRI‐based VOI method showed a significant increase in [18F]MPPF binding in the frontal and cingulate cortices in M83 vs KO α‐syn mice. In these regions, no significant differences were observed between M83 and WT mice or between WT and KO α‐syn mice. Voxel‐based analysis also revealed an increase in [18F]MPPF binding in the hippocampus and/or thalamus in M83 vs WT and KO α‐syn mice. However, different brain regions were identified according to the chosen method.44 This difference would probably fade if the number of animals was increased. The general trend of results was the same: overexpression of 5‐HT1A receptors at the early stage of the model of synucleinopathy. At this stage, it would be interesting to investigate whether these receptors are the consequence of transient astroglial overexpression of 5‐HT1A receptors, compensating neuronal decrease of the same receptors.45
Complementarily, PET scanning of serotonin transporters by [11C]DASB showed no modification of the transporter, in favor of unchanged serotoninergic neuron density. This is in agreement with previous studies showing that SERT expression did not change between the ages of 8 and 12 months in M83 mice,28 with no loss of serotonergic neurons.46 Here again, complementary microdialysis studies would help to understand the links between serotonin neurotransmission and physiological and pathological α‐syn expression.
5. CONCLUSION
This study highlights the influence of α‐syn on the dopaminergic and serotoninergic systems. Physiological α‐syn modulates the expression of the D2 receptor, whereas only the pathological α‐syn modulates the expression of the 5‐HT1A receptor, as a pathophysiological signature. These results are original but need now to be completed, to decipher these subtle pathophysiological mechanisms more precisely. Microdialysis studies in awake animals would help to understand the links between dopamine and serotonin neurotransmission on the one hand and physiological and pathological α‐syn expression on the other. More generally, our results highlight the interest of in vivo PET neuroimaging with the same radiotracers for the exploration of neurotransmission reactivity in the synucleinopathy models. Finally, this PET translational approach encourages designing clinical studies associating the same radiopharmaceuticals to explore early stages of neurodegenerative pathologies, such as Parkinson's disease.
CONFLICTS OF INTEREST
All experiments were conducted in compliance with the ARRIVE guidelines. The authors have no conflicts of interest to declare.
ACKNOWLEDGMENTS
The authors thank all members of the chemistry unit of the CERMEP for tracer radiosyntheses (Dr D. Le Bars, F. Liger, F. Bonnefoi, T Iecker, C. Tourvieille) and Jérôme Redouté, from the PET department of the CERMEP for his contribution to data analysis. This work was performed within the framework of the LABEX PRIMES of the University of Lyon, operated by the French National Research Agency (ANR).
Levigoureux E, Bouillot C, Baron T, Zimmer L, Lancelot S. PET imaging of the influence of physiological and pathological α‐synuclein on dopaminergic and serotonergic neurotransmission in mouse models. CNS Neurosci Ther. 2019;25:57–68. 10.1111/cns.12978
REFERENCES
- 1. Davidson WS, Jonas A, Clayton DF, George JM. Stabilization of alpha‐synuclein secondary structure upon binding to synthetic membranes. J Biol Chem. 1998;273:9443‐9449. [DOI] [PubMed] [Google Scholar]
- 2. Ulmer TS, Bax A, Cole NB, Nussbaum RL. Structure and dynamics of micelle‐bound human alpha‐synuclein. J Biol Chem. 2005;280:9595‐9603. [DOI] [PubMed] [Google Scholar]
- 3. Maroteaux L, Campanelli JT, Scheller RH. Synuclein: a neuron‐specific protein localized to the nucleus and presynaptic nerve terminal. J Neurosci. 1988;8:2804‐2815. [DOI] [PMC free article] [PubMed] [Google Scholar]
- 4. Iwai A, Masliah E, Yoshimoto M, et al. The precursor protein of non‐A beta component of Alzheimer's disease amyloid is a presynaptic protein of the central nervous system. Neuron. 1995;14:467‐475. [DOI] [PubMed] [Google Scholar]
- 5. Souza JM, Giasson BI, Lee VM, Ischiropoulos H. Chaperone‐like activity of synucleins. FEBS Lett. 2000;474:116‐119. [DOI] [PubMed] [Google Scholar]
- 6. Cabin DE, Shimazu K, Murphy D, et al. Synaptic vesicle depletion correlates with attenuated synaptic responses to prolonged repetitive stimulation in mice lacking alpha‐synuclein. J Neurosci. 2002;22:8797‐8807. [DOI] [PMC free article] [PubMed] [Google Scholar]
- 7. Chandra S, Gallardo G, Fernandez‐Chacon R, Schluter OM, Sudhof TC. Alpha‐synuclein cooperates with CSPalpha in preventing neurodegeneration. Cell. 2005;123:383‐396. [DOI] [PubMed] [Google Scholar]
- 8. Galvin JE, Lee VM, Trojanowski JQ. Synucleinopathies: clinical and pathological implications. Arch Neurol. 2001;58:186‐190. [DOI] [PubMed] [Google Scholar]
- 9. Goedert M. Alpha‐synuclein and neurodegenerative diseases. Nat Rev Neurosci. 2001;2:492‐501. [DOI] [PubMed] [Google Scholar]
- 10. Trojanowski JQ, Lee VM. Parkinson's disease and related alpha‐synucleinopathies are brain amyloidoses. Ann N Y Acad Sci. 2003;991:107‐110. [DOI] [PubMed] [Google Scholar]
- 11. Conway KA, Rochet JC, Bieganski RM, Lansbury PT Jr. Kinetic stabilization of the alpha‐synuclein protofibril by a dopamine‐alpha‐synuclein adduct. Science. 2001;294:1346‐1349. [DOI] [PubMed] [Google Scholar]
- 12. Choi W, Zibaee S, Jakes R, et al. Mutation E46K increases phospholipid binding and assembly into filaments of human alpha‐synuclein. FEBS Lett. 2004;576:363‐368. [DOI] [PubMed] [Google Scholar]
- 13. Lantos PL, Papp MI. Cellular pathology of multiple system atrophy: a review. J Neurol Neurosurg Psychiatry. 1994;57:129‐133. [DOI] [PMC free article] [PubMed] [Google Scholar]
- 14. Wakabayashi K, Takahashi H. Cellular pathology in multiple system atrophy. Neuropathology. 2006;26:338‐345. [DOI] [PubMed] [Google Scholar]
- 15. Yoshida M. Multiple system atrophy: alpha‐synuclein and neuronal degeneration. Neuropathology. 2007;27:484‐493. [DOI] [PubMed] [Google Scholar]
- 16. Polymeropoulos MH, Lavedan C, Leroy E, et al. Mutation in the alpha‐synuclein gene identified in families with Parkinson's disease. Science. 1997;276:2045‐2047. [DOI] [PubMed] [Google Scholar]
- 17. Kruger R, Kuhn W, Muller T, et al. Ala30Pro mutation in the gene encoding alpha‐synuclein in Parkinson's disease. Nat Genet. 1998;18:106‐108. [DOI] [PubMed] [Google Scholar]
- 18. Zarranz JJ, Alegre J, Gomez‐Esteban JC, et al. The new mutation, E46K, of alpha‐synuclein causes Parkinson and Lewy body dementia. Ann Neurol. 2004;55:164‐173. [DOI] [PubMed] [Google Scholar]
- 19. Appel‐Cresswell S, Vilarino‐Guell C, Encarnacion M, et al. Alpha‐synuclein p. H50Q, a novel pathogenic mutation for Parkinson's disease. Mov Disord. 2013;28:811‐813. [DOI] [PubMed] [Google Scholar]
- 20. Lesage S, Anheim M, Letournel F, et al. G51D alpha‐synuclein mutation causes a novel parkinsonian‐pyramidal syndrome. Ann Neurol. 2013;73:459‐471. [DOI] [PubMed] [Google Scholar]
- 21. Caudal D, Alvarsson A, Bjorklund A, Svenningsson P. Depressive‐like phenotype induced by AAV‐mediated overexpression of human alpha‐synuclein in midbrain dopaminergic neurons. Exp Neurol. 2015;273:243‐252. [DOI] [PubMed] [Google Scholar]
- 22. Magnard R, Vachez Y, Carcenac C, et al. What can rodent models tell us about apathy and associated neuropsychiatric symptoms in Parkinson's disease? Transl Psychiatry. 2016;6:e753. [DOI] [PMC free article] [PubMed] [Google Scholar]
- 23. Giasson BI, Duda JE, Quinn SM, Zhang B, Trojanowski JQ, Lee VM. Neuronal alpha‐synucleinopathy with severe movement disorder in mice expressing A53T human alpha‐synuclein. Neuron. 2002;34:521‐533. [DOI] [PubMed] [Google Scholar]
- 24. Lee MK, Stirling W, Xu Y, et al. Human alpha‐synuclein‐harboring familial Parkinson's disease‐linked Ala‐53 –> Thr mutation causes neurodegenerative disease with alpha‐synuclein aggregation in transgenic mice. Proc Natl Acad Sci USA. 2002;99:8968‐8973. [DOI] [PMC free article] [PubMed] [Google Scholar]
- 25. Masliah E, Rockenstein E, Veinbergs I, et al. Dopaminergic loss and inclusion body formation in alpha‐synuclein mice: implications for neurodegenerative disorders. Science. 2000;287:1265‐1269. [DOI] [PubMed] [Google Scholar]
- 26. George S, van den Buuse M, San Mok S, Masters CL, Li QX, Culvenor JG. Alpha‐synuclein transgenic mice exhibit reduced anxiety‐like behaviour. Exp Neurol. 2008;210:788‐792. [DOI] [PubMed] [Google Scholar]
- 27. Oaks AW, Frankfurt M, Finkelstein DI, Sidhu A. Age‐dependent effects of A53T alpha‐synuclein on behavior and dopaminergic function. PLoS ONE. 2013;8:e60378. [DOI] [PMC free article] [PubMed] [Google Scholar]
- 28. Graham DR, Sidhu A. Mice expressing the A53T mutant form of human alpha‐synuclein exhibit hyperactivity and reduced anxiety‐like behavior. J Neurosci Res. 2010;88:1777‐1783. [DOI] [PMC free article] [PubMed] [Google Scholar]
- 29. Cacabelos R. Parkinson's disease: from pathogenesis to pharmacogenomics. Int J Mol Sci. 2017;18:551. [DOI] [PMC free article] [PubMed] [Google Scholar]
- 30. Luk KC, Kehm VM, Zhang B, O'Brien P, Trojanowski JQ, Lee VM. Intracerebral inoculation of pathological alpha‐synuclein initiates a rapidly progressive neurodegenerative alpha‐synucleinopathy in mice. J Exp Med. 2012;209:975‐986. [DOI] [PMC free article] [PubMed] [Google Scholar]
- 31. Mougenot AL, Nicot S, Bencsik A, et al. Prion‐like acceleration of a synucleinopathy in a transgenic mouse model. Neurobiol Aging. 2012;33:2225‐2228. [DOI] [PubMed] [Google Scholar]
- 32. Betemps D, Verchere J, Brot S, et al. Alpha‐synuclein spreading in M83 mice brain revealed by detection of pathological alpha‐synuclein by enhanced ELISA. Acta Neuropathol Commun. 2014;2:29. [DOI] [PMC free article] [PubMed] [Google Scholar]
- 33. Levigoureux E, Lancelot S, Bouillot C, et al. Binding of the PET radiotracer [18F]BF227 does not reflect the presence of alpha‐synuclein aggregates in transgenic mice. Curr Alzheimer Res. 2014;11:955‐960. [DOI] [PubMed] [Google Scholar]
- 34. Butler B, Sambo D, Khoshbouei H. Alpha‐synuclein modulates dopamine neurotransmission. J Chem Neuroanat. 2017;83–84:41‐49. [DOI] [PMC free article] [PubMed] [Google Scholar]
- 35. Factor SA, McDonald WM, Goldstein FC. The role of neurotransmitters in the development of Parkinson's disease‐related psychosis. Eur J Neurol. 2017;24:1244‐1254. [DOI] [PubMed] [Google Scholar]
- 36. Wan OW, Shin E, Mattsson B, Caudal D, Svenningsson P, Bjorklund A. Alpha‐Synuclein induced toxicity in brain stem serotonin neurons mediated by an AAV vector driven by the tryptophan hydroxylase promoter. Sci Rep. 2016;6:26285. [DOI] [PMC free article] [PubMed] [Google Scholar]
- 37. Paxinos G, Franklin KBJ. The Mouse Brain in Stereotaxic Coordinates. Compact 2nd edn Amsterdam; Boston: Elsevier Academic Press; 2004. [Google Scholar]
- 38. Lancelot S, Zimmer L. Small‐animal positron emission tomography as a tool for neuropharmacology. Trends Pharmacol Sci. 2010;31:411‐417. [DOI] [PubMed] [Google Scholar]
- 39. Akdemir UO, Tokcaer AB, Karakus A, Kapucu LO. Brain 18F‐FDG PET imaging in the differential diagnosis of parkinsonism. Clin Nucl Med. 2014;39:e220‐e226. [DOI] [PubMed] [Google Scholar]
- 40. Besson FL, La Joie R, Doeuvre L, et al. Cognitive and brain profiles associated with current neuroimaging biomarkers of preclinical Alzheimer's disease. J Neurosci. 2015;35:10402‐10411. [DOI] [PMC free article] [PubMed] [Google Scholar]
- 41. Dubois A, Herard AS, Delatour B, et al. Detection by voxel‐wise statistical analysis of significant changes in regional cerebral glucose uptake in an APP/PS1 transgenic mouse model of Alzheimer's disease. NeuroImage. 2010;51:586‐598. [DOI] [PubMed] [Google Scholar]
- 42. Al‐Wandi A, Ninkina N, Millership S, Williamson SJ, Jones PA, Buchman VL. Absence of alpha‐synuclein affects dopamine metabolism and synaptic markers in the striatum of aging mice. Neurobiol Aging. 2010;31:796‐804. [DOI] [PMC free article] [PubMed] [Google Scholar]
- 43. Specht CG, Schoepfer R. Deletion of the alpha‐synuclein locus in a subpopulation of C57BL/6J inbred mice. BMC Neurosci. 2001;2:11. [DOI] [PMC free article] [PubMed] [Google Scholar]
- 44. Welch A, Mingarelli M, Riedel G, Platt B. Mapping changes in mouse brain metabolism with PET/CT. J Nucl Med. 2013;54:1946‐1953. [DOI] [PubMed] [Google Scholar]
- 45. Verdurand M, Berod A, Le Bars D, Zimmer L. Effects of amyloid‐beta peptides on the serotoninergic 5‐HT1A receptors in the rat hippocampus. Neurobiol Aging. 2011;32:103‐114. [DOI] [PubMed] [Google Scholar]
- 46. Deusser J, Schmidt S, Ettle B, Plotz S, Huber S, Muller CP, et al. Serotonergic dysfunction in the A53T alpha‐synuclein mouse model of Parkinson's disease. J Neurochem. 2015;135:589‐597. [DOI] [PMC free article] [PubMed] [Google Scholar]


