Abstract
Characterization, especially quantification, of protein interactions in live cells is usually not an easy endeavor. Here, we describe a straightforward method to identify and quantify the interaction of a membrane protein (“bait”) and a fluorescently labeled interaction partner (“prey”) (membrane-bound or cytosolic) in live cells using Total Internal Reflection microscopy. The bait protein is immobilized within patterns in the plasma membrane (e.g. via an antibody); the bait-prey interaction strength can be quantified by determining the prey bulk fluorescence intensity with respect to the bait patterns. This method is particularly suitable also for the analysis of weak, transient interactions that are not easily accessible with other methods.
Keywords: Micropatterning, Protein-protein interactions, Soft lithography, TIRF microscopy, Quantitive analysis, Membrane proteins
1. Introduction
Although there are many methods to analyze protein-protein interactions, quantitative analysis of protein interactions in live cells is still less than straightforward. Most approaches rely on immunoprecipitation, affinity purification or chemical crosslinking and, thus, analysis of cell lysates (1,2). In live cells, assays are rather challenging, laborious, suffer from detection of false positives or negatives, do not allow for easy quantification, and/or are not readily accessible for many labs (e.g. Bimolecular Fluorescence Complementation (3), Yeast Two-hybrid Screen (4), Fluorescence Resonance Energy Transfer (5) or single-molecule methods (6)).
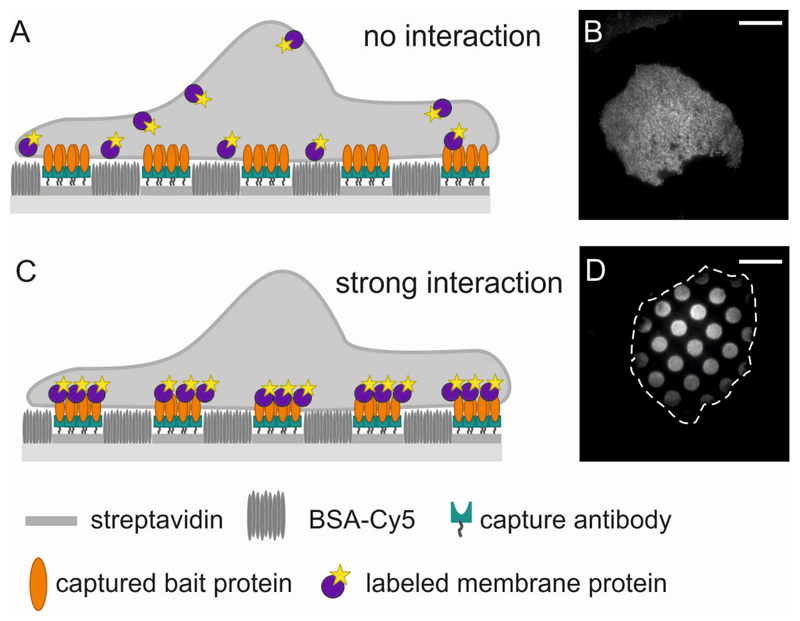
Protein Micropatterning is a technique that circumvents many of these problems: it is simple, inexpensive, no elaborate equipment is necessary, it can also capture transient interactions, it is performed in live cells, and data analysis is uncomplicated. The method is based on the work of several groups who forced membrane proteins into specific patterns within the plasma membrane of living cells (7,8). We have extended this approach to use it as a tool for characterization and quantification of protein interactions: One interaction partner (bait) is restricted to specific regions (typically regular micropatterns) in the live cell plasma membrane and the lateral distribution of a fluorescently labeled interaction partner (prey) is monitored. In case of an interaction, prey molecules will follow the bait pattern; homogeneous distribution of prey protein in the plasma membrane indicates the absence of an interaction (Figure 1). Quantification can be achieved by comparing the prey signal intensity within and outside the bait regions: the signal contrast between these regions provides a measure of the interaction strength.
Figure 1. Principle of Protein Micropatterning in the plasma membrane.
(A) Sketch and (B) TIRF image of a cell grown on a micropatterned substrate. Bait antibody is arranged in a regular pattern of 3 μm sized dots with 3 μm interspaces. The bait protein (unlabeled) reorganizes according to the antibody patterns, but the fluorescently labeled prey protein is distributed homogeneously in the plasma membrane, indicating no interaction between bait and prey protein. Scale bar is 7 μm. (C,D) As in (A,B), but here the prey protein interacts strongly with the bait protein and localizes according to the bait patterns. The cell outline is indicated by a dashed white contour line.
While patterned surfaces can be generated by different methods (e.g. photolithography (9) or dip-pen nanolithography (10)), soft lithography (11) is probably the most convenient: it is fast, simple, and lends itself to high throughput routines. In this protocol, the patterned cell substrate is produced by printing streptavidin patterns on a glass coverslip, to which a bait-specific biotinylated antibody is then attached. We have first used this approach to characterize the interaction of two proteins involved in immunosignaling: CD4, a transmembrane protein, and the tyrosine kinase Lck, a palmitoylated protein that is transiently associated with the plasma membrane (12). Since then, it has been applied to characterize various protein-protein interactions in several different cell types (10,13–17) and has been used to determine protein binding curves (18) and dissociation constants (19). Recently, we have also used Protein Micropatterning to interrogate lipid-mediated protein interactions (20). Versions of the Protein Micropatterning Assay have been reviewed in (21,22).
2. Materials
Prepare all work solutions fresh each time. Store epoxy-coated coverslips in the desiccator after opening. This protocol is optimized for PDMS stamps; if a different material is used, conditions may need to be adjusted for optimal printing results.
Polydimethylsiloxane (PDMS) stamps (see Note 1)
Epoxy-coated coverslips: NEXTERION® slide E (Schott, Germany)
Streptavidin stock solution: dissolve 0.5 mg/mL streptavidin (Sigma, USA) in phosphate buffered saline (PBS) pH 7.4. Store aliquots at -20°C. Do not freeze and thaw.
Streptavidin work solution: dilute streptavidin stock solution to 50 μg/mL in PBS pH 7.4.
Secure Seal Hybridization chambers (Grace Biolabs, USA)
BSA-Cy5 stock solution (see Note 2): dissolve Cy5-labeled bovine serum albumin (BSA-Cy5; Nanocs, USA) to 1 mg/mL in PBS pH 7.4. Store aliquots at -20°C. Do not freeze and thaw.
BSA-Cy5 work solution: dilute BSA-Cy5 stock solution to 100 μg/mL in PBS pH 7.4.
Antibody work solution: dilute biotinylated antibody to 10 μg/mL in PBS pH 7.4 containing 1% BSA.
Imaging buffer: Hank’s Balanced Salt Solution (HBSS) with Ca2+ and Mg2+ and 2% fetal calf serum (FCS) (see Note 3).
Cells expressing bait proteins and fluorescent prey proteins (see Note 4), Accutase (Sigma, USA) (see Note 5).
3. Methods
Carry out all procedures at room temperature unless otherwise specified.
3.1. Soft lithography and functionalization
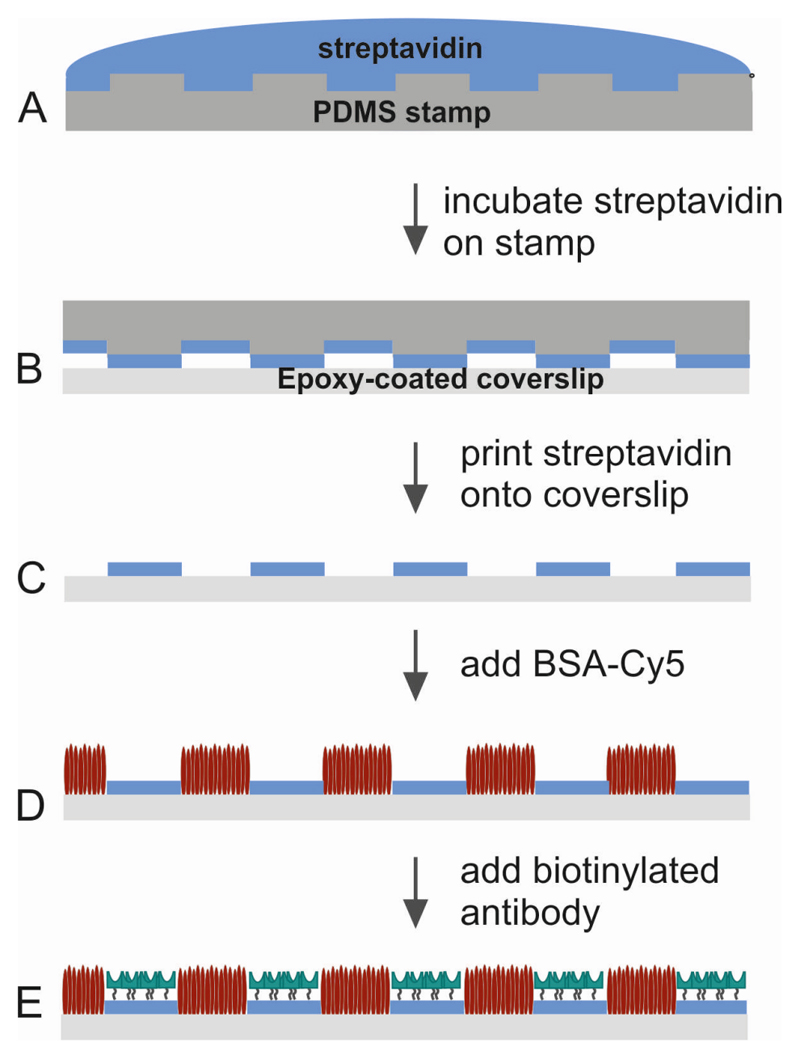
The workflow of “3.1 Soft lithography and functionalization” is sketched in Figure 2.
Figure 2. Soft lithography and functionalization.
(A) Streptavidin work solution is incubated on a PDMS stamp. (B) After washing and drying of the stamp, streptavidin is printed onto an epoxy-coated coverslip. (C,D) The stamp is removed; BSA-Cy5 is added to fill the interspaces. (E) When biotinylated antibody is added, it binds specifically to the streptavidin patterns.
Wash PDMS stamp by rinsing with ethanol (p.a.) and ultrapure water. Dry the PDMS stamp under a stream of a dry inert gas such as nitrogen or argon.
Place ~50 μL of streptavidin work solution (50 μg/ml) on the PDMS stamp (the whole pattern area should be covered). Let protein adsorb to stamp for 15 min at room temperature (see Note 6).
Wash the PDMS stamp by rinsing carefully with water and dry under a stream of nitrogen or argon.
Place the PDMS stamp face-down under its own weight onto an epoxy-coated coverslip and incubate for 30 min at room temperature or overnight at 4°C in a humidified atmosphere (e.g. a Petri dish with a wet tissue) (see Note 7).
Mark the position of the patterned area on the back of the coverslip with a water-resistant marker and separate the stamp from the slide using tweezers (see Note 8).
Stick a Secure Seal Hybridization chamber over the marked area.
Add BSA-Cy5 work solution (100 μg/ml) to the hybridization chamber and incubate for 15 min at room temperature (see Note 9).
Wash with 500 μl PBS by adding the buffer into one port of the hybridization chamber and removing it at the second port.
Add antibody work solution (10 μg/ml) to the hybridization chamber and incubate for 15 min at room temperature.
Wash with 500 μl PBS.
Store the micropatterned surfaces with PBS in the dark at room temperature until seeding of cells (see Note 10).
3.2. Seeding cells
Grow adherent cells expressing bait and prey proteins of interest to 70% confluency in a 10 cm tissue culture dish.
Detach cells with Accutase solution and centrifuge 4 min at 300xg. This protocol has been tested for T24, HeLa and CHO cells (see Note 11).
Pellet cells by spinning for 5 min at ~300xg.
Discard the supernatant and resuspend the cell pellet in 1 mL of the appropriate growth medium. Then, dilute this ~1:10 in growth medium (see Note 12).
Remove the PBS from the hybridization chamber on the micropatterned coverslip and seed cell suspension.
Check cell density on a light microscope. Cells should be single but not too sparse.
Put coverslips in a Petri dish humidity chamber to prevent the sample from running dry and incubate for 1.5-2 hours at 37°C in a 5% CO2 atmosphere.
Before analyzing the cells on the microscope, replace the medium with imaging buffer.
3.3. Total Internal Reflection Fluorescence (TIRF) Microscopy
3.4. Contrast quantitation
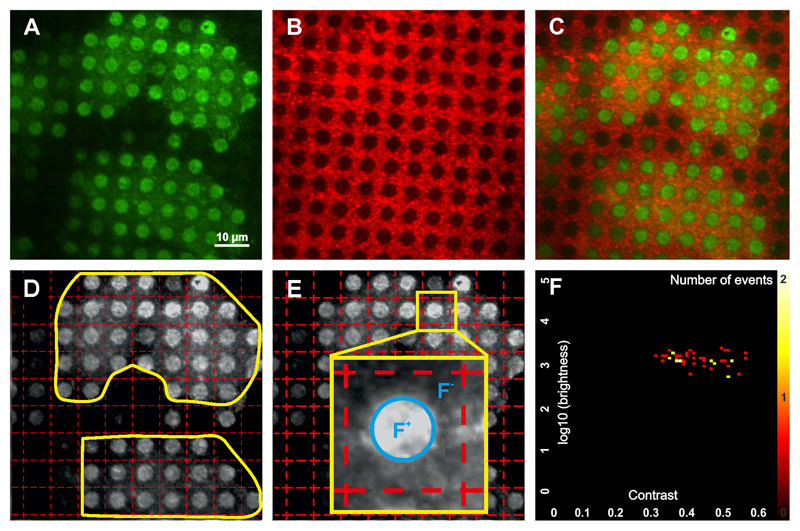
Export microscopy images as 8-bit TIF image. For contrast quantitation it is necessary to export images of the fluorescent prey/bait protein (Figure 3A) and the respective image with the BSA-Cy5 grid (Figure 3B). Figure 3C shows the overlaid images.
8-bit TIF images are imported in the semi-automated micropatterning analysis software (“Spotty”, see Note 15).
An automatic gridding algorithm is used to calculate the grid-size and the rotation angle ϕ of the used image. The algorithm automatically determines the grid parameters that correctly fit the micropatterned structure (see Note 16). Cells to be analyzed are detected automatically or can also be selected manually (Figure 3D).
Based on the correct identification of the grid position with respect to fluorescent patterns, the fluorescence contrast can be calculated for each pattern in the image as C = (F+ – F-)/(F+ – FBG), where F+ denotes the average intensity of the inner pixels of the micropatterns, F- the average intensity of the pixels surrounding the micropatterns, and FBG the intensity of the global background (see Note 17) (Figure 3E).
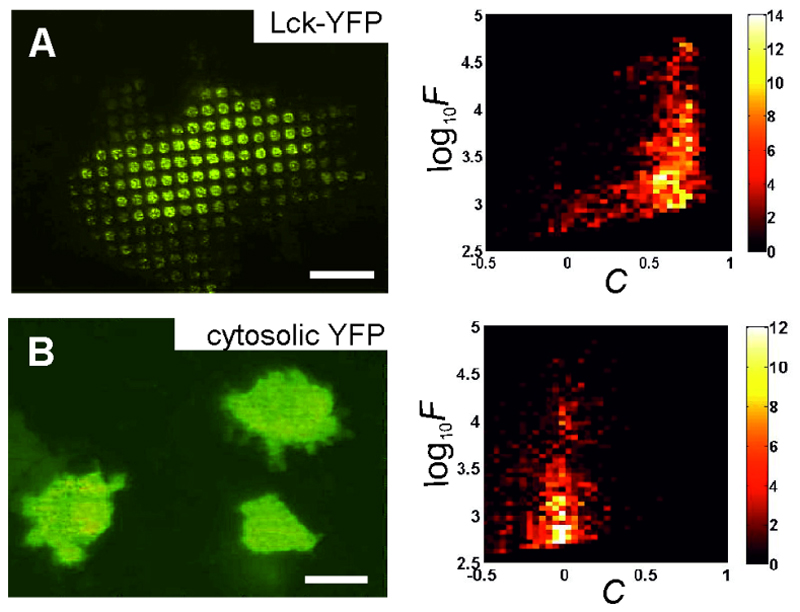
Several fluorescence parameters (e.g. mean brightness, background fluorescence, contrast,…) as well as graphical descriptions can be extracted from the software for further processing. For statistical analysis of multiple cells, we find it useful to present the data in two-dimensional histograms, with the fluorescence brightness F = F+ – FBG on the ordinate against the signal contrast C on the abscissa (Figure 3F) (see Note 18). To facilitate comparison of two-dimensional histograms, we use the mean contrast <C>. Figure 4 shows examples of 2D histograms in the presence and absence of protein-protein interaction, yielding high contrast and low contrast values in the 2D histograms, respectively.
Figure 3. Quantitation of protein interactions using “Spotty”.
Image recorded of the fluorescently labeled prey protein (A) and the corresponding BSA-Cy5 grid (B). (C) Overlay. (D) An automatic gridding algorithm automatically optimizes the grid parameters and produces a grid that correctly fits the micropatterns. Yellow lines denote the cell areas to be used for analysis. (E) The grid subdivides the total image into adjacent squares, each of which is quantified according to the average signal within a central circle comprising the micropattern spot (F+) and the signal outside this circle (F-). (F) Statistical analysis of multiple cells is shown in a 2D histogram of the fluorescence brightness and contrast. The color scale corresponds to the number of events (i.e. individual analyzed spots).
Figure 4. Examples of generated 2D histograms.
(A) T24 cell transiently expressing CD4 and Lck-YFP grown on CD4 antibody patterns. Lck-YFP interacts strongly with the patterned CD4, which is also reflected in the high contrast values shown in the 2D histogram on the right. The low contrast values at lower fluorescence intensities are probably a result of low CD4 (and Lck-YFP) expression levels of a cell subpopulation. For calculating the mean contrast <C>, we only consider data points above a certain intensity threshold (indicated by the yellow line). (B) T24 cell transiently expressing CD4 and cytosolic YFP grown on CD4 antibody patterns. No copatterning of YFP with CD4 can be observed, the contrast values fluctuate around zero. Scale bars are 10 μm. The color scale corresponds to the number of events (i.e. individual analyzed spots). Figure modified from (12).
4. Notes
PDMS is an often-used and reliable material for soft lithography, but it is rather soft. Stamp feature sizes need to be above 1 μm. We prefer stamps featuring regularly spaced dots (3 μm in size, with 3 μm interspaces).
BSA can also be labeled with a different fluorophore. Its fluorescence should be spectrally separated from the fluorescence of the prey protein.
Growth medium is exchanged for imaging buffer i) to reduce background fluorescence (if Phenol Red-containing medium is used) and ii) to keep cells at pH 7.4 during measurements.
For initial tests, it is convenient to use cells expressing a fluorescent bait protein. This way, successful immobilization of bait protein at the antibody patterns can be evaluated. Alternatively, this can also be verified by staining patterned bait protein with a fluorescently labeled antibody targeting a different epitope than the biotinylated capture antibody. It may be useful, however, to use antibody Fab-fragments, since full antibodies may be excluded from very densely populated patterns.
We use Accutase to detach cells because it is gentler than trypsin but equally efficient for most cell types. We found that e.g. loss of glycosylphosphatidylinositol-anchored proteins from the cell surface was significantly reduced when using Accutase instead of trypsin.
You can use the pipet tip to spread the streptavidin drop. Do not touch the stamp surface.
Water is needed for the streptavidin binding covalently to the epoxy-coated coverslips. In their protocol for protein printing onto Nexterion E coverslips, the manufacturer suggests a humidity of 75% during printing. We found that using a wet tissue in a Petri dish gives satisfactory results.
Be careful to lift the stamp without dragging it across the surface.
BSA-Cy5 serves two purposes: i) blocking areas of the coverslips not covered with streptavidin (interspaces) and ii) providing the grid necessary for quantitative analysis.
We have found that micropatterned surfaces with the stamps still attached can be stored at 4°C for at least two days without losing imprint quality.
Other adherent cell types may be suited for micropatterning as well. For some cell types it may be beneficial to replace BSA-Cy5 (completely or partially) with fibronectin or polylysine to promote cell adhesion in the interspaces between streptavidin regions.
Best results will be obtained when cells are plated to ~30-50% confluency. We use growth medium without Phenol Red to reduce background fluorescence.
TIRF microscopy is used to ensure that only membrane-bound prey protein is detected. Otherwise, detection of cytosolic prey protein can lead to an apparently reduced contrast.
When using this assay for the first time, we recommend using a fluorescently labeled bait protein as described in Note 4. If the fluorescence signals of bait, prey and analysis grid are sufficiently spectrally separated, labeled bait protein can be used for all measurements.
“Spotty” can be obtained from www.protein-interaction-lab.at upon request.
Evolutionary computation strategies are used for optimized grid identification and detection of micropatterns in biological samples.
A relevant factor for the success of contrast evaluation is the size of the F+ region. It has to be adjusted to fit the actual size of the printed patterns (as shown in Figure 3E).
Taking into account the fluorescence brightness is especially useful when dealing with a heterogeneous cell population with very different expression levels of bait and prey protein (see also Figure 4). It may be advantageous to analyze cell subpopulations of different expression levels separately, or to apply an intensity threshold as shown in Figure 4.
Acknowledgements
This work was funded by the Austrian Science Fund (FWF projects P 26337 and P 25730), the Austrian Research Promotion Agency (FFG project 842379), the program ‘Regionale Wettbewerbsfähigkeit OÖ 2007–2013’ with the financial support of the European Fund for Regional Development, as well as the Federal State of Upper Austria.
References
- 1.Barrios-Rodiles M, Brown KR, Ozdamar B, Bose R, Liu Z, Donovan RS, Shinjo F, Liu Y, Dembowy J, Taylor IW, Luga V, et al. High-throughput mapping of a dynamic signaling network in mammalian cells. Science. 2005;307:1621–1625. doi: 10.1126/science.1105776. [DOI] [PubMed] [Google Scholar]
- 2.Rigaut G, Shevchenko A, Rutz B, Wilm M, Mann M, Seraphin B. A generic protein purification method for protein complex characterization and proteome exploration. Nat Biotechnol. 1999;17:1030–1032. doi: 10.1038/13732. [DOI] [PubMed] [Google Scholar]
- 3.Kerppola TK. Design and implementation of bimolecular fluorescence complementation (BiFC) assays for the visualization of protein interactions in living cells. Nat Protoc. 2006;1:1278–1286. doi: 10.1038/nprot.2006.201. [DOI] [PMC free article] [PubMed] [Google Scholar]
- 4.Young KH. Yeast two-hybrid: so many interactions, (in) so little time. Biol Reprod. 1998;58:302–311. doi: 10.1095/biolreprod58.2.302. [DOI] [PubMed] [Google Scholar]
- 5.Maurel D, Comps-Agrar L, Brock C, Rives ML, Bourrier E, Ayoub MA, Bazin H, Tinel N, Durroux T, Prezeau L, Trinquet E, et al. Cell-surface protein-protein interaction analysis with time-resolved FRET and snap-tag technologies: application to GPCR oligomerization. Nat Methods. 2008;5:561–567. doi: 10.1038/nmeth.1213. [DOI] [PMC free article] [PubMed] [Google Scholar]
- 6.Suzuki KG, Fujiwara TK, Sanematsu F, Iino R, Edidin M, Kusumi A. GPI-anchored receptor clusters transiently recruit Lyn and Ga for temporary cluster immobilization and Lyn activation: single-molecule tracking study 1. J Cell Biol. 2007;177:717–730. doi: 10.1083/jcb.200609174. [DOI] [PMC free article] [PubMed] [Google Scholar]
- 7.Orth RN, Wu M, Holowka D, Craighead HG, Baird B. Mast cell activation on patterned lipid bilayers of subcellular dimensions. Langmuir. 2003;19:1599–1605. [Google Scholar]
- 8.Mossman KD, Campi G, Groves JT, Dustin ML. Altered TCR signaling from geometrically repatterned immunological synapses. Science. 2005;310:1191–1193. doi: 10.1126/science.1119238. [DOI] [PubMed] [Google Scholar]
- 9.Waichman S, You C, Beutel O, Bhagawati M, Piehler J. Maleimide Photolithography for Single-Molecule Protein-Protein Interaction Analysis in Micropatterns. Anal Chem. 2011 doi: 10.1021/ac1021453. [DOI] [PubMed] [Google Scholar]
- 10.Gandor S, Reisewitz S, Venkatachalapathy M, Arrabito G, Reibner M, Schröder H, Ruf K, Niemeyer C, Bastiaens P, Dehmelt L. A protein-interaction array inside a living cell. Angewandte Chemie (International ed. in English) 2013;52:4790–4794. doi: 10.1002/anie.201209127. [DOI] [PMC free article] [PubMed] [Google Scholar]
- 11.Kane RS, Takayama S, Ostuni E, Ingber DE, Whitesides GM. Patterning proteins and cells using soft lithography. Biomaterials. 1999;20:2363–2376. doi: 10.1016/s0142-9612(99)00165-9. [DOI] [PubMed] [Google Scholar]
- 12.Schwarzenbacher M, Kaltenbrunner M, Brameshuber M, Hesch C, Paster W, Weghuber J, Heise B, Sonnleitner A, Stockinger H, Schütz GJ. Micropatterning for quantitative analysis of protein-protein interactions in living cells. Nat Methods. 2008;5:1053–1060. doi: 10.1038/nmeth.1268. [DOI] [PubMed] [Google Scholar]
- 13.Weghuber J, Sunzenauer S, Plochberger B, Brameshuber M, Haselgrubler T, Schutz GJ. Temporal resolution of protein-protein interactions in the live-cell plasma membrane. Anal Bioanal Chem. 2010;397:3339–3347. doi: 10.1007/s00216-010-3854-x. [DOI] [PMC free article] [PubMed] [Google Scholar]
- 14.Alexander RA, Prager GW, Mihaly-Bison J, Uhrin P, Sunzenauer S, Binder BR, Schutz GJ, Freissmuth M, Breuss JM. VEGF-induced endothelial cell migration requires urokinase receptor (uPAR)-dependent integrin redistribution. Cardiovasc Res. 2012;94:125–135. doi: 10.1093/cvr/cvs017. [DOI] [PMC free article] [PubMed] [Google Scholar]
- 15.Lanzerstorfer P, Borgmann D, Schutz G, Winkler SM, Hoglinger O, Weghuber J. Quantification and kinetic analysis of Grb2-EGFR interaction on micro-patterned surfaces for the characterization of EGFR-modulating substances. PLoS One. 2014;9:e92151. doi: 10.1371/journal.pone.0092151. [DOI] [PMC free article] [PubMed] [Google Scholar]
- 16.Lanzerstorfer P, Yoneyama Y, Hakuno F, Muller U, Hoglinger O, Takahashi S, Weghuber J. Analysis of insulin receptor substrate signaling dynamics on microstructured surfaces. FEBS J. 2015;282:987–1005. doi: 10.1111/febs.13213. [DOI] [PubMed] [Google Scholar]
- 17.Bashour KT, Gondarenko A, Chen H, Shen K, Liu X, Huse M, Hone JC, Kam LC. CD28 and CD3 have complementary roles in T-cell traction forces. Proc Natl Acad Sci U S A. 2014;111:2241–2246. doi: 10.1073/pnas.1315606111. [DOI] [PMC free article] [PubMed] [Google Scholar]
- 18.Sunzenauer S, Zojer V, Brameshuber M, Trols A, Weghuber J, Stockinger H, Schutz GJ. Determination of binding curves via protein micropatterning in vitro and in living cells. Cytometry A. 2013;83:847–854. doi: 10.1002/cyto.a.22225. [DOI] [PubMed] [Google Scholar]
- 19.Sunzenauer S, Zojer V, Brameshuber M, Trols A, Weghuber J, Stockinger H, Schutz GJ. Determination of binding curves via protein micropatterning in vitro and in living cells. Cytometry A. 2012 doi: 10.1002/cyto.a.22225. [DOI] [PubMed] [Google Scholar]
- 20.Sevcsik E, Brameshuber M, Folser M, Weghuber J, Honigmann A, Schutz GJ. GPI-anchored proteins do not reside in ordered domains in the live cell plasma membrane. Nat Commun. 2015;6 doi: 10.1038/ncomms7969. 6969. [DOI] [PMC free article] [PubMed] [Google Scholar]
- 21.Weghuber J, Brameshuber M, Sunzenauer S, Lehner M, Paar C, Haselgrubler T, Schwarzenbacher M, Kaltenbrunner M, Hesch C, Paster W, Heise B, et al. Detection of protein-protein interactions in the live cell plasma membrane by quantifying prey redistribution upon bait micropatterning. Methods Enzymol. 2010;472:133–151. doi: 10.1016/S0076-6879(10)72012-7. [DOI] [PubMed] [Google Scholar]
- 22.Weghuber J, Sunzenauer S, Brameshuber M, Plochberger B, Hesch C, Schutz GJ. in-vivo detection of protein-protein interactions on micro-patterned surfaces. J Vis Exp. 2010;37 doi: 10.3791/1969. [DOI] [PMC free article] [PubMed] [Google Scholar]


