

Summary
Mitochondrial glutathione (GSH) and thioredoxin (Trx) systems function independently of the rest of the cell. While maintenance of mitochondrial thiol redox state is thought vital for cell survival, this was not testable due to the difficulty of manipulating the organelle's thiol systems independently of those in other cell compartments. To overcome this constraint we modified the glutathione S-transferase substrate and Trx reductase (TrxR) inhibitor, 1-chloro-2,4-dinitrobenzene (CDNB) by conjugation to the mitochondria-targeting triphenylphosphonium cation. The result, MitoCDNB, is taken up by mitochondria where it selectively depletes the mitochondrial GSH pool, catalyzed by glutathione S-transferases, and directly inhibits mitochondrial TrxR2 and peroxiredoxin 3, a peroxidase. Importantly, MitoCDNB inactivates mitochondrial thiol redox homeostasis in isolated cells and in vivo, without affecting that of the cytosol. Consequently, MitoCDNB enables assessment of the biomedical importance of mitochondrial thiol homeostasis in reactive oxygen species production, organelle dynamics, redox signaling, and cell death in cells and in vivo.
Keywords: mitochondria, thiol redox state, glutathione, thioredoxin, mitochondria targeting, redox signaling
Graphical Abstract
Highlights
-
•
MitoCDNB is a mitochondria-targeted molecule that disrupts thiol redox state
-
•
The CDNB moiety depletes glutathione and inhibits key thiol redox enzymes
-
•
MitoCDNB selectively disrupts mitochondrial thiol redox state in cells and in vivo
-
•
MitoCDNB extends methods available to investigate mitochondrial thiol redox state
It has been difficult to selectively disrupt mitochondrial redox state, independently of that in the rest of the cell. Here, Booty et al. introduce MitoCDNB to deplete mitochondrial glutathione and selectively inhibit key enzymatic components of mitochondrial thiol redox status in cells and in vivo.
Introduction
Thiol redox status within mitochondria is determined by the organelle's glutathione (GSH) and thioredoxin (Trx) systems, which are critical for cell viability and function (Fernandez-Checa et al., 1998, Go and Jones, 2013, Murphy, 2012) (Figure S1A). Mitochondrial GSH protects against reactive oxygen species (ROS), electrophiles, xenobiotics, and protein thiol oxidation (Murphy, 2012) (Figure S1A). GSH is made in the cytosol and then transported into mitochondria (Booty et al., 2015, Griffith and Meister, 1985, Lu, 2013, Romero and Sies, 1984, Wahlländer et al., 1979). The mitochondrial GSH pool is maintained reduced by glutathione reductase, which couples glutathione disulfide (GSSG) reduction to the matrix NADP+/NADPH pool (Eh ∼ −415 mV) (Murphy, 2012). GSH is then used by glutathione peroxidases (GPXs) 1 and 4, glutathione S-transferases (GSTs), glutaredoxin-2, and ATP binding cassette transporters to maintain mitochondrial function (Hayes et al., 2005, Lillig et al., 2008, Murphy, 2012, Ribas et al., 2014). Importantly, the mitochondrial GSH pool composition and activity are independent of the cytosol (Figure S1A) (Booty et al., 2015, Griffith and Meister, 1985, Martensson et al., 1990). The mitochondrial Trx system comprises Trx2, which is maintained reduced by coupling to NADP+/NADPH through the reductase TrxR2 (Arner and Holmgren, 2000, Lillig and Holmgren, 2007) (Figure S1A). Trx2 reduces protein disulfides and maintains activity of the peroxidase, peroxiredoxin 3 (Prx3) (Cox et al., 2010), and of the mitochondrial methionine sulfoxide reductases A and B2 (Kim and Gladyshev, 2007). Together, mitochondrial GSH and Trx systems maintain mitochondrial thiol homoeostasis and their disruption contributes to a range of pathologies (Go and Jones, 2013, Murphy, 2012) (Figure S1A).
To explore how mitochondrial thiol redox homeostasis affects health and disease, it is important to manipulate it acutely independently of thiol redox state elsewhere in the cell. Ablation of the genes underlying mitochondrial thiol status is challenging because: GSH is imported into mitochondria after synthesis in the cytosol and the transporter is not known (Booty et al., 2015); GPXs are found in multiple locations in the cell (Kelner and Montoya, 2000); and knock out of GPx4 or Trx reductase 2 (TrxR2) is embryonic lethal (Conrad, 2009). Consequently, we sought chemical biology approaches to simultaneously and selectively disrupt mitochondrial GSH and Trx systems independently of the rest of the cell.
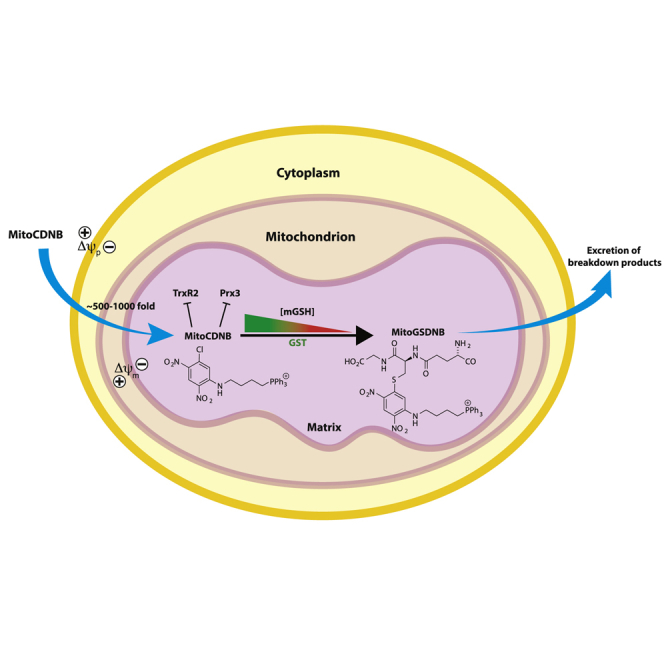
1-Chloro-2,4-dinitrobenzene (CDNB) is a GST substrate that depletes GSH by forming 1-S-glutathionyl-2,4-dinitrobenzene (GSDNB) (Habig et al., 1974a, Han et al., 2003, Hayes et al., 2005) (Figure S1B). CDNB also inhibits mammalian TrxRs by alkylating the active site selenol (Arnér et al., 1995, Nordberg et al., 1998, Urig and Becker, 2006) (Figure S1B), thereby converting TrxRs to a peroxide-generating NADPH oxidase (Zhong et al., 1998). However, CDNB acts indiscriminately throughout the cell; therefore, we modified CDNB to target it selectively to mitochondria so that it would only affect the organelle. To do this, we conjugated CDNB to the triphenylphosphonium (TPP) cation to make mitochondria-targeting CDNB (MitoCDNB) (Figure 1A). The TPP cation rapidly targets molecules to mitochondria in cells and in vivo, leading to the several-hundred-fold accumulation of the compound within the mitochondrial matrix in response to the mitochondrial and plasma membrane potentials (Ross et al., 2005, Smith et al., 2011, Smith et al., 2012). The selective localization of TPP within mitochondria means that these compounds only act within the organelle, leaving the rest of the cell unaffected. Hence, MitoCDNB should only disrupt mitochondrial thiol homeostasis by depleting GSH and inhibiting TrxR2, without affecting thiols elsewhere in the cell (Figure 1B). Here we show that MitoCDNB selectively disrupts mitochondrial GSH and Trx systems in isolated cells and in vivo, enabling the many roles of the mitochondrial thiol homeostasis in health and disease to be explored.
Figure 1.

Mode of Action of MitoCDNB
(A) MitoCDNB reaction with GSH catalyzed by GST to form MitoGSDNB and deplete GSH. Inhibition of TrxR2 by MitoCDNB by alkylation of its active site selenol.
(B) The mitochondria-targeting TPP of MitoCDNB leads to its selective accumulation within the mitochondrial matrix in vivo, driven by the plasma (Δψp) and mitochondrial (Δψm) membrane potentials. Within mitochondria the CDNB moiety is as a GST substrate to deplete GSH, and also a TrxR2 inhibitor. Thus MitoCDNB selectively disrupts mitochondrial thiol homeostasis through its effects on the GSH and Trx systems.
See also Figure S1.
Results
Synthesis and Reactivity of MitoCDNB
MitoCDNB (Figures 1A and 1B) is based on GST-activated prodrugs (Findlay et al., 2004, Morales and Laborde, 2007) and is a derivative of 2,4-dinitrobenzene with a chlorine atom at C-1, which is displaced by GSH, as well as an alkylamino group at C-3, which does not disrupt GST activity and is retained after the conjugation reaction (Findlay et al., 2004). MitoCDNB was synthesized by the reaction of 1,5-dichloro-2,4-dinitrobenzene with (4-aminobutyl)triphenylphosphonium bromide, followed by ion exchange to generate the mesylate salt (STAR Methods). MitoGSDNB was synthesized by incubation of MitoCDNB with GSH (STAR Methods). UV-vis spectra showed that conjugation of GSH with MitoCDNB to form MitoGSDNB dramatically increased absorbance at 328 nm (Figure S2A), similar to when GSH reacts with CDNB (Figure S2B) (Habig et al., 1974b). Addition of GST-κ, the predominant GST isoform within mammalian mitochondria (Goto et al., 2009, Hayes et al., 2005, Jowsey et al., 2003, Murphy, 2012, Raza, 2011), or an isolated mitochondrial matrix extract, initiated a rapid reaction between GSH and MitoCDNB (Figures 2A and S2C). Reverse-phase high-performance liquid chromatography (RP-HPLC) (Figures 2B and S2D) and mass spectrometry (MS) (Figure 2C) confirmed that GST-κ catalyzed the reaction of MitoCDNB (m/z = 534) with GSH to form MitoGSDNB (m/z = 805). Matrix fractions from heart, liver, and kidney mitochondria all contained GST activity that catalyzed the formation of MitoGSDNB from MitoCDNB, with by far the highest activity in the liver, ∼10-fold higher than in the kidney (Baars et al., 1981) (Figure S2E). Furthermore, the product of this reaction, MitoGSDNB, only affected GST activity at concentrations of around 100 μM (Figure S2F).
Figure 2.

Reactivity of MitoCDNB In Vitro
(A and B) GST-catalyzed reaction of MitoCDNB with GSH. (A) MitoCDNB (10 μM) was incubated ± GSH (1 mM) with GST-κ (10 μg) or mitochondrial matrix extract (100 μg protein), and absorbance at 328 nm measured. (B) MitoCDNB (10 μM) was incubated with GSH (1 mM) for 10 min alone (top), or with GST-κ (100 μg, bottom) and then analyzed by RP-HPLC at 220 nm (TPP, blue) and 328 nm (MitoGSDNB, red). Peak identities were confirmed by spiking with authentic compounds (Figure S2D).
(C) Mass spectrometric analysis of MitoCDNB reaction with GSH. MitoCDNB was incubated with GSH (top) or with GSH + GST-κ (bottom) as in (B) above then analyzed by mass spectrometry.
(D) Mammalian TrxR1 and TrxR2 inhibition by MitoCDNB. TrxR1 (25 μg) was incubated with MitoCDNB for 10 min and then assessed for TrxR1 activity. Inset: MitoCDNB inhibition of TrxR2 in matrix extracts (25 μg protein) from rat liver (L), heart (H), or kidney (K) mitochondria, incubated with 5 μM MitoCDNB (red) or vehicle (gray) for 5 min and then assessed for TxR2 activity (units = nmol NADPH min−1 mg protein−1).
(E) Alkylation of TrxR1 by MitoCDNB. TrxR1 (20 μg) was incubated for 10 min with 20 μM MitoCDNB (MitoCDNB), 20 μM CDNB for 5 min followed by 20 μM MitoCDNB for 10 min (CDNB + MitoCDNB) or EtOH control (0.1%). Protein was then assessed by western blotting for TrxR1 (top) and reprobed with anti-TPP antiserum (bottom).
(F) MitoCDNB uptake by mitochondria. An electrode sensitive to the TPP moiety of MitoCDNB was calibrated (5 × 1 μM MitoCDNB, red arrows). Liver mitochondria (2 mg protein/mL) were then added, followed by succinate (10 mM) and 1 μM FCCP. A representative trace is shown of three replicates.
(G) Time dependence of MitoCDNB release from mitochondria upon uncoupling. Mitochondria were incubated with 10 μM MitoCDNB as in (F) and at the indicated times 1 μM FCCP or 5 μg/mL alamethicin was added.
(H) RP-HPLC of mitochondrial MitoCDNB uptake. Liver mitochondria were incubated with 10 μM MitoCDNB as in (F): (i) with MitoCDNB for 9 min; (ii) with FCCP for 4 min followed by MitoCDNB for 5 min; (iii) with MitoCDNB and succinate for 5 min followed by FCCP for 4 min; (iv) with MitoCDNB and succinate for 5 min followed by alamethicin for 4 min. Mitochondria and supernatants (Figure S3C) were then analyzed by RP-HPLC.
(I) Time dependence of uptake and transformation of MitoCDNB. Mitochondria were incubated with MitoCDNB as in (H) and then mitochondrial (top) and supernatant (bottom) fractions analyzed by RP-HPLC for MitoCDNB (red) or MitoGSDNB (blue). Peak areas are in a.u and the normalized sum of the peak areas is in black.
Data are means ± SEM, N = 3. Traces are representative of >3 independent experiments. *p < 0.05, **p < 0.01, ***p < 0.001. See also Figures S2 and S3.
MitoCDNB inhibited recombinant mammalian cytosolic TrxR1 (Figure 2D) and mitochondrial TrxR2 (Figure 2D, inset). Western blotting for the TPP moiety showed that MitoCDNB alkylated TrxR1 (Figure 2E), consistent with MitoCDNB alkylating the active site selenol (Figure 1A). MitoCDNB also alkylated Trx1 (Figure S2G) and Prx1 (Figure S2H), consistent with inhibition of these proteins by alkylation of their reactive thiols. Thus MitoCDNB can both deplete GSH and inhibit TrxR2.
Mitochondria Accumulate MitoCDNB and Convert It to MitoGSDNB
MitoCDNB is designed to accumulate within energized mitochondria (Figure 1B). To assess this, we used a TPP-selective electrode to measure the MitoCDNB uptake (Figure 2F). Addition of de-energized mitochondria led to adsorption of the compound to membranes, while subsequent generation of a membrane potential by addition of succinate caused MitoCDNB uptake that was partially reversed by dissipation of the membrane potential with the uncoupler carbonyl cyanide 4-(trifluoromethoxy)phenylhydrazone (FCCP) (Figure 2F). However, only some of the accumulated MitoCDNB was released upon uncoupling (Figure 2F), and lengthening the incubation time between succinate and FCCP additions decreased MitoCDNB release (Figure 2G). This is consistent with the membrane-potential-dependent accumulation of MitoCDNB followed by its reaction with GSH to form the membrane-impermeant MitoGSDNB. Supporting this, addition of alamethicin to form pores in the mitochondrial inner membrane, led to complete release of both MitoCDNB and MitoGSDNB (Figure 2G). To confirm that MitoCDNB was converted to MitoGSDNB within mitochondria we pelleted and extracted the mitochondria followed by RP-HPLC (Figures 2H and S3A). This showed: mitochondria incubated with MitoCDNB contain MitoCDNB and MitoGSDNB (i); prior addition of FCCP decreased both the uptake of MitoCDNB and its transformation to MitoGSDNB (ii); addition of FCCP after incubation with MitoCDNB decreased levels of MitoCDNB, but not of MitoGSDNB (iii); finally, alamethicin released both MitoCDNB and MitoGSDNB from mitochondria (iv). Analysis by MS of mitochondrial pellets found MitoCDNB (m/z = 534) and MitoGSDNB (m/z = 805) (Figure S3B, upper trace), and only those two m/z values were detected in a precursor ion scan using a product m/z of 183, diagnostic of TPP fragmentation (Figure S3B, lower trace). Finally, quantification of MitoCDNB and MitoGSDNB in the mitochondrial pellet and supernatant over time by RP-HPLC confirmed that MitoCDNB was taken up rapidly by mitochondria and there converted to MitoGSDNB (Figures 2I and S3C).
MitoCDNB Depletes Mitochondrial GSH and Inhibits TrxR2
MitoCDNB depleted mitochondrial GSH in a dose-dependent manner, with more than 90% depleted by 10 μM MitoCDNB, while neither TPP molecule methyltriphenylphosphonium (TPMP) nor MitoGSDNB affected GSH (Figure 3A). The rate of mitochondrial GSH depletion by MitoCDNB was rapid and attenuated by slowing its uptake by uncoupling with FCCP (Figure 3B), while mitochondrial GSH depletion by CDNB was slower and unaffected by FCCP (Figure 3B). MitoCDNB inhibited mitochondrial TrxR2 activity and preventing MitoCDNB uptake with FCCP diminished this inhibition (Figure 3C). CDNB also affected TrxR2 activity, but again this inhibition was unchanged by FCCP (Figure 3C). Western blotting of mitochondria after incubation with MitoCDNB showed that it bound to mitochondrial thiol proteins and that this was prevented by the thiol reagent N-ethyl maleimide, or with FCCP (Figure S3D). This thiol protein-binding was similar to that of another TPP compound conjugated to a thiol-reactive group that does not deplete protein thiols nor disrupt mitochondrial function, iodobutyltriphenylphosphonium (Lin et al., 2002, Ross et al., 2008) (Figure S3E). MitoCDNB also has little impact on mitochondrial respiration or membrane potential (Figures S3F and S3G), hence its effects on mitochondrial function will be secondary to disrupting the GSH and Trx systems. We conclude that MitoCDNB is taken up by energized mitochondria and there both inhibits TrxR2 and is also converted to MitoGSDNB by matrix GSTs.
Figure 3.

Impact of MitoCDNB on Mitochondrial GSH and TrxR
(A) MitoCDNB depletes mitochondrial GSH. Liver mitochondria (2 mg protein/mL) were incubated with vehicle, MitoCDNB, CDNB, TPMP, or MitoGSDNB for 5 min, then matrix glutathione levels were determined.
(B) Time course of GSH depletion. MitoCDNB (10 μM) or CDNB (10 μM) were incubated with mitochondria, then matrix glutathione levels determined. For some experiments FCCP (1 μM) was added prior to MitoCDNB or CDNB (dotted lines).
(C) Inhibition of TrxR2 by MitoCDNB. Liver mitochondria (2 mg/mL) were incubated for 5 min with either carrier (white), MitoCDNB (10 μM, red), or CDNB (10 μM, blue). For some experiments FCCP (1 μM) was added before MitoCDNB (red, white) or CDNB (blue, white) for a further 5 min.
(D and E) Uptake and metabolism of MitoCDNB by cells. HepG2 cells were incubated with MitoCDNB (10 μM) and then the MitoCDNB and MitoGSDNB in the cells (D) and medium (E) were quantified by LC-MS/MS. The sum of MitoCDNB and MitoGSDNB is indicated.
(F) Schematic of MitoCDNB metabolism. MitoCDNB reacts with GSH to form MitoGSDNB in mitochondria. This is excreted and broken down by the extracellular γ-glutamyl transpeptidase (GGT) to MitoCysGlyDNB, further converted to S-MitoCysDNB, which undergoes a spontaneous Smiles rearrangement to N-MitoCysDNB, which autooxidizes to N-MitoCysDNB disulfide.
(G) Generation of MitoCysDNB in HepG2 cells. MitoCysDNB levels were quantified in cells from (D) above and from media (E). Data are means ± SEM, N = 3.
*p < 0.05, **p < 0.01, ***p < 0.001 relative to control; ##p < 0.01 relative to incubation without FCCP in (C) only. See also Figures S3 and S4.
Uptake and Transformation of MitoCDNB by Cells in Culture
To facilitate assessment of MitoCDNB distribution and metabolism to MitoGSDNB we set up a liquid chromatography-tandem MS (LC-MS/MS) assay (STAR Methods). MitoCDNB and MitoGSDNB both fragmented to a product ion of m/z of 183, diagnostic of TPP cations (Cocheme et al., 2011, Logan et al., 2014), enabling selective and sensitive quantification of MitoCDNB and MitoGSDNB in cells and in vivo. MitoCDNB had minimal effects on cell growth and survival at concentrations below about 30 μM (Figures S4A and S4B) and both MitoCDNB and MitoGSDNB were stable in culture media (Figure S4C). We then measured the uptake of MitoCDNB into HepG2 cells and its conversion to MitoGSDNB over time (Figure 3D). Surprisingly, only very small amounts of MitoCDNB, and no MitoGSDNB, was found in HepG2 cells (Figure 3D). However, there was a substantial decrease in MitoCDNB and an increase of MitoGSDNB in the incubation medium (Figure 3E). A similar pattern was found in C2C12 cells (Figures S4D and S4E). These data suggest that MitoCDNB enters cells, is rapidly converted to MitoGSDNB and is then exported to the culture medium.
Intriguingly, for HepG2, but not C2C12 cells (Figures S4D and S4E), the amount of MitoCDNB and MitoGSDNB that accumulated in the medium was ∼150 pmol/mL less than the amount of MitoCDNB added (Figure 3E). To see if other MitoCDNB derivatives were formed we carried out a product scan on HepG2 cell culture medium to identify precursor ions that generated a product ion of m/z of 183, diagnostic of a TPP cation. In addition to the expected precursor ions of MitoCDNB (m/z = 534) and MitoGSDNB (m/z = 805), another precursor ion was observed with m/z of 618. This pattern is consistent with initial breakdown of MitoGSDNB by a γ-glutamyl transpeptidase (GGT) to remove the glutamyl unit giving MitoCysGlyDNB (m/z = 676), followed by release of a glycine unit by a dipeptidase to yield S-MitoCysDNB (m/z = 619). The free N terminus of the cysteine can then undergo an S to N migration by a Smiles rearrangement (Kondo et al., 1881), resulting in a free thiol product, N-MitoCysDNB of the same m/z, auto-oxidation of which gives the corresponding disulfide, N-MitoCysDNB disulfide (m/z = 618) (Figure 3F). Supporting this, chemical synthesis of S-MitoCysDNB was followed by a spontaneous Smiles rearrangement and auto-oxidation to give an N-MitoCysDNB disulfide (STAR Methods). N/C-MitoCysDNB are unlikely to form from the direct reaction of cysteine with MitoCDNB, as the uncatalyzed reaction of the cysteine thiol of GSH with MitoCDNB is negligible, and cysteine is not a GST substrate. As GGTs are highly expressed on the surface of liver cells this may also explain why this transformation was seen in the liver-derived HepG2 cells (Zhang et al., 2005), but not in the muscle-derived C2C12 cells. To assess this further, we established an LC-MS/MS assay for N-MitoCysDNB and used this to assess the accumulation of MitoCysDNB during incubation of MitoCDNB with HepG2 cells (Figure 3G). The amount of MitoCysDNB at the later stages of the time course was about 150 pmol/mL, accounting for the difference in recovery of the starting material in HepG2 incubations (Figure 3E). In contrast, very little MitoCysDNB accumulated upon incubating MitoCDNB with C2C12 cells (Figure S4F), presumably because the GGT present on the extracellular face of HepG2 cells (Zhang et al., 2005), is poorly expressed in C2C12 cells. This interpretation was supported by incubating cell-impermeant MitoGSDNB with HepG2 cells with generic GGT inhibitor, acivicin, which decreased breakdown of MitoGSDNB to MitoCysDNB (Figure S4G). In summary, MitoCDNB is taken up by cells and there rapidly converted to MitoGSDNB before excretion, when it is further converted into MitoCysDNB on the surface of liver cells.
MitoCDNB Depletes Mitochondrial GSH and Inhibits TrxR2 in Cells
We next assessed the effects of MitoCDNB in HepG2 cells on both total (Figure 4A) and mitochondrial GSH content (Figure 4B). CDNB had a greater effect on the total cellular GSH levels than MitoCDNB (Figure 4A). However, when we analyzed the effects of MitoCDNB and CDNB on mitochondrial GSH we found that MitoCDNB depleted more than 70% of mitochondrial GSH, while CDNB left the mitochondrial GSH unaffected (Figure 4B). Analyzing the effects of MitoCDNB over time showed that MitoCDNB rapidly depleted the mitochondrial GSH pool within an hour, while the total cellular GSH remained unaffected (Figure 4C). Furthermore, preventing MitoCDNB uptake into mitochondria with FCCP decreased the depletion of mitochondrial GSH (Figure 4D). Similar selective depletion of mitochondrial GSH by MitoCDNB was found in C2C12 cells (Figures S4H–S4J).
Figure 4.

Selective Mitochondrial GSH Depletion and TrxR2 Inactivation by MitoCDNB in Cells
(A) Depletion of cell GSH. HepG2 cells were incubated for 1 hr with MitoCDNB (10 μM), CDNB (10 μM), or vehicle and cell GSH levels measured.
(B) Mitochondrial GSH depletion in cells. HepG2 cells were incubated as in (A), mitochondria were then isolated and GSH measured.
(C) Time course of GSH depletion by MitoCDNB. HepG2 cells were incubated as in (A) and total and mitochondrial GSH measured.
(D) Effect of FCCP on mitochondrial GSH depletion. HepG2 cells were incubated for 1 hr with MitoCDNB (10 μM) alone, + FCCP (100 μM), or with vehicle, and mitochondrial GSH assessed. **p < 0.01 relative to control; ##p < 0.01 relative to FCCP.
(E) Inhibition of TrxR2 by MitoCDNB in cells. HepG2 cells were incubated with vehicle or MitoCDNB (10 μM) for 4 hr. Total cell and mitochondrial extracts were assessed for TrxR activity.
(F) Effect of MitoCDNB on cell TrxR activity. Cells were incubated with 10 μM TPMP, CDNB, MitoCDNB, or carrier, for 1, 4, or 24 hr and total cell TrxR activity measured.
Data are means ± SEM, N = 4 (A–E) or 3 (F). *p < 0.5, **p < 0.01, ***p < 0.001 relative to control, or time = 0 (C); #p < 0.05, ##p < 0.01 relative to CDNB (B), FCCP (D) or cell + MitoCDNB (E). See also Figures S4 and S5.
Incubation of HepG2 cells with MitoCDNB decreased TrxR activity by more than 60% in mitochondrial extracts, but had less effect on the total cell TrxR activity (Figure 4E). To extend this we compared the effect of MitoCDNB and CDNB on total cell TrxR activity in C2C12 cells over time (Figure 4F). This also showed that MitoCDNB had limited effect on whole-cell TrxR activity compared with CDNB (Figure 4F). Thus, in cells MitoCDNB selectively depletes the mitochondrial GSH pool and TrxR2 activity while leaving the cytosolic GSH pool and TrxR1 activity unaffected.
As MitoCDNB inhibits TrxR2 activity it would be expected to slow the reduction of the disulfide dimer form of the mitochondrial peroxidase peroxiredoxin 3 (Prx3), which is formed as part of its enzymatic cycle upon degrading hydrogen peroxide (Cox et al., 2010). Surprisingly, there was no change in Prx3 dimerization in isolated mitochondria incubated with MitoCDNB. One possibility was that MitoCDNB may alkylate the reactive thiol of Prx3, as occurred for Prx1 (Figure S2G), thereby preventing Prx3 dimerization. To see if this was occurring, we incubated cells with MitoCDNB and then assessed how this affected Prx3 dimerization in the mitochondria and compared this to the dimerization of Prx2 in the cytosol (Figures S5A and S5B). In the absence of exogenous additions there were low and stable levels of Prx dimerization in the mitochondrial matrix (Prx3) and in the cytosol (Prx2); however, addition of the mitochondria-targeted ROS generator MitoPQ, which only induces oxidative stress in the mitochondria (Robb et al., 2015), led to selective Prx dimerization in the mitochondrial matrix (Figures S5A and S5B), indicating that this approach could report on local changes in oxidative stress within mitochondria. However, MitoCDNB did not increase Prx3 dimerization alone nor did it enhance the dimerization caused by MitoPQ (Figures S5A and S5B). To see if this could be due to alkylation of reactive cysteines on Prx3 by MitoCDNB, we treated cells with the thiol oxidant diamide to convert Prx3 to the dimeric form. Diamide enhanced dimerization, but after treatment with MitoCDNB the ability of the Prx3 to dimerize upon addition of diamide was greatly diminished (Figure S5C). Furthermore, western blotting of mitochondria treated with MitoCDNB showed that Prx3 colocalized with immunoreactivity against the TPP moiety of MitoCDNB (Figure S5D). Together these data indicate that MitoCDNB alkylates and inactivates Prx3 by reacting with its active site cysteine residue, thereby preventing it from degrading H2O2. Thus, MitoCDNB selectively disrupts mitochondrial thiol redox metabolism in cells while leaving that of the cytosol intact.
MitoCDNB Uptake, Metabolism, and Distribution In Vivo
As mitochondria-targeted compounds comprising a TPP cation are readily taken up by mitochondria in vivo (Smith et al., 2003), it should be possible to use MitoCDNB to selectively alter the thiol redox state of mitochondria in experimental animals in vivo. To assess this possibility we injected MitoCDNB (5 mg/kg) into C57BL/6J mice as a bolus intravenous injection and, after various times, the mice were culled and the liver, heart, kidney, and blood extracted and the amounts of MitoCDNB, MitoGSDNB, and MitoCysDNB were quantified by LC-MS/MS (Figures 5A, 5B, and S6A). This showed that after 5 min most of the MitoCDNB was cleared from the blood and taken up by the tissues, and there rapidly converted to MitoGSDNB with some detected in the blood. After 1 hr the MitoGSDNB dominated in tissues and the amount of MitoCysDNB was negligible (Figures 5A, 5B, and S6A). Over the next 3 hr MitoGSDNB was all gone, while MitoCDNB was about 60% depleted and was all gone after 24 hr, at which time there was still extensive depletion of mitochondrial glutathione in the liver and kidney (Figures 5A, 5B, S6A, and S6B). Analysis of spot urines 24 hr after MitoCDNB injection showed accumulation of both MitoCDNB and MitoCysDNB, but not of MitoGSDNB (Figure 5C). Isolation of mitochondrial fractions from the liver showed that the amount of MitoCDNB detected in the mitochondrial fraction was negligible, while ∼120–200 pmol MitoGSDNB/mg protein was detected up to 4 hr; however, it too was gone after 24 hr (Figure 5D). Unlike MitoGSDNB, MitoCDNB is membrane permeant and may be lost during mitochondrial isolation as the organelles will no longer have a membrane potential. Assessing the levels of these compounds in blood showed that MitoCDNB in the blood was negligible, while ∼20 μM MitoGSDNB accumulated over 4 hr, and the concentration of MitoCysDNB rose to more than ∼75 μM in the same period (Figure 5B). Thus, MitoCDNB is taken up by mitochondria and there rapidly converted to MitoGSDNB, which is then excreted from the cell and then converted to MitoCysDNB for delivery to the urine.
Figure 5.

Selective Depletion of Mitochondrial GSH and Inactivation of TrxR2 by MitoCDNB within Tissues In Vivo
Mice were injected with MitoCDNB (5 mg/kg) and tissues harvested for analysis of total and mitochondrial GSH content, and for TrxR activity.
(A) Liver levels of MitoCDNB and MitoGSDNB were quantified by LC-MS/MS.
(B) Blood samples were analyzed for MitoCDNB, MitoGSDNB, and MitoCysDNB by LC-MS/MS.
(C) Spot urines 24 hr after MitoCDNB injection were quantified for MitoCDNB, MitoGSDNB, and MitoCysDNB by LC-MS/MS.
(D) Liver mitochondrial levels of MitoCDNB and MitoGSDNB were quantified by LC-MS/MS.
(E) GSH depletion by MitoCDNB in vivo. Mitochondrial and whole tissue fractions from liver, heart, and kidney at various times after MitoCDNB injection. Data are a percentage of control mice culled at the same time. The levels of GSH in the whole tissue and mitochondria, respectively, were: liver = 30.56 ± 3.7, 3.71 ± 0.6; kidney = 1.71 ± 0.3, 2.14 ± 0.52; heart = 4.15 ± 0.54, 2.36 ± 0.1 (nmol GSH/mg protein).
(F and G) Expression of γ-glutamylcysteine ligase (γGCL) and glutathione synthetase (GS). Mice were injected with MitoCDNB and 24 hr later liver levels of γGCL and GS were analyzed by western blot (F). Each lane is a separate mouse, and quantified relative to GAPDH (G).
(H) Liver and mitochondrial fractions at indicated times after MitoCDNB injection were assessed for TrxR activity.
Data are means ± SEM, N = 4 or 5 (E). *p < 0.05, **p < 0.01, ***p < 0.001 relative to control, time zero (H), or time-matched controls (E). See also Figure S6.
MitoCDNB Selectively Depletes Mitochondrial GSH and Lowers TrxR Activity In Vivo
While MitoCDNB did enter mitochondria in vivo and formed MitoGSDNB, it was then rapidly excreted from the cell and body. Therefore it was unclear if the exposure to MitoCDNB in vivo was sufficient to affect mitochondrial GSH and TrxR2 activities. Thus we assessed how MitoCDNB injection affected GSH levels, both in the whole tissue and also in mitochondrial fractions from heart, kidney, and liver (Figure 5E). There was a specific depletion of the mitochondrial GSH pool in both liver and kidney, which started to return to control levels 7 days post injection. Interestingly, the heart showed a slower depletion of mitochondrial GSH, yet only recovered to 50% of control levels after 7 days, suggesting tissue-specific differences in repletion of the mitochondrial glutathione pool. This is consistent with the slow recovery of the total heart GSH pool after GSH depletion in mice (Lee et al., 1987, Gerard-Monnier et al., 1992). In contrast to mitochondrial GSH the total GSH levels in the tissues were not depleted, but actually increased by 20%–70% in all tissues 24 hr after MitoCDNB injection. In response to MitoCDNB the expression of glutamate-cysteine ligase (GCL), the rate-limiting enzyme for GSH synthesis, increased by 6- to 7-fold. There was also a ∼50% increase in glutathione synthetase expression (Figures 5F and 5G). This suggests that depletion of mitochondrial GSH upregulates GSH production in the cytosol, but despite this the mitochondrial pool is still depleted. Note that the levels of GSH were assessed against time of day-matched controls to allow for the known diurnal variation in cell and mitochondrial GSH levels (Blanco et al., 2007), and that injection of carrier solvent (EtOH) did not affect GSH levels (Figure S6B). The effect of MitoCDNB on TrxR activity in vivo was assessed by analyzing cellular and mitochondrial fractions from liver isolated from MitoCDNB-injected mice (Figure 5H). It was clear that MitoCDNB did not affect total cellular TrxR activity, but did inhibit that in mitochondria (Figure 5H), which took up to 7 days post MitoCDNB injection to show about 70% recovery. Together these data show that MitoCDNB selectively depletes mitochondrial GSH and inhibits mitochondrial TrxR in vivo. Intriguingly, cellular GSH and the enzymes used to synthesize it are upregulated in response to mitochondrial GSH depletion, suggesting a retrograde signaling pathway from mitochondria to the nucleus upon mitochondrial GSH depletion.
Applications of MitoCDNB In Vitro and In Vivo
We have shown that MitoCDNB alters mitochondrial GSH content and TrxR2 activity selectively in cells and in vivo, without affecting cytosolic thiol redox homeostasis. We next assessed the utility of MitoCDNB in experiments that require the selective disruption of mitochondrial thiol redox state that would not have been possible before the development of MitoCDNB.
MitoCDNB affects TrxR2, Prx3, and GSH, all of which are important in degrading H2O2 within mitochondria, and furthermore inhibition of TrxR can enhance peroxide production (Zhong et al., 1998). Therefore we assessed its impact on mitochondrial H2O2 release (Figure 6A). Heart mitochondria incubated with MitoCDNB alone did not enhance mitochondrial H2O2 efflux (Figure 6A). However, when H2O2 efflux was amplified using MitoPQ, which generates superoxide within mitochondria (Robb et al., 2015), H2O2 efflux was further enhanced by MitoCDNB (Figure 6A). When MitoCDNB was added to cells and mitochondrial ROS production assessed by MitoSOXRed using confocal microscopy (Figure 6B) or flow cytometry (Figure 6C) there was an increase in basal MitoSOXRed oxidation that was greatly enhanced by MitoPQ. Thus, selectively disrupting the mitochondrial thiol system with MitoCDNB enhances mitochondrial ROS efflux by selectively decreasing mitochondrial antioxidant defenses.
Figure 6.

Selective Disruption of Mitochondrial Thiol Redox State Enhances Mitochondrial ROS Production, Mitochondrial Fragmentation, and Retrograde Signaling
(A) MitoCDNB enhances mitochondrial H2O2 production. Heart mitochondria (70 μg protein) were incubated with MitoCDNB (10 μM) or vehicle for 10 min then MitoPQ (5 μM) or vehicle was added and H2O2 production measured for 5 min. Data are means ± SEM, N = 4. ***p < 0.001 relative to control; ###p < 0.001 relative to control + MitoPQ.
(B) MitoCDNB effect on mitochondrial ROS production in cells by confocal microscopy. Representative maximum projections of ROS production measured by MitoSOX fluorescence in C2C12 myoblasts at 0 or 30 min after 5 μM MitoPQ addition. Myoblasts were incubated with MitoSOX (5 μM) and either 0.1% ethanol (control) or MitoCDNB (10 μM) for 10 min prior to MitoPQ addition. Red is oxidized MitoSOX and blue is DAPI nuclear staining. Scale bar, 20 μm. The graph is fold change relative to control. Data are means ± SEM, N = 3. *p < 0.05, **p < 0.01.
(C) MitoCDNB effect on mitochondrial ROS production in cells assessed by flow cytometry. C2C12 cells were incubated with MitoSOX Red and treated with 0.1% ethanol (control), or 10 μM of MitoCDNB, TPMP or CDNB. Data are means ±SEM, N = 5. ***p < 0.001.
(D) Representative maximum projection images of C2C12 myoblasts (upper panels). Cells were incubated with 1, 5, and 10 μM MitoCDNB, TPMP, or FCCP for 4 hr, and analyzed by confocal microscopy to visualize mitochondrial fragmentation. The lower panels expand the indicated sections of the upper panels. Images are representative of 3 independent experiments. Scale bars, 20 μm.
(E) Quantification of mitochondrial morphology in C2C12 myoblasts assessed as in (D) after incubation with 1, 5, or 10 μM of MitoCDNB, TPMP, or FCCP. Mitochondrial morphology was assigned as tubular, intermediate or fragmented and presented as mean % of all cells ± SEM. Data are mean ± SEM from 3 independent experiments, 100 cells were counted for each condition. ***p < 0.001.
(F and G) Effect of MitoCDNB on the mouse transcriptome. Mice (six in each condition) were administered MitoCDNB (5 mg/kg) or carrier and then the liver transcriptomes were analyzed by RNA sequencing 1 and 4 hr later. (F) Volcano plot of the significance of the transcriptional changes caused by MitoCDNB 1 hr after injection compared with control. (G) Heatmap of changes in expression for the 20 most upregulated and most downregulated genes 1 hr after MitoCDNB injection.
See also Figure S6.
Mitochondria are highly dynamic organelles, constantly dividing, fusing and moving in response to cellular needs and also to modulate the cellular metabolic state (Pernas and Scorrano, 2016). Mitochondrial dynamics have recently been linked to the cellular thiol redox homeostasis (Willems et al., 2015), for example, with the accumulation of GSSG in the cytosol and intermembrane space leading to mitochondrial hyperfusion during cellular stress (Mattie et al., 2018, Shutt et al., 2012). However, the relative contributions of cytosolic and mitochondrial thiol redox states to organelle dynamics has been difficult to assess. Thus, MitoCDNB gives us the opportunity to specifically assess whether changes in mitochondrial thiol redox state alone affected mitochondrial plasticity in the absence of thiol changes in the cytosol. Live cell imaging of C2C12 cells transiently expressing the mitochondrial marker, MitoGFP, showed no mitochondrial fragmentation in control cells (Video S1), nor with cells incubated with the control TPMP (Video S2). However, addition of MitoCDNB for 30 min led to a rapid fragmentation of the mitochondrial network (Video S3). To confirm the effect of MitoCDNB on mitochondrial fragmentation observed by live cell imaging, mitochondrial morphology was then quantified by confocal microscopy on fixed cells. Mitochondrial morphology was classified as tubular, intermediate and fragmented, and analyzed from cells treated with various concentrations of MitoCDNB, the negative control TPMP and FCCP, known to induce mitochondrial fragmentation (Cereghetti et al., 2010) (Figures 6D and 6E). This analysis using MitoCDNB confirmed that the selective disruption of mitochondrial thiol homeostasis was sufficient to induce significant mitochondrial fragmentation (Figures 6D and 6E), and this occurred without a significant change in mitochondrial mass, analyzed by quantification of the of the mitochondrial outer membrane marker protein TOM20 by western blot (Figure S6C).
C2C12 cells were transfected with 1 μg MitoGFP plasmid and 48 hr later assessed. At the 3-s mark on the video vehicle control 0.1% EtOH was added and incubated for a further 15 min. Scale bar, 10 μm. The video is shown at 5 frames per second and each frame is 30 s apart in real time.
C2C12 cells were transfected with 1 μg MitoGFP plasmid and 48 hr later assessed. At the 3-s mark on the video vehicle 5 μM TPMP was added and incubated for a further 15 min. Scale bar, 10 μm. The video is shown at 5 frames per second and each frame is 30 s apart in real time.
C2C12 cells were transfected with 1 μg MitoGFP plasmid and 48 hr later assessed. At the 3-s mark on the video vehicle 5 μM MitoCDNB was added and incubated for a further 15 min. Scale bar, 10 μm. The video is shown at 5 frames per second and each frame is 30 s apart in real time.
MitoCDNB injection into a mouse led to an increase in the expression of GCL (Figures 5F and 5G). As MitoCDNB only affected the thiol redox status of the mitochondrial matrix, this finding suggests that alterations to mitochondrial thiol redox are communicated to the nucleus and there affect transcription. To assess this possibility in more detail we assessed the effect of MitoCDNB on transcription within mice in vivo (Figures 6F and 6G). Mouse livers were isolated 1 and 4 hr after MitoCDNB injection and transcription levels compared with sham injections using RNA sequencing. This analysis showed a dramatic change in transcription in the liver 1 hr after MitoCDNB injection (Figure 6F). Interestingly, 4 hr after the injection the transcriptome changes were far less than at 1 hr, as there were a total of 1,003 genes significantly differentially expressed at 1 hr but only 351 at 4 hr, as is illustrated by principal-component analysis (Figure S6D). The 20 genes that increased and the 20 that decreased expression the most compared with controls within 1 hr of MitoCDNB injection are shown as a heatmap (Figure 6G). This analysis further indicates that the changes in transcription induced by MitoCDNB injection were far greater at 1 hr after injection compared with 4 hr (Figure 6G). Together these findings show that there is a rapid transcriptional response to changes in mitochondrial thiol redox state. While beyond the scope of this paper, future work using MitoCDNB will enable us to analyze how changes in mitochondrial thiol redox state lead to changes in transcription. We conclude that MitoCDNB provides an important tool in investigating the retrograde signaling pathways that link mitochondria to transcriptional regulation in the nucleus.
Discussion
The redox state of the mitochondrial thiol systems is thought to be a key determinant of cell function and stress response. However, assessing this assumption has proven difficult due to the difficulty of altering mitochondrial thiol redox homoeostasis without affecting that of other cell compartments. Here we have shown that this constraint can be overcome in cells and in vivo by a chemical biology approach using MitoCDNB. A major attribute of MitoCDNB is its selective accumulation within mitochondria, hence it only acts on the mitochondrial thiol systems, leaving the rest of the cell unscathed. The other vital property of MitoCDNB is that it is both a GST substrate, enabling selective GSH depletion, also a TrxR2 inhibitor, by reacting with the enzyme's active site selenol. Furthermore, MitoCDNB moiety also blocks reactive thiols, such as those in Prx3, further inhibiting the ability of the mitochondrial thiol system to deal with oxidative stress. The introduction of MitoCDNB will enable the selective alteration of mitochondrial thiol redox state and facilitate understanding its role in many areas, including mitochondrial ROS production, redox signaling, and dynamics. These insights will enhance our ability to address many critical biomedical questions, including xenobiotic detoxification, ischemia-reperfusion injury and neurodegenerative diseases. More generally, MitoCDNB indicates how chemical biology approaches coupled with intracellular targeting can be used to gain insight into organelle function in cells and in vivo. To date this has only been applied to mitochondria, utilizing the membrane potential to drive the selective delivery. It should be possible to extend these chemical biology approaches to other organelles, utilizing other modes of targeting such as the low pH of cell compartments like lysosomes, the oxidized thiol redox state of the endoplasmic reticulum, or the presence of organelle-specific enzymes to activate pro-versions of the compounds.
Significance
Mitochondrial thiol redox status is a key way in which the cell protects itself against oxidative stress and is also central to mitochondrial redox signaling. However, in investigating these processes up to now it has been difficult to isolate the effects of mitochondrial thiol status from that elsewhere in the cell. To overcome this challenge, we have developed a mitochondria-targeted molecule, MitoCDNB, that is accumulated by mitochondria and there depletes the mitochondrial GSH pool and inactivates TrxR2 and Prx3. These interactions enable mitochondrial thiol redox status to be disrupted independently of that elsewhere in the cell. Here, we demonstrate that this approach can be used in cells and in vivo and, in proof-of-principle experiments, show the effects of the selective disruption of mitochondrial thiol redox status on mitochondrial ROS production and redox signaling. MitoCDNB should prove to be a useful tool for those investigating mitochondrial redox biology.
STAR★Methods
Key Resources Table
| REAGENT or RESOURCE | SOURCE | IDENTIFIER |
|---|---|---|
| Antibodies | ||
| Anti-peroxiredoxin 2 antibody | Abcam | Cat#ab109367; RRID: AB_10862524 |
| Anti-peroxiredoxin 3 antibody | Abcam | Cat#ab73349; RRID: AB_1860862 |
| Anti-glutathione synthetase antibody | Abcam | Cat#ab91591; RRID: AB_2049703 |
| Anti-TOMM20 antibody | Santa Cruz | Cat#sc-11415; RRID: AB_2207533 |
| Goat anti-rabbit IgG H&L (AlexaFluor 594) | ThermoFisher | Cat#A11037; RRID: AB_2534095 |
| Anti-triphenylphosphonium antibody | Lin et al. (2002) | |
| gamma-glutamylcysteine synthetase antibody | ThermoFisher | Cat#PA5-44189; RRID: AB_2608691 |
| IRDye 680LT Goat anti-Mouse IgG | LICOR | Cat#925-68020; RRID: AB_2687826 |
| IRDye 800CW Donkey anti-Rabbit IgG | LICOR | Cat#925-32213; RRID: AB_2715510 |
| PRX pathway Western Blot Cocktail (TRX, TXNRD1, PRX1) | Abcam | Cat#ab184868 |
| RNAseq Data deposited to PubMed Geo under GSE117425 | This study | PubMed ID (GSE117425) |
| Chemicals, Peptides, and Recombinant Proteins | ||
| (4-Iodobutyl)triphenylphosphonium (IBTP) | Abcam | Cat#ab144646;CAS#159085-21-9 |
| 1-chloro-2,4-dinitrobenzene | Sigma-Aldrich | Cat#237329; CAS#97-00-7 |
| 5-sulfosalicylic acid hydrate | Sigma-Aldrich | Cat#390275; CAS#304851-84-1 |
| acivicin | Sigma-Aldrich | Cat#sml0312; CAS#42228-92-2 |
| acrolein | Sigma-Aldrich | Cat#89116; CAS#107-02-8 |
| Alamethicin from Trichoderma viride | Sigma-Aldrich | Cat#A4665; CAS#27061-78-5 |
| Amplex Red | ThermoFisher | Cat#A12222; CAS#119171-73-2 |
| Carbonyl cyanide 4-(trifluoromethoxy)phenylhydrazone | Sigma-Aldrich | Cat#C2920; CAS#370-86-5 |
| d15-MitoB | Cayman Chemical | Cat#17470 |
| Disodium succinate | Sigma-Aldrich | Cat#w327700; CAS#150-90-3 |
| DTNB | ThermoFisher | Cat#22582; CAS#69-78-3 |
| Glutathione Reductase | Sigma-Aldrich | Cat#10105678001 |
| HRP | ThermoFisher | Cat#31490; CAS#9003-99-0 |
| Human recombinant Peroxiredoxin 1 | Abcam | Cat#ab79945 |
| Human recombinant thioredoxin 1 | Abcam | Cat#ab51064 |
| Human recombinant TXRND1 | Sigma-Aldrich | Cat#SRP6081 |
| Hydrogen peroxide solution | Sigma-Aldrich | Cat#H1009; CAS#7722-84-1 |
| L-glutathione | Sigma-Aldrich | Cat#G4251; CAS#70-18-8 |
| L-glutathione oxidised | Sigma-Aldrich | Cat#G4376; CAS#27025-41-8 |
| Lipofectamine 2000 | ThermoFisher | Cat#11668027 |
| Methyltriphenylphosphonium bromide (TPMP) | Sigma-Aldrich | Cat#130079; CAS#1779-49-3 |
| Methyltriphenylphosphonium iodide [methyl-3H] | American Radiolabelled Chemicals | Cat#0724-250 |
| MitoCDNB | this paper | n/a |
| MitoCysDNB | this paper | n/a |
| MitoGSDNB | this paper | n/a |
| MitoPQ | Abcam | Cat#ab146819; CAS#146819-28-8 |
| MitoSOX red | ThermoFisher | Cat#M36008 |
| NADPH Tetrasodium salt | Sigma-Aldrich | Cat#10107824001; CAS#2646-71-1 |
| N-ethylmaleimide (NEM) | Sigma-Aldrich | Cat#E3876; CAS#128-53-0 |
| Propidium Iodide | ThermoFisher | Cat#P1304MP; CAS#25535-16-4 |
| Recombinant Human GSTK1 protein | Abcam | Cat#ab93457 |
| Recombinant Human SOD2 | ThermoFisher | Cat#LF-P0013 |
| Rotenone | Sigma-Aldrich | Cat#R8875; CAS#83-79-4 |
| Seleno-L-cystine | Sigma-Aldrich | Cat#545996; CAS#29621-88-3 |
| Succinate | Sigma-Aldrich | Cat#224731; CAS#150-90-3 |
| Critical Commercial Assays | ||
| BCA Assay Kit | ThermoFisher | Cat#23225 |
| PureLink RNA Mini Kit | ThermoFisher | Cat#12183018A |
| Deposited Data | ||
| RNASeq Data | This paper | GSE117425 |
| Experimental Models: Cell Lines | ||
| HEPG2 | ATCC | Cat#HB-8065; RRID: CVCL_0027 |
| C2C12 | ATCC | Cat#CRL-1772; RRID: CVCL_0188 |
| Experimental Models: Organisms/Strains | ||
| C57BL/6J Mice | Charles River | Cat#664 |
| Wistar Rat | Charles River | Cat#003 |
| Recombinant DNA | ||
| pLYS1-FLAG-MitoGFP-HA | Vamsi Mootha Lab (Sancak et al., 2013) | AddGene#50057 |
| Software and Algorithms | ||
| GraphPad Prism | ThermoFisher | https://www.thermofisher.com/order/catalog/product/INQSOF012 |
| CASAVA 1.8 | Illumina | https://support.illumina.com/sequencing/sequencing_software/bcl2fastq-conversion-software.html |
| TrimGalore! | Babraham Bioinformatics | http://www.bioinformatics.babraham.ac.uk/projects/trim_galore/ |
| HISat2 | John Hopkins Centre for Computational Biology | https://ccb.jhu.edu/software/hisat2/index.shtml |
| FeatureCounts | Subread, WEHI | http://subread.sourceforge.net/ |
| FlowJo 10.4.2 | FlowJo | https://www.flowjo.com/ |
| DESEQ2 | Bioconductor | https://bioconductor.org/packages/release/bioc/html/DESeq2.html |
| ImageStudio Lite | LICOR | https://www.licor.com/bio/products/software/image_studio_lite/ |
| ImageJ | NIH | https://imagej.nih.gov/ij/ |
| Other | ||
| 96-well polypropylene hydrophilic PVDF 0.45 μm filter plate | Porvair Sciences | Cat#360043 |
| 1 x 50 mm MS column | Waters | Cat#186002344 |
Contact for Reagent and Resource Sharing
Further information and requests for resources and reagents should be directed to and will be fulfilled by the Lead Contact, Michael Murphy (mpm@mrc-mbu.cam.ac.uk) or by the co-corresponding author Prof Richard Hartley (Richard.Hartley@glasgow.ac.uk).
Experimental Model and Subject Details
Mice and Rats
All procedures were carried out in accordance with the UK Animals (Scientific Procedures) Act of 1986 and the University of Cambridge Animal Welfare Policy under project licence 70/8238 reviewed by local review committee. Wistar rats (003, wildtype, female) and C57BL/6 mice (664, wildtype, male) were ordered from Charles River Laboratories UK (Margate, UK). Both were maintained in pathogen-free facilities with ad lib food and water and used between 8-12 weeks (mice) and 10-12 weeks (rats). Animals were culled by cervical dislocation with accordance to UK Home Office Schedule 1.
Cell Lines
C2C12 (female) and HEPG2 (male) cells were obtained from American Type Culture Collection (ATCC). Both were maintained at 37°C, 5 % CO2 and 100 % humidity. Cell media was changed every 2-3 days with passaging at <80 % confluency and seeding at no higher than 5 x 10³ viable cells/cm2 with a typical subcultivation ratio of 1:4-1:6. Cell media was DMEM media (4.5 g/L glucose, 1 mM sodium pyruvate, 2 mM Glutamax, 1.5 g/L sodium bicarbonate) with 10 % Foetal Bovine Serum, 100 U/mL penicillin and 100 μg/mL streptomycin.
Method Details
Chemical Syntheses
Reagents were obtained from commercial suppliers and used without further purification. Acetonitrile (ACN) was dried using a Puresolv solvent. The reaction under an inert atmosphere was carried out using oven-dried glassware and solvents were added via syringe. 1H, 13C and 31P NMR spectra were obtained on a Bruker AVIII spectrometer operating at 400, 101, and 162 MHz, respectively or a Bruker AVIII operating at 500, 126, and 162 MHz, respectively. All coupling constants were measured in Hertz. Deuterated solvents contained trimethylsilane (TMS) as a reference compound. DEPT was used to assign the signals in 13C NMR spectra as C, CH, CH2 and CH3. Mass spectra (MS) were recorded on a Jeol JMS700 (MStation) spectrometer for EI and CI or Bruker Microtof-q for ESI. A Shimadzu FTIR-8400S spectrometer was used to obtain infrared (IR) spectra. Purification by used a Biotage Isolera automated system.
Chemical Synthesis of MitoCDNB, MitoGSDNB and N-MitoCysDNB

[4-(5’-Chloro-2’,4’-dinitrophenylamino)but-1-yl]triphenylphosphonium (MitoCDNB) methanosulfonate
1,5-Dichloro-2,4-dinitrobenzene (847 mg, 3.57 mmol, 1.1 eq.) was added to a stirring solution of (4-aminobutyl)triphenylphosphonium bromide (1.50 g, 3.25 mmol, 1.0 eq.) in dry ACN (10 mL) under an argon atmosphere. Anhydrous N,N-diisopropylethylamine (1.30 mL, 7.50 mmol, 2.0 eq.) was added dropwise and the resulting solution stirred for 24 h at RT under an argon atmosphere. The reaction mixture was concentrated under reduced pressure and redissolved in CH2Cl2. The solution was then washed with aquoeus hydrochloric acid (0.5 M, 2 × 50 mL), dried over magnesium sulfate and concentrated under vacuum. The product was then purified by column chromatography using a 25 g SNAP ultra cartridge [SiO2, CH2Cl2:MeOH (100:0→90:10)]. The product containing fractions were concentrated under vacuum, redissolved in CH2Cl2 then washed with aqueous sodium methanesulfonate (0.5 M, 2 × 50 mL), dried over magnesium sulfate and concentrated under vacuum to give the MitoCDNB as the methanesulfonate salt as a yellow foam (940 mg, 46 %). Rf [SiO2, CH2Cl2:MeOH (95:5)]: 0.57. ʋmax (ATR): 3364 (NH), 3063 (CH), 2932 (CH), 1613 (NH), 1539 (NO), 1323 (NO) cm-1. δH (500 MHz, CDCl3): 1.80-1.73 (2H, m, H2-2), 2.12 (2H, qn, J = 6.6 Hz, H2-3), 2.77 (3H, s, CH3), 3.68 (2H, q, J = 6.0 Hz, H2-4), 3.81-3.74 (2H, m, H2-1), 7.10 (1H, s, H-6’), 7.84-7.67 (15H, m, Ar-H), 8.51 (1H, t, J = 5.5 Hz, NH), 8.98 (1H, s, H-3’), δC (126 MHz, CDCl3): 19.70 (d, J = 3.7 Hz, CH2), 21.55 (d, J = 51.7 Hz, CH2), 28.65 (d, J = 17.0 Hz, CH2), 39.69 (CH3), 42.23 (CH2), 116.80 (CH), 118.30 (d, J = 86.0 Hz, C), 126.85 (CH), 128.99 (C), 130.63 (d, J=12.5 Hz, CH), 133.70 (d, J=10.1 Hz, CH), 134.25 (C), 135.18 (d, J = 2.9 Hz, CH), 135.81 (C), 147.00 (C). δP (202 MHz, CDCl3): 24.51 (1P, s). LRMS (ESI+): 534 [M+, 100]. HRMS: 534.1323. C28H26N3O4P35Cl requires M+ 534.1344.
{4-[5’-(S-glutathionyl)-2’,4’-dinitrophenylamino]but-1-yl}triphenylphosphonium (MitoGSDNB) chloride
Glutathione (58 mg, 0.19 mmol, 2.0 eq.) was added to a solution of MitoCDNB (60 mg, 0.095 mmol, 1.0 eq.) and NaHCO3 (22 mg, 0.26 mmol, 3.3 eq) in EtOH:H2O (1:1, 2.0 mL). The solution was stirred at RT for 3 h then concentrated under vacuum. The resulting solid was dissolved in water and purified by reversed phase chromatography using a 12 g C-18 cartridge eluting a gradient of water: 0% → 40% ACN over 10 column vols. The product-containing fractions were concentrated under vacuum to give the sulfide as a yellow solid (43 mg, 54%). δH (400 MHz: MeOD): 1.85-1.95 (2H, m, PCH2CH2), 1.98-2.07 (2H, m, NCH2CH2), 2.15 (2H, q, J = 7.1 Hz, CH2CH2CONH), 2.66 – 2.48 (2H, m, CH2CONH), 3.21 (1H, dd, J = 14.6, 10.1 Hz, CHAHBS), 3.53-3.73 (8H, m, Gln CH, Gly CH2, PCH2, NCH2, CHAHBS), 4.68 (1H, dd, J = 10.0, 3.6 Hz, Cys CH), 6.87 (1H, s, Ar-H), 7.70-7.90 (15H, m, Ar-H), 8.96 (1H, s, Ar-H). δC (101 MHz: MeOD): 19.54 (d, J = 3.9 Hz, CH2), 20.90 (d, J = 51.5 Hz, CH2), 26.64 (CH2), 28.95 (d, J = 16.8 Hz, CH2), 31.75 (CH2), 33.60 (CH2), 41.63 (CH2), 43.24 (CH2), 52.09 (CH), 54.06 (CH), 108.27 (CH), 118.42 (d, J = 86.3 Hz, C), 126.15 (CH), 127.64 (C), 130.18 (d, J = 12.5 Hz, CH), 133.06 (C), 133.47 (d, J = 9.9 Hz, CH), 134.90 (d, J = 3.0 Hz, CH), 145.76 (C), 146.22 (C), 170.00 (C), 172.72 (C), 174.02 (C), 174.40 (C). δP (162 MHz: MeOD): 23.95 (s). HRMS (ESI): 805.2378. C38H42O10N6PS2 requires M+, 805.2415
N-MitoCysDNB disulfide bis(trifluoroacetate)
L-Cysteine hydrochloride (32 mg, 0.19 mmol, 2.0 eq.) was added to a solution of MitoCDNB (60 mg, 0.095 mmol, 1.0 eq.) and NaHCO3 (32 mg, 0.38 mmol, 4.0 eq) in EtOH:H2O (1:1, 2.0 mL). The solution was stirred at RT for 48 h then extracted into dichloromethane (2 x 10 mL). The organic layer was dried over magnesium sulfate and concentrated under vacuum. The resulting solid was dissolved in MeOH (2 mL) and stirred overnight at RT. The product was then purified by RP-HPLC on a Shimadzu Prominence instrument using a Phenomenex Kinetex EVO C-18 5 micron 250 x 10 mm column eluting isocratic MeOH:0.1% TFA (aq) (60:40, flow rate 5.0 mL/min) to give the disulfide as the bis(trifluoroacetate) salt as a yellow solid (5 mg, 10%). δH (400 MHz, CD3CN): 1.77-1.84 (4H, m, 2 x PCH2CH2), 1.85-2.00 (presumed 4H obscured by NMR solvent, 2 x NHCH2CH2), 3.14 (2H, dd, J = 13.9, 6.4 Hz, 2 × CHAHBS), 3.31-3.38 (4H, m, 2 × PCH2), 3.40-3.50 (4H, m, 2 × NHCH2), 3.61 (2H, dd, J = 13.9, 4.1 Hz, 2 × CHAHBS), 4.70-4.74 (2H, m, 2 × CHCO2H), 5.78 (2H, s, Ar-H), 7.67-7.75 (24H, m, Ar-H), 7.81-7.86 (6H, m, Ar-H), 8.23 (2H, t, J = 5.5 Hz, N-H), 8.74 (2H, d, J = 7.0 Hz, N-H), 8.96 (2H, s, Ar-H). δC (101 MHz, CD3CN): 20.28 (CH2), 21.90 (d, J = 51.6 Hz, CH2), 29.18 (d, J = 16.8 Hz, CH2), 41.45 (CH2), 42.43 (CH2), 55.48 (CH), 92.07 (CH), 118.76 (d, J = 86.4 Hz, C), 124.54 (C), 124.90 (C), 129.42 (CH), 130.82 (d, J = 12.5 Hz, CH), 134.23 (d, J = 9.9 Hz, CH), 135.62 (d, J = 3.0 Hz, CH), 147.75 (C), 149.12 (C), 172.30 (C). δP (162 MHz, CD3CN): 23.81 (s). δF (376 MHz, CD3CN): –76.45 (s). HRMS (ESI): 640.1489. C62H60O12N8P2S2Na2 requires (M – 2CF3CO2H + 2Na)2+, 640.1516.
Analysis of Compound Reactivity
MitoCDNB and MitoGSDNB were stored as 10 mM stocks in ethanol (EtOH) and stored under argon at -20°C. UV/visible spectra and kinetic analyses were done using a UV2501PC spectrophotometer (Shimadzu) in a 1 mL quartz cuvette containing KCl buffer (120 mM KCl, 10 mM HEPES, 1 mM EGTA, pH 7.2 (KOH) at RT, unless stated otherwise). MitoGSDNB formation was measured at 328 nm using a difference extinction coefficient (Δɛ328 = 8.1 mM-1 cm-1). GSDNB formation was measured at 340 nm (ε340 = 9 mM-1 cm-1 ) (Habig et al., 1974b). Inhibition of GST by GSDNB/MitoGSDNB was assessed by measuring activity of GST to conjugate GSH to acrolein and the resultant decrease in absorbance at 215 nm. Samples for RP-HPLC were prepared by resuspension to 25 % (v/v) acetonitrile (ACN) containing 0.1 % trifluoroacetic acid (TFA), followed by centrifugation (16000 x g for 10 min) and filtration of the supernatant through a syringe-driven 0.22 μm polyvinylidene difluoride (PVDF) filter unit (Millex, Millipore). Samples were then loaded into a 2 mL sample loop and separated by RP-HPLC using a C18 column (Jupiter 300A, Phenomenex) attached to a Widepore C18 guard column (Phenomenex), all driven by a Gilson 321 pump. A flow rate of 1 mL/min was used with a gradient of 0.1 % (v/v) TFA in water (Buffer A) and Buffer B at: (% B). 0-2 min; 5 %, 2-17 min; 5-100 %, 17-19 min; 100 %, 19-22 min; 100-5%. Absorbance was measured at 220, 328 or 340 nm using a UV-Visible detector (Gilson 151).
LC-MS/MS Analysis
A Waters Xevo TQ-S triple-quadrupole mass spectrometer was used for MS analysis. Electrospray ionization was in positive ion mode; parameters were as follows: capillary voltage, 3.2 kV; cone voltage, 79 V; ion source temperature, 150°C; collision energy, 45 V. Nitrogen and argon were used as the curtain and the collision gases, respectively. MitoCDNB, MitoGSDNB and MitoCysDNB fragmentation patterns were obtained by direct infusion of 50 nM compound in 20 % (v/v) ACN + 0.1 % (v/v) formic acid (FA) at 25 μL/min. Data were acquired for 1 min. For determination of breakdown products, cell samples were extracted as described below, diluted 1:100 into 20 % ACN/0.1% FA, and precursor scans were obtained by direct infusion at 50 μL/min; data was acquired for 1 min. LC-MS/MS analyses were carried out using a front end I-class Aquity LC system (Waters). Samples were cooled and 2 μL injected using a 15 μL flow-through needle and RP-HPLC was carried out at 30°C using an Acquity UPLC BEH C18 1.7 μm, 1 × 50 mm column (Waters). Buffers were 5 % (v/v) ACN/0.1 % (v/v) formic acid (FA) in water (MS buffer A) and 90 % (v/v) ACN/0.1 % (v/v) FA (MS buffer B). A gradient was run at 200 μL/min: 0–0.3 min, 5 % B; 0.3–3 min, 5–100 % B; 4–4.1 min, 100–5 % B; 4.1–4.6 min, 5 % B. Eluent was diverted to waste at 0–1 and 4-4.6 min acquisition time using an in-line divert valve. Multiple reaction monitoring in positive ion mode was used for compound detection. Transitions used were: MitoCDNB, 534>183; MitoGSDNB, 805>183, d15-MitoB, 412>191, MitoCysDNB, 619>183. For each experiment standard curves were prepared using known amounts of MitoCDNB, MitoGSDNB or MitoCysDNB, which were spiked with internal standard of 10 pmol d15-MitoB and extracted in parallel with the samples. Standards and samples were quantified using MassLynx 4.1 software to determine the peak area for MitoCDNB, MitoGSDNB and d15-MitoB and the standard curves were used to determine the amounts of MitoCDNB, MitoGSDNB and MitoCysDNB present.
Sample Extraction for LC-MS/MS Analysis
Tissue homogenates and urine samples were extracted by mixing 1:1 with 95 % ACN + 0.1 % FA. Mitochondrial and cell pellets were extracted by addition of 1 mL 95 % ACN + 0.1 % FA. Blood (45 μL was added to tubes containing 5 μL of 5 mM EDTA and immediately centrifuged at 16,000 x g for 5 min. Plasma was then removed and mixed 1:1 with 95 % ACN + 0.1 % FA. Samples were then kept on ice for 1 h, followed by centrifugation (16,000 x g for 10 min). Supernatants were re-centrifuged (16,000 x g for 10 min) before filtration through a 0.45 μm polyethylene filter plate (Porvair Sciences). Filtered solutions were then centrifuged (16,000 x g for 10 min) before overnight drying using a Genevac miVac Quattro concentrator. The dried extract was resuspended in 200 μL 20 % ACN + 0.1 % FA, centrifuged (16,000 x g for 10 min) and the supernatant analysed by LC-MS/MS.
Mitochondrial Isolation and Fractionation
For isolated mitochondrial studies and matrix preparation, livers, hearts and kidneys were prepared from rats or mice. In all cases mitochondria were isolated by homogenisation using a dounce homogeniser followed by differential centrifugation at 4°C. Liver and kidney mitochondria were prepared in STE buffer (250 mM sucrose, 10 mM Tris, 1 mM EGTA, pH 7.4). Heart mitochondria were isolated using STE buffer supplemented with 0.1 % (w/v) fatty acid free BSA. Homogenates were pelleted by centrifugation at 700 x g for 5 min (heart) or 3000 x g for 3 min (liver and kidney). The supernatant was collected and centrifuged at 5,500 x g for 10 min (heart) or 10 000 x g for 10 min (liver and kidney). Mitochondrial pellets were resuspended in 1 mL (heart) or 10 mL (liver and kidney) and re-centrifuged at 5,500 x g for 10 min (heart) or 10000 x g for 10 min (liver and kidney) prior to final re-suspension in 100 μL per heart, 1 mL per kidney or 5 mL per liver.
Mitochondrial matrix was prepared by vortexing rat liver mitochondria (10 mg protein/mL) in STE, followed by 5 freeze-thaw cycles (liquid nitrogen to RT). The suspension was then sonicated (10 cycles of 1 min at 50 W followed by 5 min on ice using a Q700 mini-tip sonicator, QSonica). The suspension was then centrifuged (205,000 x g for 1 h at 4°C) and the resulting supernatant was centrifuged once more, and the protein concentration determined by the BCA assay. Aliquots (1 mg protein/mL) were snap frozen on dry ice and stored at -80°C until use. In all cases protein concentration was measured using the bicinchoninic acid (BCA) assay with bovine serum albumin (BSA) as a standard.
Mitochondrial Incubations
Mitochondrial incubations were in KCl buffer (120 mM KCl, 10 mM HEPES, 1 mM EGTA, pH 7.2) at 37°C, with succinate (10 mM), rotenone (4 μg/mL), FCCP (2 μM) added as appropriate, unless stated otherwise. After incubations mitochondria were pelleted by centrifugation (7500 x g for 10 min) and pellets and supernatants analysed as necessary. An ion-selective electrode sensitive to the triphenylphosphonium (TPP) cation moiety was constructed and used to measure accumulation of MitoCDNB into mitochondria as described previously (Asin-Cayuela et al., 2004). Briefly, the TPP ion-selective electrode was constructed from a PVC membrane incorporating a tetraphenylborate ion-exchanger and filled with an aqueous solution of 10 mM TPMP. The electrode and a Ag/AgCl reference electrode were inserted through the air-tight Perspex lid of a stirred incubation chamber containing 3 mL incubation buffer. Mitochondrial respiration was measured in 2 mL KCl buffer using an Oroboros O2k high resolution respirometer (Oroboros Instruments, Austria). Measurements of hydrogen peroxide (H2O2) production by mitochondria was performed using a fluorometric plate reader to assess conversion of Amplex Red to resorufin (SpectraMax geminiXS; Molecular Devices). Rat heart mitochondria (70 μg protein) were incubated with 4 μg horseradish peroxidase (HRP), 4 μg MnSOD and 40 μg BSA in a final volume of 100 μL KCl buffer in a 96 well plate. A further 100 μL KCl buffer was added containing 10 mM succinate and 85 μM Amplex Red. Resorufin fluorescence was detected by excitation at 570 nm and emission at 585 nm and calibrated against known H2O2 concentrations (43.6 M-1cm-1 at 240 nm). The membrane potential in isolated mitochondria was measured by the accumulation of radiolabelled triphenylmethylphosphonium (TPMP) as described (Ross et al., 2006).
Cell Culture and Isolation of Mitochondria from Cells
C2C12 and HepG2 cells were maintained at subconfluency (< 80 %) at 37°C in a humidified atmosphere of 95 % air and 5 % CO2 in Dulbecco’s Modified Eagle’s Medium (DMEM; Gibco) with high glucose (4.5 g/L D-glucose), supplemented with 10 % (v/v) foetal bovine serum (FBS), 100 U/mL penicillin and 100 μg/mL streptomycin. To measure cell growth, cells were typically seeded at 30,000 cells/well in 24-well plates and left to adhere for 16 h. Cells were then exposed to appropriate treatments and confluence monitored using an IncuCyte HD (Essen Bioscience). Images of wells were taken in technical replicates of 4, every 4 h until maximum confluence in control groups, and biological replicates performed on 3 separate cell passages.
To isolate mitochondria from cells (Clayton and Shadel, 2014), cells were grown up to 5-30 x 106/cm2 in Nuclon Delta treated flasks (Thermo Fisher Scientific). After appropriate incubations, cells were detached using trypsin, pelleted (10000 x g for 3 min) and resuspended in 11 mL RSB Hypo buffer (10 mM NaCl, 1.5 mM MgCl2, 10 mM Tris-HCl (pH 7.5)). After incubation on ice for 10 min on ice cells were homogenised using a tight fitting Dounce homogeniser and then 8 mL 2.5 x hypertonic buffer (575 mM mannitol, 175 mM sucrose, 12.5 mM Tris-HCl, 2.5 mM EDTA (pH 7.5)) was added. The suspension was mixed, and a sample taken for total cell measurements. The homogenate was then made up to 30 mL using 1 x hypertonic buffer centrifuged (1300 x g for 5 min) and the supernatant again centrifuged (12500 x g for 15 min). The pellet was then resuspended in STE buffer and re-centrifuged.
For cell fractionation after mitochondrial fragmentation cells were grown up to 20 x 106 in 150 mm dishes (Thermo Fisher Scientific). After appropriate incubations, cells were detached using trypsin, pelleted (150 x g, 3 min, RT) and resuspended in 1 mL Mito isolation buffer (MIB) (220 mM D-Mannitol, 70 mM Sucrose, 1 mM EDTA, 10 mM HEPES). Cells were homogenised using a tight fitting Dounce homogeniser (Wheaton, USA) and a sample was taken as a whole cell fraction. The homogenate was centrifuged (800 x g, 10 min, 4°C) and the pellet discarded. The supernatant was recentrifuged (800 x g, 10 min, 4°C) and pellet discarded, with this step repeated until no pellet was observed. The resulting supernatant was subsequently centrifuged (9000 x g, 10 min, 4°C), collecting the supernatant (S) and resuspending the pellet (P) in 1 mL of MIB. This step was repeated. The resuspended pellet (P) was centrifuged (9000 x g, 15 min, 4°C), the supernatant was discarded, and the pellet was resuspended in 50 μl MIB (crude mitochondrial fraction). The supernatant (S) underwent an ultracentrifugation step (109,000 x g, 1 h, 4°C) and the resulting supernatant was collected as the cytosolic fraction. The protein concentration of each fraction was measured with a BCA assay (Thermo).
Flow Cytometry
To assess relative changes in mitochondrial ROS production C2C12 cells were isolated and suspended (0.5 x 10⁶ cells/mL) in phenol red-free DMEM (supplemented with 10 % (v/v) FBS) in an Eppendorf tube supplemented with MitoSOXRed (5 μM; Thermo Fisher Scientific) and incubated with shaking in a 37°C water bath for 20 min, in the dark. The cells were then pelleted (150 x g, 3 min, RT) and resuspended in pre-warmed DMEM. At least 10,000 total events were acquired using a BD LSRFortessa cell analyzer (BD Biosciences). MitoSOX Red was excited by laser at 532 nm, and the data were collected at forward scatter (FSC), side scatter (SSC) and with 586/15 nm detector. The data were analysed using FlowJo software (version 10.4.2), with the cell debris, represented by forward and side scatter, gated out for analysis. Median fluorescence intensity (MFI) of the 586/15 nm channel was measured as a measure of mitochondrial reactive oxygen species production.
To measure cell death, C2C12 cells (300,000 cells) were grown overnight in a 6 well plate. Cells were harvested by trypsinisation and resuspended in 2 mL PBS. Test compounds were added to cells and incubate on ice for 15 min before addition of 1 μM propidium iodide for 10 min. Cells were then analysed using a BD Accuri Flow Cytometer. 10,000 events per sample were used and PI fluorescence measured using the FL2 channel, with PI excitation at 488 nm and emission at 617 nm. Initial gating controls were performed using vehicle (0.1 % EtOH) for live cells and 1 % Triton X-100 for dead cells. Cell death was calculated by relative % of events in the live/dead gates.
Glutathione Measurement
To determine the total glutathione pool (GSH + 2 x GSSG), mitochondria (1 mg protein), cells (1 x 10⁶-9 cells) or tissue homogenate (> 1 mg protein) were treated with 100 μL 5 % (w/v) sulfosalicylic acid with vortexing for 30 s, proteins precipitated by centrifugation (16000 x g for 10 min) and the supernatant analysed by the GSH recycling assay as described (Akerboom and Sies, 1981) (Scarlett et al., 1996). Data are expressed as glutathione equivalents (GSH + 2 x GSSG) normalised to protein determined by the BCA assay. For tissues, an addition of 0.1 % (v/v) TX100 was made to the 5 % SSA solution.
Thioredoxin Reductase Activity
Measurement of TrxR activity was based on (Cunniff et al., 2013). Mitochondrial (1 mg protein) or cell pellets (1 x 10⁶ cells) were prepared by centrifugation (16000 x g for 10 min) and the pellet extracted in 100 μL NP-40 lysis buffer (150 mM NaCl, 1 % (v/v) NP-40, 50 mM Tris-Cl, pH 8.0) by resuspension and incubation on ice for 10 min. Samples were then centrifuged (16000 x g for 10 min) and the supernatant retained. Protein concentration was calculated by BCA assay and then 25 μg protein was added per well of a 96-well plate. Purified TrxR1 (Sigma; 100 μg) was in 250 μl PBS. The activity assay in 96-well plates was done by addition of 25 μg protein sample, up to a final volume of 60 μL to which was added 40 μL of 1 mM NADPH and 2 mM selenocystine in NP40-lysis buffer was added, and NADPH consumption measured at 340 nm (6.22 mM-1 cm-1) for 30 min using a SpectraMax platereader (Molecular Devices). Control wells contained NADPH and protein and the background rate was subtracted from activity rates.
In Vivo Experiments
Mice were administered a 100 μL bolus by tail vein injection containing 5 mg/kg MitoCDNB in 0.9 % saline/5 % (v/v) EtOH final and then culled at the indicated time points by cervical dislocation and tissues collected. The dosage was chosen based on other TPP-compound tolerance levels in mouse models and showed no overt toxicity. Control mice were culled without injection or injected as above with 0.9 % saline/5 % (v/v) EtOH final), at appropriate time points. Tissues or blood were extracted and immediately prepared, as above.
Western Blotting
Samples were resuspended in 4X loading buffer (200 mM Tris-Cl, pH (6.8), 8 % (w/v) SDS, 0.4 % (w/v) bromophenol blue, 40 % (v/v) glycerol), 400 mM DTT as a reductant. Typically 10-25 μg protein was loaded onto 12 % or 4 – 20% Tris-Glycine SDS-PAGE gels (BioRad) and run at 120 V for 45 min. Protein was transferred to PVDF membranes (Immobilon®-FL or BioRad Trans-Blot® Turbo™Mini) by wet transfer (in the presence of 25 mM Tris, 192 mM glycine, 20% (v/v) methanol, pH (8.4)) or semi-dry transfer (BioRad Trans-Blot® Turbo™) before blocking for 1 h at RT with Odyssey blocking buffer (LICOR). Typically, primary antibody incubation was completed in 4 % (v/v) Odyssey buffer in PBS + 0.1 % (v/v) Tween-20 (PBST) for 1 h at RT. Membranes were then washed 3 x 15 min in PBST, followed by secondary incubation in 4 % Odyssey buffer in PBS for 1 h at RT, washed 2 x 15 min in PBST and 1 x 15 min in PBS. Membranes were then visualised using a LICOR Odyssey CLx system and analysed using ImageStudio Lite. Primary antibodies: rabbit anti-TPP (1:1000) (Lin et al., 2002), rabbit anti-TrxR (1:1000, Abcam), rabbit anti-Prx3 (1:500, Abcam), mouse anti-Trx (1:1000, Abcam) mouse anti-Prx2 (1:4000 Abcam). Secondary antibodies were goat anti-rabbit IRDye800 (1:25000, LICOR) and goat anti-mouse IRDye680 (1:25000, LICOR).
Peroxiredoxin Assays
C2C12 cells were plated in 6 well plates at 25,000 cells/cm2 and after 2 days were treated with test reagents. After cell incubation the media was aspirated, and cells incubated in 2 mL fresh media containing 80 mM methylmethanethiosulfonate (MMTS) for 10 min at RT. Then medium was aspirated, cells washed in ice cold PBS and then lysed with 150 μL RIPA lysing buffer (50 mM Tris, pH (8.0), 150 mM NaCl 1% (v/v) Triton-X100 (Tx100), 0.1% (w/v) SDS, 0.5% (w/v) sodium deoxycholate), supplemented with soybean trypsin-chymotrypsin inhibitor (4 μg/mL), phenylmethanesulfonyl fluoride (0.1 mM)) and MMTS (80 mM) and scraped into 1.5 ml Eppendorf tubes. Lysates were centrifuged (16,000 x g for 10 min at 4°C) and protein concentration was estimated using a BCA assay of an untreated control without MMTS. Protein (∼50 μg) was then analysed by Western blotting as above with primary antibodies used; mouse anti-Prx2 (1:4000) and rabbit anti-Prx3 (1:500) antibodies (Abcam). Membranes were visualised as described above. Prx dimerization was calculated from monomer and dimer signal intensities (SI) as follows: % dimer = (SI dimer / ((SI dimer + SI monomer)) x 100) % dimer was then expressed relative to untreated controls.
Immunocytochemistry
C2C12 cells were plated at 15,000 cells/well in 24-well plates containing glass coverslips. After 16 h the compounds of interest were added. At the end of the incubation the media was removed, cells were washed twice in PBS, fixed with 4 % (w/v) formaldehyde in PBS for 10 mins at RT followed by washing 3 x 10 min with PBS. Cells were then permeabilised with 0.1 % (v/v) Tx100 in PBS for 10 min, washed (3 x 10 min PBS), blocked with 5 % (w/v) BSA in PBS-T for 20 min at RT, and then incubated with primary antibody in 5 % (w/v) BSA in PBS for 2 h at RT. Primary antibody solution was removed, cells washed (3 x 10 min PBS) and incubated with secondary antibodies in 5 % (w/v) BSA in PBS for 1 h at RT. This solution was then removed and cells washed (3 x 10 min in PBS). Coverslips were then mounted onto slides using Dako Mounting Medium (10 μL/coverslip; Agilent) and analysed using Andor Dragonfly spinning disk confocal microscope equipped with a Nikon Plan-Apochromat 100x/1.45 NA oil immersion objective and a Zyla 4.2 SCMOS camera (ANDOR). Z-stacks were acquired at 0.2-μm steps. Representative images for each condition were taken from >30 cells and sorted by a blinded colleague into tubular, intermediate and fragmented mitochondrial categories (Morita et al., 2017). This process was repeated on three separate cell passages to ensure biological replication. Primary antibody was rabbit anti-TOMM20 (1 in 1000; Santa Cruz Biotechnology). Secondary antibody was AlexaFluor594 goat anti-rabbit (1:1000; Thermo Fisher Scientific). Images processing was performed using ImageJ software.
Confocal ROS Measurements
C2C12 cells were plated at 75,000 cells in 27 mm Nunc Glass Bottom Dishes (Thermo Fisher Scientific). The next day cells were washed x 2 with pre-warmed PBS and incubated with MitoSOX (5 μM; Thermo Fisher Scientific) in full growth medium. Cells were washed three times in Krebs buffer (118 mM NaCl, 4.7 mM KCl, 1.2 mM MgSO4, 1.25 mM CaCl2, 1.2 mM KH2PO4, 25 mM NaHCO3, 11 mM glucose) and placed on the live cell imaging incubator (OKO lab) with 5 % CO2 and 37°C. Acquisition was performed using a Nikon A1-R confocal microscope equipped with a Nikon Plan-Apochromat 60x/1.4 N.A. objective. Z-stacks were acquired at 0.5 μm steps of at least 10 cells per condition. Cells were imaged before (0 min) and after (30 min) MitoParaquat (5 μM) addition and the fluorescence intensity in the cytosol was quantified by Fiji (Image J) (Schindelin et al., 2012).
Mitochondrial Dynamics
For live imaging, C2C12 cells were plated at 50,000 cells/well in 6 well plates with glass coverslips pre-installed. After 24 hours, cells were transfected with 1 μg of MitoGFP (Addgene;#50057) using lipofectamine according to manufacturer’s instructions. After 48 h the coverslip containing cells was removed from the well and installed into a metal coverslip holder containing 2 mL DMEM media. Cells were then visualised by a Zeiss LSM880 confocal system equipped with a Zeiss Plan-Apochromat 63x/1.4 N. A. Cells were visualised and focussed on the system before initiation of data capture, and after 5 min of control phase compounds of interest were then added. Cells were visualised for 1 h with images taken every 1 min at 4 pre-distinguished coordinates.
RNA Extraction and Sequencing
For RNA extraction from tissues, the medial lobe of the mouse liver was collected into RNAlater (Invitrogen). Tissue (30 mg wet weight) was retrieved after 2 hours from the storage solution, placed in PureLink RNA Mini Kit lysis buffer (Invitrogen) in a Precellys tube (Soft tissue homogenising CK14 – 2mL; Bertin Instruments) and homogenised twice using a Precellys 24 tissue homogeniser (6,500 rpm, 15 seconds: Bertin Instruments). RNA was extracted using a PureLink RNA Mini Kit (Invitrogen) with the RNA eluted into 80 μl RNA-free water and immediately placed on ice. The 260:280 and 260:230 UV absorption ratios were assessed using a NanoDrop spectrophotometer. The RNA concentration and RNA integrity number (RIN) were determined using the Agilent 4200 TapeStation System and RNA ScreenTape (Agilent Technologies) and samples with a RIN > 8 were used for downstream analysis.
Subsequent RNA preparation and sequencing was done by Novogene. The mRNA was purified from total RNA using NEBNext Poly(A) mRNA Magnetic Isolation Module (New England Biolabs). First- and second-strand cDNA were synthesized using NEBNext synthesis modules (New England Biolabs) and purified using Agencourt AMPure XP beads (Beckman Coulter). RNA library preparation was done using NEBNext Ultra RNA Library Prep kit for Illumina (New England Biolabs). Libraries were pooled and sequenced on a HiSeq X Ten platform (Illumina) with paired-end 150 bp (PE 150) sequencing strategy by Novogene.
Quantificantion and Statistical Analysis
Statistical Analysis
Statistical comparison between two groups was carried out using GraphPad Prism 5 software using two-tailed Student’s t tests. Number of biological replicates (n) and statistical values can be found in each figure legend. In vitro n = independent experiments whereas in vivo n = individual animals. *p < 0.05, ** p < 0.01, ***p < 0.001.
Transcriptomic Analysis
The resulting sequencing BCL files were demultiplexed with CASAVA to FASTQ files. These were processed to remove low quality reads and adapter sequences using TrimGalore! and quality of the sequencing data was confirmed using FASTQC. Reads were aligned to the mm10 (Mus musculus; Dec 2011, Genome Reference Consortium GRCm38) genome using hisat2 and a count table produced using Featurecounts from RSubread. Normalisation and differential expression analysis was carried out using DESEQ2 within the R statistical environment.
Data and Software Analysis
GraphPad Prism 5 was used for statistical analysis and graph production. CASAVA, TrimGalore!, FASTQC, Hisat2, Featurecounts from Rsubread and DESEQ2 in R platform were used in the processing and analysis of transcriptomic data with details above.
Data and Software Availability
The accession number for RNASeq data reported in this paper is PubMed GEO: GSE117425. Methods to obtain the data are explained above.
Acknowledgments
We acknowledge the Biotechnology and Biological Sciences Research Council (BB/I012826/1), the Wellcome Trust (WT110158/Z/15/Z, 110159/Z/15/Z and RG88195), the University of Glasgow (JMG Studentship), and the Medical Research Council (MC_U105663142 and MC_ UU_00015/7).
Author Contributions
L.M.B., R.C.H., A.M.J., and M.P.M. carried out study conception and design. L.M.B. performed, designed, and analyzed most experiments. A.R.H. and J.F.M. assisted with in vivo experiments. H.A.P., A.R.H., and T.P.B. assisted with tissue preparations and extractions and respiration measurements. A.L., S.A., and T.A.P. performed mass spectrometry. J.M.G., S.T.C., and R.C.H. designed and performed chemical syntheses. A.R.H. and F.C. conducted confocal microscopy experiments and immunocytochemistry, overseen by J.P. and C.B. E.C.H. and T.P.B. performed western blots. M.R.C. and J.R.F. assisted with RNA sequencing data analysis. T.K. supervised mouse experiments.
Declaration of Interests
The authors declare no competing financial interest.
Published: January 31, 2019
Footnotes
Supplemental Information includes six figures and three videos and can be found with this article online at https://doi.org/10.1016/j.chembiol.2018.12.002.
Contributor Information
Richard C. Hartley, Email: richard.hartley@glasgow.ac.uk.
Michael P. Murphy, Email: mpm@mrc-mbu.cam.ac.uk.
Supplemental Information
References
- Akerboom T.P.M., Sies H. Assay of glutathione, glutathione disulfide and glutathione mixed disulfides in biological samples. Methods Enzymol. 1981;113:373–382. doi: 10.1016/s0076-6879(81)77050-2. [DOI] [PubMed] [Google Scholar]
- Arner E.S., Holmgren A. Physiological functions of thioredoxin and thioredoxin reductase. Eur. J. Biochem. 2000;267:6102–6109. doi: 10.1046/j.1432-1327.2000.01701.x. [DOI] [PubMed] [Google Scholar]
- Arnér E.S.J., Björnstedt M., Holmgren A. 1-Chloro-2,4-dinitrobenzene (DNCB) is an irreversible inhibitor of human thioredoxin reductase: loss of thioredoxin disulfide reductase activity is accompanied by a large increase in NADPH oxidase activity. J. Biol. Chem. 1995;270:3479–3482. doi: 10.1074/jbc.270.8.3479. [DOI] [PubMed] [Google Scholar]
- Asin-Cayuela J., Manas A.R., James A.M., Smith R.A., Murphy M.P. Fine-tuning the hydrophobicity of a mitochondria-targeted antioxidant. FEBS Lett. 2004;571:9–16. doi: 10.1016/j.febslet.2004.06.045. [DOI] [PubMed] [Google Scholar]
- Baars A.J., Mukhtar H., Zoetemelk C.E., Jansen M., Breimer D.D. Glutathione S-transferase activity in rat and human tissues and organs. Comp. Biochem. Physiol. C. 1981;70:285–288. doi: 10.1016/0306-4492(81)90066-6. [DOI] [PubMed] [Google Scholar]
- Blanco R.A., Ziegler T.R., Carlson B.A., Cheng P.Y., Park Y., Cotsonis G.A., Accardi C.J., Jones D.P. Diurnal variation in glutathione and cysteine redox states in human plasma. Am. J. Clin. Nutr. 2007;86:1016–1023. doi: 10.1093/ajcn/86.4.1016. [DOI] [PubMed] [Google Scholar]
- Booty L.M., King M.S., Thangaratnarajah C., Majd H., James A.M., Kunji E.R., Murphy M.P. The mitochondrial dicarboxylate and 2-oxoglutarate carriers do not transport glutathione. FEBS Lett. 2015;589:621–628. doi: 10.1016/j.febslet.2015.01.027. [DOI] [PMC free article] [PubMed] [Google Scholar]
- Cereghetti G.M., Costa V., Scorrano L. Inhibition of Drp1-dependent mitochondrial fragmentation and apoptosis by a polypeptide antagonist of calcineurin. Cell Death Differ. 2010;17:1785–1794. doi: 10.1038/cdd.2010.61. [DOI] [PMC free article] [PubMed] [Google Scholar]
- Clayton D.A., Shadel G.S. Isolation of mitochondria from tissue culture cells. Cold Spring Harb. Protoc. 2014;2014 doi: 10.1101/pdb.prot080002. [DOI] [PubMed] [Google Scholar]
- Cocheme H.M., Quin C., McQuaker S.J., Cabreiro F., Logan A., Prime T.A., Abakumova I., Patel J.V., Fearnley I.M., James A.M. Measurement of H2O2 within living Drosophila during aging using a ratiometric mass spectrometry probe targeted to the mitochondrial matrix. Cell Metab. 2011;13:340–350. doi: 10.1016/j.cmet.2011.02.003. [DOI] [PMC free article] [PubMed] [Google Scholar]
- Conrad M. Transgenic mouse models for the vital selenoenzymes cytosolic thioredoxin reductase, mitochondrial thioredoxin reductase and glutathione peroxidase 4. Biochim. Biophys. Acta. 2009;1790:1575–1585. doi: 10.1016/j.bbagen.2009.05.001. [DOI] [PubMed] [Google Scholar]
- Cox A.G., Winterbourn C.C., Hampton M.B. Mitochondrial peroxiredoxin involvement in antioxidant defence and redox signalling. Biochem. J. 2010;425:313–325. doi: 10.1042/BJ20091541. [DOI] [PubMed] [Google Scholar]
- Cunniff B., Snider G.W., Fredette N., Hondal R.J., Heintz N.H. A direct and continuous assay for the determination of thioredoxin reductase activity in cell lysates. Anal. Biochem. 2013;443:34–40. doi: 10.1016/j.ab.2013.08.013. [DOI] [PMC free article] [PubMed] [Google Scholar]
- Fernandez-Checa J.C., Kaplowitz N., Garcia-Ruiz C., Colell A. Mitochondrial glutathione: importance and transport. Semin. Liver Dis. 1998;18:389–401. doi: 10.1055/s-2007-1007172. [DOI] [PubMed] [Google Scholar]
- Findlay V.J., Townsend D.M., Saavedra J.E., Buzard G.S., Citro M.L., Keefer L.K., Ji X., Tew K.D. Tumor cell responses to a novel glutathione S-transferase-activated nitric oxide-releasing prodrug. Mol. Pharmacol. 2004;65:1070–1079. doi: 10.1124/mol.65.5.1070. [DOI] [PMC free article] [PubMed] [Google Scholar]
- Gerard-Monnier D., Fougeat S., Chaudiere J. Glutathione and cysteine depletion in rats and mice following acute intoxication with diethylmaleate. Biochem. Pharmacol. 1992;43:451–456. doi: 10.1016/0006-2952(92)90563-x. [DOI] [PubMed] [Google Scholar]
- Go Y.M., Jones D.P. Thiol/disulfide redox states in signaling and sensing. Crit. Rev. Biochem. Mol. Biol. 2013;48:173–181. doi: 10.3109/10409238.2013.764840. [DOI] [PMC free article] [PubMed] [Google Scholar]
- Goto S., Kawakatsu M., Izumi S.i., Urata Y., Kageyama K., Ihara Y., Koji T., Kondo T. Glutathione S-transferase localizes in mitochondria and protects against oxidative stress. Free Radic. Biol. Med. 2009;46:1392–1403. doi: 10.1016/j.freeradbiomed.2009.02.025. [DOI] [PubMed] [Google Scholar]
- Griffith O.W., Meister A. Origin and turnover of mitochondrial glutathione. Proc. Natl. Acad. Sci. U S A. 1985;82:4668–4672. doi: 10.1073/pnas.82.14.4668. [DOI] [PMC free article] [PubMed] [Google Scholar]
- Habig W.H., Pabst M.J., Jakoby W.B. Glutathione S-transferases: the first enzymatic step in mercapturic acid formation. J. Biol. Chem. 1974;249:7130–7139. [PubMed] [Google Scholar]
- Habig W.H., Pabst M.J., Fleischner G., Gatmaitan Z., Arias I.M., Jakoby W.B. The identity of glutathione S-transferase B with ligandin, a major binding protein of liver. Proc. Natl. Acad. Sci. U S A. 1974;71:3879–3882. doi: 10.1073/pnas.71.10.3879. [DOI] [PMC free article] [PubMed] [Google Scholar]
- Han D., Canali R., Rettori D., Kaplowitz N. Effect of glutathione depletion on sites and topology of superoxide and hydrogen peroxide production in mitochondria. Mol. Pharmacol. 2003;64:1136–1144. doi: 10.1124/mol.64.5.1136. [DOI] [PubMed] [Google Scholar]
- Hayes J.D., Flanagan J.U., Jowsey I.R. Glutathione transferases. Annu. Rev. Pharmacol. Toxicol. 2005;45:51–88. doi: 10.1146/annurev.pharmtox.45.120403.095857. [DOI] [PubMed] [Google Scholar]
- Jowsey I.R., Thomson R.E., Orton T.C., Elcombe C.R., Hayes J.D. Biochemical and genetic characterization of a murine class Kappa glutathione S-transferase. Biochem. J. 2003;373:559–569. doi: 10.1042/BJ20030415. [DOI] [PMC free article] [PubMed] [Google Scholar]
- Kelner M.J., Montoya M.A. Structural organization of the human glutathione reductase gene: determination of correct cDNA sequence and identification of a mitochondrial leader sequence. Biochem. Biophys. Res. Commun. 2000;269:366–368. doi: 10.1006/bbrc.2000.2267. [DOI] [PubMed] [Google Scholar]
- Kim H.Y., Gladyshev V.N. Methionine sulfoxide reductases: selenoprotein forms and roles in antioxidant protein repair in mammals. Biochem. J. 2007;407:321–329. doi: 10.1042/BJ20070929. [DOI] [PubMed] [Google Scholar]
- Kondo H., Moriuchi F., Sunamoto J. S-N and N-S reverse rearrangement of S- and N-(2,4-dintrophenyl)cysteines. J. Org. Chem. 1881;46:1333–1336. [Google Scholar]
- Lee F.Y., Allalunis-Turner M.J., Siemann D.W. Depletion of tumour versus normal tissue glutathione by buthionine sulfoximine. Br. J. Cancer. 1987;56:33–38. doi: 10.1038/bjc.1987.148. [DOI] [PMC free article] [PubMed] [Google Scholar]
- Lillig C.H., Holmgren A. Thioredoxin and related molecules – from biology to health and disease. Antiox. Redox Signal. 2007;9:25–47. doi: 10.1089/ars.2007.9.25. [DOI] [PubMed] [Google Scholar]
- Lillig C.H., Berndt C., Holmgren A. Glutaredoxin systems. Biochim. Biophys. Acta. 2008;1780:1304–1317. doi: 10.1016/j.bbagen.2008.06.003. [DOI] [PubMed] [Google Scholar]
- Lin T.K., Hughes G., Muratovska A., Blaikie F.H., Brookes P.S., Darley-Usmar V., Smith R.A.J., Murphy M.P. Specific modification of mitochondrial protein thiols in response to oxidative stress: a proteomics approach. J. Biol. Chem. 2002;277:17048–17056. doi: 10.1074/jbc.M110797200. [DOI] [PubMed] [Google Scholar]
- Logan A., Cocheme H.M., Li Pun P.B., Apostolova N., Smith R.A., Larsen L., Larsen D.S., James A.M., Fearnley I.M., Rogatti S. Using exomarkers to assess mitochondrial reactive species in vivo. Biochim. Biophys. Acta. 2014;1840:923–930. doi: 10.1016/j.bbagen.2013.05.026. [DOI] [PubMed] [Google Scholar]
- Lu S.C. Glutathione synthesis. Biochim. Biophys. Acta. 2013;1830:3143–3153. doi: 10.1016/j.bbagen.2012.09.008. [DOI] [PMC free article] [PubMed] [Google Scholar]
- Martensson J., Lai J.C.K., Meister A. High-affinity transport of glutathione is part of a multicomponent system essential for mitochondrial function. Proc. Natl. Acad. Sci. U S A. 1990;87:7185–7189. doi: 10.1073/pnas.87.18.7185. [DOI] [PMC free article] [PubMed] [Google Scholar]
- Mattie S., Riemer J., Wideman J.G., McBride H.M. A new mitofusin topology places the redox-regulated C terminus in the mitochondrial intermembrane space. J. Cell Biol. 2018;217:507–515. doi: 10.1083/jcb.201611194. [DOI] [PMC free article] [PubMed] [Google Scholar]
- Morales G.A., Laborde E. Small-molecule inhibitors of glutathione S-transferase P1-1 as anticancer therapeutic agents. Annu. Rep. Med. Chem. 2007;42:321–335. [Google Scholar]
- Morita M., Prudent J., Basu K., Goyon V., Katsumura S., Hulea L., Pearl D., Siddiqui N., Strack S., McGuirk S. mTOR controls mitochondrial dynamics and cell survival via MTFP1. Mol. Cell. 2017;67:922–935.e5. doi: 10.1016/j.molcel.2017.08.013. [DOI] [PubMed] [Google Scholar]
- Murphy M.P. Mitochondrial thiols in antioxidant protection and redox signaling: distinct roles for glutathionylation and other thiol modifications. Antiox. Redox Signal. 2012;16:476–495. doi: 10.1089/ars.2011.4289. [DOI] [PubMed] [Google Scholar]
- Nordberg J., Zhong L., Holmgren A., Arnér E.S.J. Mammalian thioredoxin reductase is irreversibly inhibited by dinitrohalobenzenes by alkylation of both the redox active selenocysteine and its neighbouring cysteine residue. J. Biol. Chem. 1998;273:10835–10842. doi: 10.1074/jbc.273.18.10835. [DOI] [PubMed] [Google Scholar]
- Pernas L., Scorrano L. Mito-morphosis: mitochondrial fusion, fission, and cristae remodeling as key mediators of cellular function. Annu. Rev. Physiol. 2016;78:505–531. doi: 10.1146/annurev-physiol-021115-105011. [DOI] [PubMed] [Google Scholar]
- Raza H. Dual localization of glutathione S-transferase in the cytosol and mitochondria: implications in oxidative stress, toxicity and disease. FEBS J. 2011;278:4243–4251. doi: 10.1111/j.1742-4658.2011.08358.x. [DOI] [PMC free article] [PubMed] [Google Scholar]
- Ribas V., Garcia-Ruiz C., Fernandez-Checa J.C. Glutathione and mitochondria. Front. Pharmacol. 2014;5:151. doi: 10.3389/fphar.2014.00151. [DOI] [PMC free article] [PubMed] [Google Scholar]
- Robb E.L., Gawel J.M., Aksentijevic D., Cocheme H.M., Stewart T.S., Shchepinova M.M., Qiang H., Prime T.A., Bright T.P., James A.M. Selective superoxide generation within mitochondria by the targeted redox cycler MitoParaquat. Free Radic. Biol. Med. 2015;89:883–894. doi: 10.1016/j.freeradbiomed.2015.08.021. [DOI] [PubMed] [Google Scholar]
- Romero F.J., Sies H. Subcellular glutathione contents in isolated hepatocytes treated with L-buthionine sulfoximine. Biochem. Biophys. Res. Commun. 1984;123:1116–1121. doi: 10.1016/s0006-291x(84)80248-x. [DOI] [PubMed] [Google Scholar]
- Ross M.F., Kelso G.F., Blaikie F.H., James A.M., Cocheme H.M., Filipovska A., Da Ros T., Hurd T.R., Smith R.A., Murphy M.P. Lipophilic triphenylphosphonium cations as tools in mitochondrial bioenergetics and free radical biology. Biochemistry (Mosc.) 2005;70:222–230. doi: 10.1007/s10541-005-0104-5. [DOI] [PubMed] [Google Scholar]
- Ross M.F., Da Ros T., Blaikie F.H., Prime T.A., Porteous C.M., Severina I.I., Skulachev V.P., Kjaergaard H.G., Smith R.A., Murphy M.P. Accumulation of lipophilic dications by mitochondria and cells. Biochem. J. 2006;400:199–208. doi: 10.1042/BJ20060919. [DOI] [PMC free article] [PubMed] [Google Scholar]
- Ross M.F., Prime T.A., Abakumova I., James A.M., Porteous C.M., Smith R.A.J., Murphy M.P. Rapid and extensive uptake and activation of hydrophobic triphenylphosphonium cations within cells. Biochem. J. 2008;411:633–645. doi: 10.1042/BJ20080063. [DOI] [PubMed] [Google Scholar]
- Sancak Y., Markhard A.L., Kitami T., Kovacs-Bogdan E., Kamer K.J., Udeshi N.D., Carr S.A., Chaudhuri D., Clapham D.E., Li A.A., Calvo S.E., Goldberger O., Mootha V.K. EMRE is an essential component of the mitochondrial calcium uniporter complex. Science. 2013;342:1379–1382. doi: 10.1126/science.1242993. [DOI] [PMC free article] [PubMed] [Google Scholar]
- Scarlett J.L., Packer M.A., Porteous C.M., Murphy M.P. Alterations to glutathione and nicotinamide nucleotides during the mitochondrial permeability transition induced by peroxymitrite. Biochem. Pharmacol. 1996;52:1047–1055. doi: 10.1016/0006-2952(96)99426-5. [DOI] [PubMed] [Google Scholar]
- Schindelin J., Arganda-Carreras I., Frise E., Kaynig V., Longair M., Pietzsch T., Preibisch S., Rueden C., Saalfeld S., Schmid B. Fiji: an open-source platform for biological-image analysis. Nat. Methods. 2012;9:676–682. doi: 10.1038/nmeth.2019. [DOI] [PMC free article] [PubMed] [Google Scholar]
- Shutt T., Geoffrion M., Milne R., McBride H.M. The intracellular redox state is a core determinant of mitochondrial fusion. EMBO Rep. 2012;13:909–915. doi: 10.1038/embor.2012.128. [DOI] [PMC free article] [PubMed] [Google Scholar]
- Smith R.A., Kelso G.F., Blaikie F.H., Porteous C.M., Ledgerwood E.C., Hughes G., James A.M., Ross M.F., Asin-Cayuela J., Cocheme H.M. Using mitochondria-targeted molecules to study mitochondrial radical production and its consequences. Biochem. Soc. Trans. 2003;31:1295–1299. doi: 10.1042/bst0311295. [DOI] [PubMed] [Google Scholar]
- Smith R.A., Hartley R.C., Murphy M.P. Mitochondria-targeted small molecule therapeutics and probes. Antioxid. Redox Signal. 2011;15:3021–3038. doi: 10.1089/ars.2011.3969. [DOI] [PubMed] [Google Scholar]
- Smith R.A., Hartley R.C., Cocheme H.M., Murphy M.P. Mitochondrial pharmacology. Trends Pharmacol. Sci. 2012;33:341–352. doi: 10.1016/j.tips.2012.03.010. [DOI] [PubMed] [Google Scholar]
- Urig S., Becker K. On the potential of thioredoxin reductase inhibitors for cancer therapy. Semin. Cancer Biol. 2006;16:452–465. doi: 10.1016/j.semcancer.2006.09.004. [DOI] [PubMed] [Google Scholar]
- Wahlländer A., Soboll S., Sies H., Linke I., Müller M. Hepatic mitochondrial and cytosolic glutathione content and the subcellular distribution of GSH-S-transferases. FEBS Lett. 1979;97:138–140. doi: 10.1016/0014-5793(79)80069-1. [DOI] [PubMed] [Google Scholar]
- Willems P.H., Rossignol R., Dieteren C.E., Murphy M.P., Koopman W.J. Redox homeostasis and mitochondrial dynamics. Cell Metab. 2015;22:207–218. doi: 10.1016/j.cmet.2015.06.006. [DOI] [PubMed] [Google Scholar]
- Zhang H., Forman H.J., Choi J. Gamma-glutamyl transpeptidase in glutathione biosynthesis. Methods Enzymol. 2005;401:468–483. doi: 10.1016/S0076-6879(05)01028-1. [DOI] [PubMed] [Google Scholar]
- Zhong L., Arnér E.S.J., Ljung J., Åslund F., Holmgren A. Rat and calf thioredoxin reductase are homologous to glutathione reductase with a carboxyterminal elongation containing a conserved catalytically active penultimate selenocysteine residue. J. Biol. Chem. 1998;273:8581–8591. doi: 10.1074/jbc.273.15.8581. [DOI] [PubMed] [Google Scholar]
Associated Data
This section collects any data citations, data availability statements, or supplementary materials included in this article.
Supplementary Materials
C2C12 cells were transfected with 1 μg MitoGFP plasmid and 48 hr later assessed. At the 3-s mark on the video vehicle control 0.1% EtOH was added and incubated for a further 15 min. Scale bar, 10 μm. The video is shown at 5 frames per second and each frame is 30 s apart in real time.
C2C12 cells were transfected with 1 μg MitoGFP plasmid and 48 hr later assessed. At the 3-s mark on the video vehicle 5 μM TPMP was added and incubated for a further 15 min. Scale bar, 10 μm. The video is shown at 5 frames per second and each frame is 30 s apart in real time.
C2C12 cells were transfected with 1 μg MitoGFP plasmid and 48 hr later assessed. At the 3-s mark on the video vehicle 5 μM MitoCDNB was added and incubated for a further 15 min. Scale bar, 10 μm. The video is shown at 5 frames per second and each frame is 30 s apart in real time.
Data Availability Statement
The accession number for RNASeq data reported in this paper is PubMed GEO: GSE117425. Methods to obtain the data are explained above.