Abstract
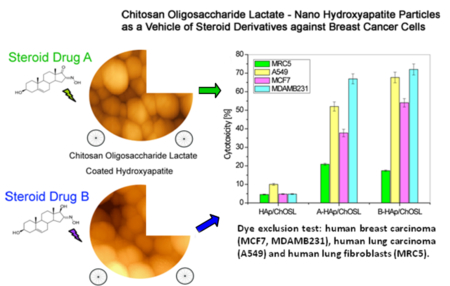
Low targeting efficiency and fast metabolism of antineoplastic drugs are hindrances to effective chemotherapies and there is an ongoing search for better drugs, but also better carriers. Steroid derivatives, 3β-hydroxy-16-hydroxymino-androst-5-en-17-one (A) and 3β,17β-dihydroxy-16-hydroxymino-androst-5-ene (B) as cancer growth inhibitors were chemically synthesized and captured in a carrier composed of hydroxyapatite (HAp) nanoparticles coated with chitosan oligosaccharide lactate (ChOLS). The only difference between the two derivatives is that A has a carbonyl group at the C17 position of the five-membered ring and B has a hydroxyl. This small difference in the structure resulted not only in different physicochemical properties of the A- and B-loaded HAp/ChOSL, but also in different biological activities. The morphology of drug-loaded HAp/ChOSL particles was spherical, but the size depended on the drug identity: d50=138 nm for A-loaded HAp/ChOSL and d50=223 nm for B-loaded HAp/ChOSL. Cell-selective toxicity was tested against human breast carcinoma (MCF7 and MDA-MB-231), human lung carcinoma (A549) and human lung fibroblasts (MRC-5). The small selectivity of pure derivatives A and B toward breast cancer cells became drastically increased when they were delivered using HAp/ChOSL particles. Whereas the ratio of the cytotoxicity imposed onto breast cancer cells and the cytotoxicity imposed onto healthy MRC-5 fibroblasts ranged from 1.5 to 1.7 for pure A and from 1.5 to 2.3 for pure derivative B depending on the concentration, it increased to 5.4 for A-loaded HAp/ChOSL and 5.1 for B-loaded HAp/ChOSL. FACS analysis demonstrated poor uptake of HAp/ChOSL particles by MCF7 cells, suggesting that the drug release occurs extracellularly. The augmented activity of the drugs was most likely due to sustained release, although the favorable positive charge of the carrier, allowing it to adhere to the negatively charged plasma membrane and release the drugs steadily and directly to the hydrophobic cell membrane milieu, was delineated as a possible complementary mechanism.
Graphical Abstract:
Introduction
Calcium phosphates (CP) were discovered in 17691, almost 250 years ago, yet today they still present a major research challenge to many research groups around the world.2 Synthetic hydroxyapatite (HAp), similar in structure to human bone CP, has seen a variety of applications in bone tissue engineering due to its excellent biocompatibility.3 In addition to its use in reconstructive medicine, HAp has increasingly been used as an agent for various therapeutic approaches, including chemotherapy, gene therapy, hyperthermia therapy, photodynamic therapy, radiation therapy, or combination therapy, and even imaging-guided therapy.4 Synthesis and design of nanoparticulate HAp for use in medicine and pharmacy as a carrier of various drugs and genes is a special field of research.5 Recent studies have shown that rod-shaped HAp nanoparticles can produce a specific cytotoxic response in lung cancer cells and inhibit their proliferation.6 Functional systems based on HAp and polymers allow for the tailoring of various physicochemical properties of the materials and thus for their more specific and personalized applications in medicine.7,8 Biocompatible and bioresorbable polymers capable of entrapping drugs of various sizes and hydrophobicity have been used to coat nano-HAp and create multifunctional systems suitable for reconstruction of bone defects with simultaneous controlled drug delivery. 9–12
Chitins are polysaccharides found in the exoskeleton of certain marine crustaceans such as crabs, shrimps, etc. Due to their biocompatible, antimicrobial, nontoxic and antitumor properties, they are suitable for use in medicine and pharmacy.13 Chitosan (Ch) is obtained by deacetylation of chitin in a process that is indispensably incomplete.14 In our earlier research we fabricated particles composed of nano-HAp coated with either chitosan or Ch-PLGA polymer blend (HAp/Ch, HAp/Ch-PLGA) suitable as drug carriers for intravenous administration.15 After injection into a blood vessel, HAp/Ch particles accumulated in the spleen and liver, while HAp/Ch-PLGA particles accumulated in the lung.16 Following reconstruction of bone defects with HAp/Ch and HAp/Ch-PLGA particle systems, their antimicrobial and osteoconductive properties were confirmed, along with regeneration of boney tissues.17 Nanocarriers based on PLGA and Ch have been assessed as promising in the delivery of various antitumor drugs, as well as for straightaway use in the clinical practice.18 Composite particles made of Ch and PLGA combine the properties of these two sole polymers, which can contribute to improved encapsulation and efficacy of encapsulated anticancer drugs.19 Core-shell particles comprising Ch shells and PLGA cores were found to be suitable for dual drug-loading, as in the cases where simple mixing of two drugs without a carrier in combination therapies is ineffectual because of a disparity in solubility or pharmacokinetic half-lives. This type of core-shell particles can potentially be used as nanovehicles that allow for a simultaneous chemotherapy and radiation sensitization in lung cancer treatments.20
Shorter derivatives of chitosan, chitosan oligosaccharides (ChOS) generally have inert or anti-inflammatory properties and in certain biological interactions can have more favorable properties than Ch.21,22 ChOS has shown a high potential for use in a variety of biomedical therapies, including immunostimulation, antitumor, anti-obesity, anti-hypertension, anti-Alzheimer’s disease, tissue regeneration promotion, drug and DNA delivery enhancement, antimicrobial, anti-oxidation and calcium-absorption enhancement.21,23 By coating and functionalizing the surface of the Pd particle with ChOS with the aid of surface amines and hydroxyl groups of the polymer, a system for active targeting of breast cancer cells was obtained with a high percentage of cellular uptake.24 In order to reduce the toxic effects and enable specific targeting of lung tumor cells, core-shell layer-by-layer particle systems have been designed, containing calcium phosphate and chitosan oligosaccharide lactate (ChOSL) in which cisplatin was incorporated.25 Carriers based on chitosan grafted with oligo(lactic acid) were also effective as transdermal drug delivery systems.26
A wide range of synthetic steroidal heterocyclic derivatives with five- and six-membered rings have been found feasible for use in the treatment of hormone-dependent cancers. Synthesized from medicinal plants, these heterocyclic derivatives proved to be promising compounds for stopping the uncontrolled proliferation of cancerous cells.27 The molecular mechanism of the anticancer activity of this group of derivatives is mainly based on the inhibition of the aromatase and sulfatase enzymes.28 An androstan derivative with a six-membered ring and a five-membered ring (3-pyridinyl; androsta-5,16-dien-3β-ol acetate) is metabolized into products that have enabled fine tuning of a prostate cancer therapy during clinical trials.29 Recent research pointed at the antiproliferative potential of modified D-homo lactone androstane derivatives synthesized in our laboratory.30,31 HAp/Ch-PLGA particles loaded with an androstane-based cancer inhibitor (17β-hydroxy-17α-picolyl-androst-5-ene-3β-yl-acetate) also showed high anticancer activity towards lung cancer cells with a simultaneously low toxicity towards healthy cells.32
In this study we report on the synthesis and characterization of spherical particles of a hybrid system made of nano-HAp particles coated with chitosan oligosaccharide lactate (ChOSL) and loaded with two different, but similar androstane derivatives: 3β-hydroxy-16-hydroxymino-androst-5-ene-17-one (A), C19H27NO3, and 3β, 17β-dihydroxy-16-hydroxymino-androst-5-ene (B), C19H29NO3. The difference between A and B is that at the C17 position of the five-membered cyclic ring, A has a carbonyl group (> C = O), whereas B has an -OH group (C-17β configuration). Correlation between the chemical structure and biological efficiency of the derivatives, which is significant for their selective action, has not been fully investigated in the literature.21 The results of such studies would contribute to the said field. Here we first used 1H and 13C NMR to determine the structure of the synthesized derivatives A and B, while the content of the derivatives in the HAp/ChOSL particles was determined directly using differential scanning calorimetry (DSC). Particle morphology was analyzed by atomic force microscope (AFM) and the drug loading process was analyzed by simultaneous thermogravimetric/differential thermal analyses (TG−DTA). Electrokinetic particle parameters as potential indicators of the activity at the interface between the double charge layer and the biological environment were determined by measuring ξ-potential, electrophoretic mobility and conductivity. The selective viability effect of the androstane-based cancer inhibitors A and B and hybrid particles encapsulating them was examined using dye exclusion (DET) and MTT assays on the following cell lines: human breast carcinoma (MCF-7, MDA-MB-231), human lung carcinoma (A549) and human lung fibroblasts (MRC-5).
Experimental
Synthesis of 3β-hydroxy-16-hydroxymino-androst-5-en-17-on and 3β,17β-dihydroxy-16-hydroxymino-androst-5-en -loaded HAp/ChOL
Synthesis of 3β-hydroxy-16-hydroxymino-androst-5-en-17-on (A), C19H27NO3 and 3β,17β-dihydroxy-16-hydroxymino-androst-5-en (B), C19H29NO3
Mixture of dehydroepiandrosterone (1.00 g, 3.47 mmol), potassium tert-butoxide (0.88 g, 7.84 mmol) and freshly prepared i-amyl nitrite (1.1 mL, 8.07 mmol) in tert-butanol was stirred at room temperature for 24 h. When the reaction was complete, the mixture was poured into water (100 mL). Acidification with HCl (1:1) to pH 6 gave 1.06 g of white powder (99%) of compound A. Reduction of compound B (1.06 g, 3.34 mmol) was conducted in 95% ethanol (60 mL) with sodium borohydride (0.26 g, 6.87 mmol). Reaction mixture was stirred at room temperature for 90 min. When the reaction was complete, the mixture was poured into water (150 mL), acidified with HCl (1:1) to pH 5 and the pure white powder of compound B (0.93 g, 86%) were obtained.
Synthesis of HAp and A(B) loaded HAp/ChOSL
An aqueous calcium nitrate (Ca(NO3)2) solution (150 ml; 26.6 wt.%) was added to the solution of ammonium phosphate ((NH4)3PO4) (7 ml H3PO4+165 ml NH4OH+228 ml H2O) at 50°C over the period of 60 minutes, while stirring at the rate of 100 rpm. The solution was then subjected to a heat treatment at 100°C for 60 minutes. The resulting gel was dried at room temperature in a vacuum drier for 72 h, after which the final product - HAp powder - was obtained. X-ray diffraction run on the HAp powder confirmed its poorly crystalline nature, whereas the PSD technique enabled us to determine the particle size of d50=65 nm.9
Chitosan oligosaccharide lactate, (ChOSL), (C12H24N2O9)n, (Sigma-Aldrich, Mn=4,000 – 6,000, deacetylation>90%), dissolved in acetic acid (1 wt.%), was mixed with C19H27NO3 (A) or C19H29NO3 (B) and HAp in the weight ratio of HAp:ChOL:A(B)=5:4:1, while stirring with a magnetic stirrer at 400 rpm. The obtained mixture of A (or B), ChOL and HAp was slowly poured into a sodium citrate solution (0.1 wt.% in H2O) while stirring at 21,000 rpm for 30 min. A water solution of poloxamer 188 (polyethylenepolypropylene glycol, 0.1vol.%) was added dropwise to the resulting mixture, while stirring at 21,000 rpm. The obtained mixture was then centrifuged at 3000 rpm and 5°C for 1 h, and the resulting precipitate was subjected to lyophilization at temperatures ranging from −10 to −60°C and pressures ranging from 0.37 mbar to 0.1 mbar for 1 to 8 h.26 The obtained powder was washed with distilled water three times, centrifuged at 1000 rpm and dried again. The final product was the powder composed of HAp particles coated with A(or B)-loaded chitosan oligosaccharide lactate (A(or B)-HAp/ChOSL).
Characterization of the products
NMR spectra were recorded on a Bruker AVANCE III HD 400 spectrometer operated at 400 MHz (1H) and 100 MHz (13C), and residual solvent signals were used for the chemical shift (ppm; δ-scale) calibration. Infrared spectroscopy (FT-IR) was done on a Nicolet iS10 FT-IR Spectrometer (Thermo Scientific Instruments) in the spectral range from 400 to 4000 cm−1. Differential scanning calorimetry (DSC) measurements were performed on an Evo 131 (Setaram Instrumentation) differential scanning calorimeter. Samples containing 5 mg were analyzed in nitrogen by heating (10°C/min) from 25°C to 360°C. Thermal analyses were simultaneously performed using a Thermo-Gravimetric Analysis/Differential-Thermal Analysis (TGA/DTA), SETSYS 2400 CS Evolution (Setaram Instrumentation) coupled to a mass spectrometric (MS) gas analysis system (Omni Star, Pfeiffer). Samples containing about 10 mg were analyzed in air by heating (10°C/min) from 28°C to 600°C. Quantitative analysis of the content of A and B in A/B-HAp/ChOSL was performed on an Ultimate 3000 HPLC device equipped with a DAD (Thermo Fisher Scientific, Woltham, USA). The separation was carried out in a XBridge C18 column (100 mm × 4.6 mm, 3.5 μm) from Waters (Milford, USA). The mobile phase was composed of water and the organic solvent (methanol for A and acetonitrile for B). The detection of products was carried out on a UV detector at 230 nm. The HPLC analysis was done in triplicates. Electrokinetic parameters of the aqueous suspensions of synthesized particles were analyzed using a Zeta-Sizer Nano (Malvern Instruments Ltd.) in deionized water and pH 7.0. The particle size distribution (PSD) was measured on 10 mg/ml of powders dispersed in water using a Mastersizer 2000 (Malvern Instruments Ltd.) and a HydroS dispersion unit for liquid dispersants. Microstructural characterization was performed using an atomic force microscope (AFM, Thermo Microscopes, Autoprobe CP Research).
Drug Release
The release rate of steroids A and B in vitro in phosphate buffered saline (PBS) at 37 ° C and in the presence of 0.1 wt.% sodium lauryl sulfate (SLS) was studied using HPLC technique. To estimate the concentration of the released steroids (A and B) at different time points, 50 mg of A-HAp/ChOSL and B-HAp/ChOSL were suspended in 50 ml PBS and aliquoted solutions were analyzed in triplicates on an Ultimate 3000 HPLC equipped with a DAD (Thermo Fisher Scientific, Woltham, USA). The separation was carried out in a XBridge C18 column (100 mm × 4.6 mm, 3.5 μm) from Waters (Milford, USA). The mobile phase was composed of water and the organic solvent (methanol for A and acetonitrile for B). The analysis was conducted by gradient elution in the following way: 0–5 min 20 % of the organic solvent, 5–25 min 20–100% gradient of the organic solvent. A flow rate of 0.5 ml/min was used and the column temperature was kept at 30 ° C. The detection of A and B was carried out using a UV detector at 230 nm. Concentrations of steroids A and B in PBS were calculated using the following equation: CA (B)(%)=[(Asteroid × Vstandard × Cstandard)/(Astandard × Vsteroid × Csteroid)] × 100, where Asteroid and Astandard (mAU*min) is the area of the released steroid in HPLC chromatograms, Vsteroid and Vstandard are injection volumes of steroid and standard (100%, pure steroid) solutions, respectively, and Csteroid and Cstandard are concentrations of steroid and standard solutions, respectively.
Biological assays
Cell lines and cultures
Study of particle cytotoxicity was carried out on four cell lines: human breast carcinoma ER + (MCF-7 ATCC HTB-22), human breast carcinoma ER- (MDA-MB-231 ATCC HTB-26), human lung carcinoma (A549 ATCC CCL 185) and human lung fibroblasts (MRC-5 ATCC CCL 171). All cells grew attached to the plate (Costar, 25 ml) in Dulbecco’s modified Eagle’s medium (DMEM, Sigma) with 4.5g/l glucose and 10% FCS (fetal calf serum, Sigma). The medium contained an antibiotic/antimycotic solution (Sigma). The cell lines were maintained under standard conditions: at a temperature of 37°C in a humidity saturated atmosphere with 5% CO2 (Heraeus). Cells were passaged twice a week, and in the experiments the cells were used in the logarithmic growth phase between the third and the tenth passage. Only viable cells were used. The number of cells and their viability were determined by the dye exclusion test with 0.1% trypan blue.
Substances tested and the treatment
Cells were harvested in the logarithmic growth stage, precipitated by centrifugation (10 min/200 × g) and counted in 0.1% trypan blue. Particles were compressed into discs and placed at the bottom of Petri dishes (Center well, Falcon) seeded with viable cells. Each disc contained 50 mg of the powder and was immersed in 5 ml of cell culture media. The control samples did not contain any particles. The Petri dishes with seeded cells were left in a thermostat at 37°C, with 5% CO2 for 48h.
DET - Dye exclusion test
After the incubation, the cells were separated from particles by tripsinization (adding 0.1% solution of tripsin). The cell number and viability were measured using a trypan blue dye exclusion test (DET). Exponentially growing cells were harvested and counted by DET. Cell counting was performed following the incubation, using an inverted microscope (REICHERT) in counting chambers. Viability was calculated as V = (Nv/Nt) × 100, where Nv is the number of viable cells, and Nt is the total number of cells in the sample. The wells containing cells without tested substances were used as control. Cytotoxicity (CI) obtained in the DET was expressed as a percentage according to the formula: CI = (1-Ns/Nk) × 100, where Nk is the number of cells in the control sample, and Ns is the number of cells in the sample with the tested substance.
MTT - Colorimetric Test with Tetrazolium Salt
After the DET, cytotoxicity was investigated from the aspect of cell recovery using the MTT assay. The viable cells were seeded (5×10³/100μl) in quadruplicate in 96-well microtiter plates. The plates with seeded cells were left in a thermostat at 370C, with 5% CO2 for 48h and 72h. Freshly prepared MTT solution was added to the wells at 10 μl/well and incubation was continued for 3 hours (in a 370C thermostat with 5% CO2). After 3h, 100 μl of 0.04 mol/l HCl in isopropanol was added to each well. Absorbance was read immediately after the incubation period on the microtiter plate reader (Multiscan Ascent, Thermo Labsystems) at the wavelength of 540 nm and a reference of 690 nm. The wells containing only the medium and MTT, but not the cells, were used as a blank.33 Cytotoxicity (CI) was expressed as a percentage according to the formula: CI = (1-As/Ak) × 100, where Ak is the absorbance of the control sample, and As is the absorbance of the samples with the tested particles.
Fluorescent cell imaging
MCF-7 cells were fixed and stained for nuclei, f-actin filaments and HAp/ChOSL, A-HAp/ChOSL and B-HAp/ChOSL particles 24 hours after adding the particles to the culture at the concentration of 5 mg/ml. Cells were fixed for 5 minutes in 4 % paraformaldehyde (PFA) and washed 3 × 10 min in PBS, then blocked at room temperature for 1 h in the blocking solution (2 % bovine serum albumin, 0.5 % Triton-X in PBS), washed 3 × 10 min with PBS again and stained with Alexa Fluor 568 phalloidin (1:400) and NucBlue® Fixed Cell ReadyProbes™ reagent (Molecular Probes, Life Technologies) for 1 hour at room temperature. HAp/ChOSL particles exhibited intrinsic fluorescence and needed not be stained with a dye. After the incubation, the cells were washed 3 × 5 min with PBS and mounted using Prolong Diamond mounting media (Life Technologies). Images were acquired on a Nikon T1-S/L100 inverted epifluorescent confocal microscope. All the samples were analyzed in triplicates.
Flow cytometry
In addition to fluorescent cell staining, the uptake of pure and drug-loaded HAp/ChOSL particles by MCF-7 cells was analyzed using fluorescence activated cell sorting (FACS, Becton Dickinson FACSVerse). MCF-7 cells were grown to confluency in aforementioned growth conditions in 24 well plates before 5 mg/ml of the nanoparticles were added to them. After 24 h incubation at 37 ° C, the cells were rinsed with PBS and trypsinized using 0.25 % trypsin-ethylenediaminetetraacetic acid (EDTA). The cells that had uptaken the nanoparticles were sorted from the untreated, control cells based on changes in the increased side scatter (SSC) indicative of increased granularity in the cells due to intracellular localization of nanoparticles uptaken by the cells. All the samples were analyzed in triplicates.
Results and discussion
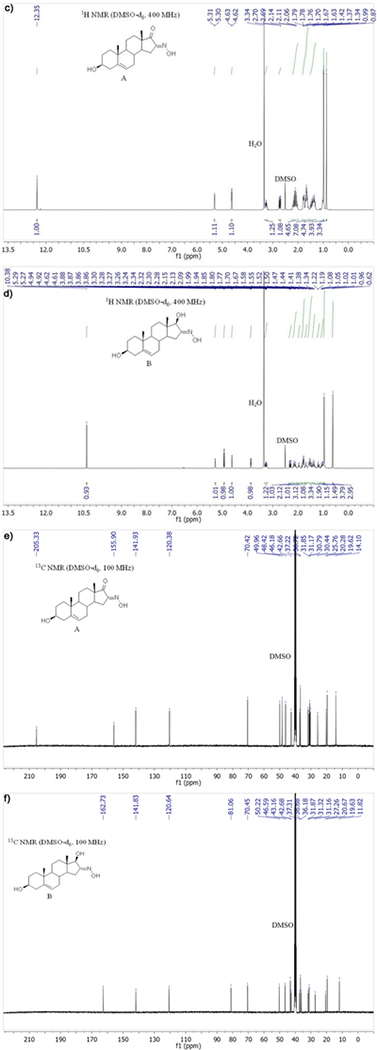
Figure 1 shows the structures (Figs. 1a, b) and 1H, 13C spectra of compounds A and B. Compound A (Fig. 1c): 1H NMR (DMSO-d6, δ, ppm): 0.87 (s, 3H, H-18), 0.99 (s, 3H, H-19), 2.72 (dd, J = 17.3, 6.8 Hz, 1H, H-15), 3.26 (ddd, J = 15.2, 10.2, 5.1 Hz, 1H, H-3), 4.63 (d, J = 4.4 Hz, 1H, 3β-OH), 5.31 (d, J = 4.8 Hz, 1H, H-6), 12.35 (s, 1H, NOH). 13C NMR (DMSO-d6, δ, ppm): 14.10 (C-18), 19.62 (C-19), 20.28, 25.76, 30.44, 30.79, 31.17, 31.85, 36.72, 37.22, 42.66, 46.18, 48.42, 49.96, 70.42 (C-3), 120.38 (C-6), 141.93 (C-5), 155.90 (C-16), 205.33 (C-17).
Figure 1.
Structures and 1H, 13C spectra of compounds A and B: a) structure of A, b) structure of B, c) 1H NMR of A, d) 1H NMR of B, e) 13C NMR of A, f) 13C NMR of B
Compound B (Fig. 1d): 1H NMR (DMSO-d6, δ, ppm): 0.62 (s, 3H, H-18), 0.96 (s, 4H, H-19), 2.31 (dd, J = 17.8, 7.4 Hz, 1H, H-15), 3.27 (ddd, J = 15.6, 10.8, 4.7 Hz, 1H, H-3), 3.87 (dd, J = 5.7, 1.9 Hz, 1H, H-17), 4.62 (d, J = 4.5 Hz, 1H, 3β-OH), 4.93 (d, J = 5.8 Hz, 1H, 17β-OH), 5.28 (d, J = 5.0 Hz, 1H, H-6), 10.38 (s, 1H, NOH). 13C NMR (DMSO-d6, δ, ppm): 11.82 (C-18), 19.63 (C-19), 20.67, 27.26, 31.16, 31.32, 31.87, 36.18, 36.68, 37.31, 42.68, 43.16, 46.59, 50.22, 70.45 (C-3), 81.06 (C-17), 120.64 (C-6), 141.83 (C-5), 162.73 (C-16).
Dehydroepiandrosterone was converted into the corresponding 16-oximino derivative (A, Fig 1a). In the earlier synthetic procedure, potassium tert-butoxide was obtained in the reaction of potassium with tert-butanol.34 Commercially available potassium tert-butoxide was used here instead. Structure A was confirmed in the 1H (Fig. 1c) and 13C NMR spectral analysis (Fig. 1e). In these spectra, the key signals for structure determination were the oximino proton singlet at 12.35 ppm and the carbonyl C-16 signal at 155.90 ppm. Compound B (Fig. 1b) was obtained by the reduction of C-17 carbonyl group of compound A. Structure B was confirmed by the 17β-OH proton signal at 4.93 ppm and the oximino proton singlet at 10.38 ppm in the 1H NMR spectrum (Fig. 1d) and the signal of C17 in the 13C NMR spectrum (Fig. 1f), which is shifted up field compared to the same proton of compound A (δ 205.33 for A1 → 81.06 for B).
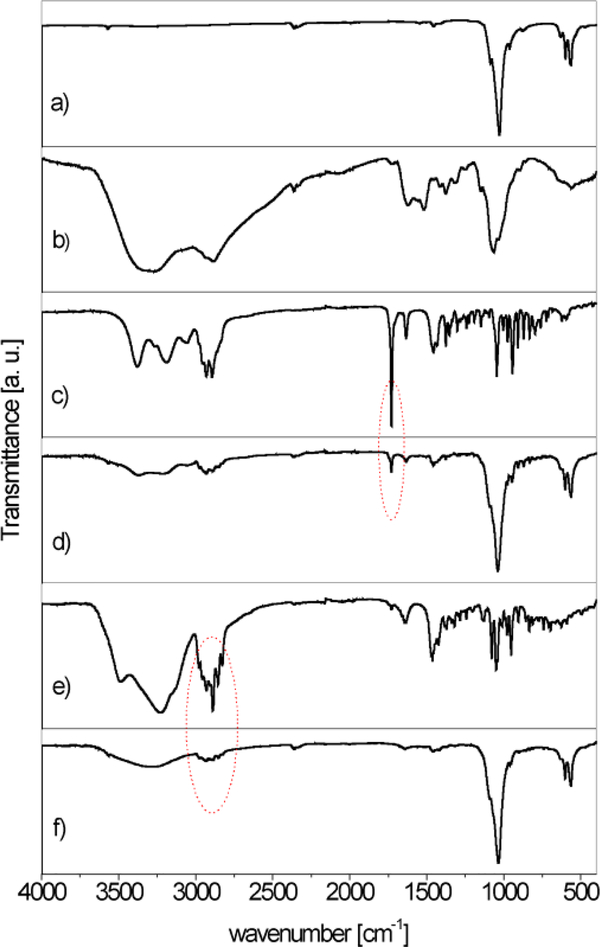
Figure 2 shows the IR spectra of HAp, ChOSL, A, A loaded HAp/ChOSL, B and B loaded HAp/ChOSL. The characteristic bands at about 1030 cm−1 and 1080 cm−1 could be assigned to the triply degenerated asymmetric stretching vibration mode (ν3) of the PO43- group of HAp and the band at 3560 cm−1 to the stretching vibration of the OH− group (Figure 2a). The absorption band at about 563 cm−1 was assigned to the triply degenerated bending mode (ν4) of the PO43- group.35,36 Vibration of the hydroxyl group characteristic of ChOSL, detected at ∼ 3650 cm−1 (Figure 2b), has been confirmed by other authors.37 C-H symmetric stretching vibrations of CH2 at about 2880 cm−1 as well as C-O-C stretching vibrations at about 1070 cm−1 are clearly visible too.38 Vibrations at roughly 1560 and 1400 cm−1, characteristic for the amide groups of ChOSL, were also recorded.37 The most pronounced, sharp band in the spectrum of derivative A (Figure 2c) at 1731 cm −1 originates from the vibration of the C17 carbonyl group. In the spectrum of A-loaded HAp/ChOSL (Fig. 2d), the characteristic bands of derivative A are observed in addition to those of HAp and ChOSL. A characteristic series of several sharp bands in the spectrum of derivative B (Figure 2e) at 2934, 2891 and 2853 cm−1 is attributed to C-H vibrations from the steroid skeleton. These bands are also present in the B-HAp/ChOSL spectrum (Figure 2f) in addition to the characteristic bands of HAp and ChOLS. The presence of the characteristic bands of pure derivatives A and B (Figs 2c, e) in A-HAp/ChOSL and B-HAp/ChOSL systems (Figs 2d, f), respectively, could indicate that derivatives A and B during the synthesis procedure were entrapped in the ChOSL polymer.
Figure 2.
ATR FTIR spectra of: a) HAp, b) ChOSL, c)A, d) A-loaded HAp/ChOSL, e) B and f) B-loaded HAp/ChOSL.
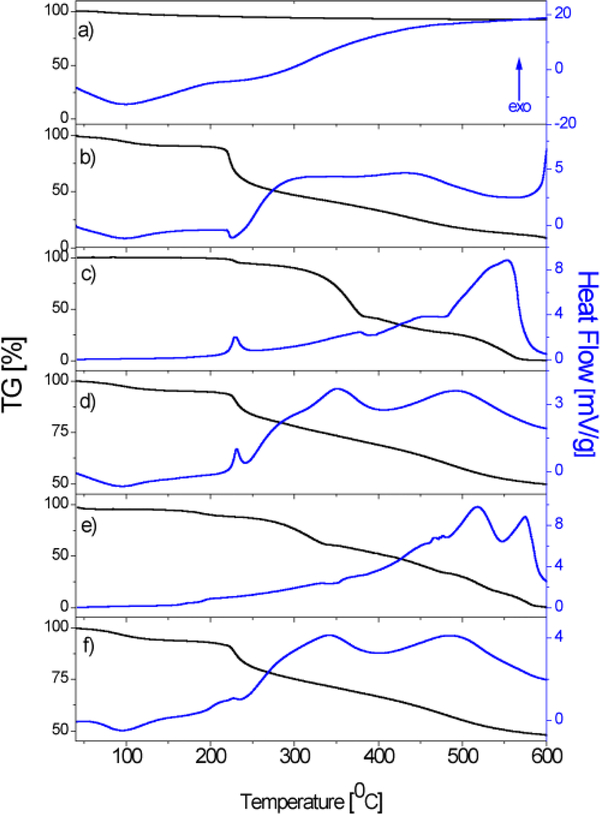
The results of the TG-DT analyses of HAp, ChOSL, A, A-HAp/ChOSL, B and B-HAp/ChOSL in the 30–600°C temperature range are shown in Fig. 3. The TGA curve of HAp showed a residue of 93±0.5% at 600°C (Figure 3a). At the same temperature (600°C), the residue originating from ChOSL was only 8±0.5% (Figure 3b). The moderate weight loss of the derivatives and derivative loaded particles (Fig. 3c, d, e, f) up to about 220°C is associated with the loss of adsorbed water. The TGA curves of A (Fig. 3c) and B (Fig. 3e) show complete degradation at 600°C (100% mass loss). Albeit similar in structure (Figs 1a, d), derivatives A and B behaved differently in the thermal degradation mode (Figs 3c, e). Namely, derivative A achieved the weight loss of 50% at the temperature of 372°C, as opposed to derivative B, whose weight loss of 50% was recorded at 412°C. The complete thermal decomposition of derivative A (Figure 3c) was marked by a broad exothermic peak of the DTA curve in the 480–590°C range. Decomposition of derivative B (Figure 3e) was, in contrast, marked by two exothermic peaks in the 480–540°C and 540–590°C intervals, which could indicate a vastly different mechanism of thermal degradation caused by the rather small difference in the structure. A wide exothermic peak in the 250–400°C interval was the signature one in the DTA curves of both A-HAp/ChOSL and B-HAp/ChOSL (Figs 3d, f) and it originated from the thermal degradation of ChOSL. It could be assumed that as the temperature increases, interactions occur between the oligosaccharide fragments, leading to formation of new molecules, especially at higher temperatures.39 The TGA curves for both A-HAp/ChOLS and B-HAp/ChOLS determined a residue of 49.0±0.5% at 600°C. Based on the amount of this residue, the fraction of HAp (experimental sections; HAp: ChOSL:A or B = 5:4:1) in the composite systems, equal to 50 wt.%, was confirmed in both of the drug-loaded systems [HAp(50wt.%x0.93)+ChOLS(40wt.%x0.08)+(A or B)(10wt.%x0)=49.7wt.%≅49.0±0.5%].
Figure 3.
TGA/DTA diagrams of a) HAp, b) ChOSL, c) A, d) A-loaded HAp/ChOSL, e) B and f) B-loaded HAp/ChOSL.
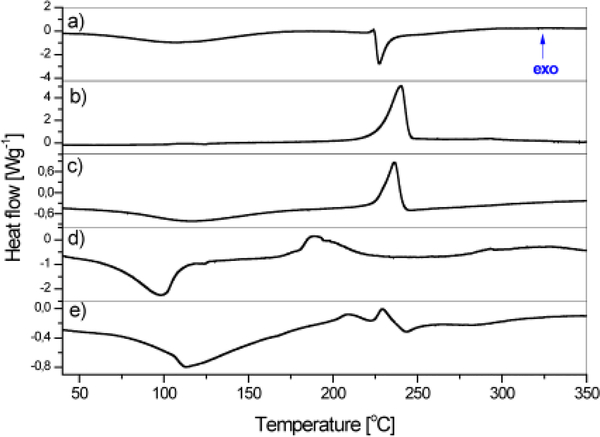
The DSC thermograms of ChOSL, A, A-HAp/ChOSL, B and B-HAp/ChOSL are shown in Figure 4. The wide endothermic peak centered at 107 ° C originates from the loss of water and represents the energy needed for the water to evaporate.40 The endothermic phase transition dominates the DSC thermogram of ChOSL with a sharp peak centered at 227.4°C (Figure 4a), originating from the melting of ChOSL with the collapse of its structure.41 The sharp exothermic peak centered at 240.5°C dominates the DSC thermogram of derivative A (Fig. 4b) and is also observed on the DSC thermogram of A-HAp/ChOSL, albeit centered at 236.3 ° C. This shift to a lower temperature can be attributed to the formation of hydrogen bonds between ChOSL and the drug42, in this case derivative A, which makes the derivative more susceptible to heat. The DSC thermogram of derivative B (Figure 4c), alongside the wide endothermic peak centered at 95°C (onset: 72 ° C, offset: 104 ° C), features a complex exothermic phase transition centered at 189 ° C. The exothermic phase transition of derivative B centered at 202 ° C is also recognized in the DSC thermogram of B-HAp/ChOSL (Figure 4d). In the thermograms of A-HAp/ChOSL and B-HAp/ChOSL (Figs 4c, e), the melting endotherm of pure ChOSL (Figure 4a) is not present, which suggests that introducing HAp and the derivatives significantly improves the heat stability of ChOSL. Similar improvements in the thermal stability of chitosan derivatives upon the addition of inorganic components has been evidenced in DSC analyses by other authors too.41 Differential scanning calorimetry (DSC) is a technique suitable for the prediction of the drug loading efficiency of poorly water-soluble compounds in pharmaceutical preparations based on measuring phase transition enthalpy.43 Derivatives A and B belong to one such group of poorly water-soluble compounds. By integrating over the surface of the exothermic peaks of the characteristic phase transitions of pure (100%) and encapsulated derivatives A and B, we obtained the enthalpy values (ΔH) shown in Table 1. By comparing the enthalpies of pure and encapsulated derivatives A and B, the content of the encapsulated derivative A in A-HAp/ChOSL and B in B-HAp/ChOSL was derived and it equaled is 8.9±0.1wt.% and 9.0±0.1wt.%, respectively.
Figure 4.
DSC thermograms of: a) ChOSL, b) A, c) A-loaded HAp/ChOSL, d) B and e) B-loaded HAp/ChOSL.
Table 1.
Enthalpies and the content of A and B in the drug-loaded HAp/ChOSL according to the DSC results. Results are presented as means ± standard deviation (SD).
| Name | Enthalpy, ΔH of encapsulated A/B [Jg−1] | The content of the encapsulated A/B [wt.%] |
|---|---|---|
| A, pure | −447.2 | 100 |
| B, pure | −229.3 | 100 |
| A-HAp/ChOSL | −39.8±0.3 | 8.9±0.1 |
| B-HAp/ChOSL | −20.6±0.2 | 9.0±0.1 |
Steroids A and B were extracted from carriers using MeOH:CH2Cl2 (1:1). The content of A and B in A-HAp/ChOSL and B-HAp/ChOSL was also confirmed using HPLC. By comparing the areas of typical chromatogram peaks of pure and extracted steroids A (retention time 17 min) and B (retention time 27 min), the content of the encapsulated steroids A in A-HAp/ChOSL and B in B-HAp/ChOSL were derived and equalled 9.0±0.1 wt.% and 9.1±0.1 wt.%, respectively (mean ± SD), being in excellent agreement with the values obtained from DSC measurements.
Numerous factors influence the interactions between particles and the biological environment along the bio-nano interface44 and size, shape, surface chemistry, particle texture and topography are only some of them. Electrokinetic parameters are important not only in the prediction of particle-particle interactions, but also for the interaction of particles with the cell surface. Table 2 shows the values of ξ-potential and electrophoretic mobility of drug-free HAp/ChOSL, A-HAp/ChOSL and B-HAp/ChOSL particles and of the conductivity of their suspensions. Because of the partial protonation of C2 amino groups (pKa ~ 6.5) at the neutral pH, Ch and its derivatives carry a net positive charge under physiological conditions, explaining the positive ξ-potential value of 13.8 ± 0.82 mV for HAp/ChOLS and indirectly confirming that HAp is coated by ChOSL. By introducing a drug derivative into the HAp/ChOSL carrier, the value of ξ-potential changes from 13.8 ± 0.82 mV for the drug-free carrier to 30.3 ± 0.26 mV for A-HAp/ChOLS particles and 32.3 ± 0.67 mV for B-HAp/ChOSL particles. Both of the drug-loaded particles in suspension present ξ-potential values that exceed the stability threshold45 of 30 mV, suggesting that theirs are stable colloidal systems suitable for intravenous delivery. The electrophoretic mobility of the particles and the conductivity of the medium containing the dispersed particles reflect the somewhat higher ξ-potential values detected for B-HAp/ChOSL, being also higher for this system (Table 2) compared to A-HAp/ChOLS particles. Although this difference was small, it was still statistically significant (p < 0.01). It is conceivable that either the small difference in the dissociation of the two derivatives or the somewhat more electrophilic character of the C-17 carbonyl than the hydroxyl affects the content of the surface groups and, thus, the ionic makeup of the double charge layer, which is further being reflected in the different specific and nonspecific ion effects46 that govern the particle/cell interaction. There are indications that healthy cells have a different surface charge and ξ-potential compared to cancer cells47 and since the first step in the interaction of the particles and the cells occurs at the electrostatic level, the possibility that the two synthesized systems would interact differently with healthy and cancer cells or with cells in general cannot be discarded. These phenomena were investigated in in vitro tests.
Table 2.
Zeta potential, electrophoretic mobility and sol conductivity of HAp/ChOSL, A-HAp/ChOSL and B-HAp/ChOSL particles (ξ—zeta potential; μe—mobility; Λ-conductivity)
| Name | Temperature [°C] | ξ [mV] | ue [x10−8 m2V−1s−1] | Λ [mScm−1] |
|---|---|---|---|---|
| HAp/ChOSL | 25 | 13.80±0.82* | 1.10±0.01* | 0.050±0.002* |
| A-HAp/ChOSL | 25 | 30.30±0.26* | 2.40±0.04* | 0.460±0.011* |
| B-HAp/ChOSL | 25 | 32.30±0.67* | 2.50±0.05* | 0.550±0.014* |
SD
Molecular polar surface area (PSA), i.e., the portion of the molecular surface occupied by polar atoms, is a descriptor that allows the prediction of the drug transport properties. Topological PSA (TPSA) represents the sum of the surfaces of polar atoms and groups in the molecule.48 Based on the methodology detailed in the literature48, TPSA values were calculated for derivatives A and B, and these were A=69.89Å2 and B=73.05Å2, respectively. Based on the obtained results, it can be noticed that derivative B is little more polar (5%) than derivative A, so that a difference can be expected in the activity in the bio-nano interface with identical cells.
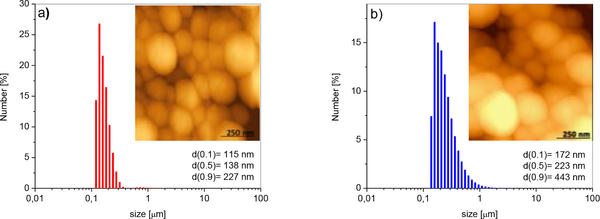
Hydrodynamic particle size distribution (PSD) histograms and surface morphologies of A-HAp/ChOSL and B-HAp/ChOSL particles analyzed using laser diffraction and AFM in the non-contact mode, respectively, are shown in Figure 5. A-HAp/ChOLS particles had a uniform distribution of sizes, with the d50 parameter being equal to 138 nm. The powder contained small portions of larger and smaller particles; correspondingly, d90=227 nm and d10=115 nm. B-HAp/ChOSL particles had the following distribution values: d10 =172 nm, d50=223 nm and d90=443 nm. A portion of larger particles (d90 = 443 nm) is the most likely the product of agglomeration, which can be seen in Fig. 5b. Overall, the given laser diffraction values indicate a larger particle size for B-loaded HAp/ChOSL than for A-loaded HAp/ChOSL (Figure 5b). Still, as evidenced by AFM analyses, both powders contained equally spherical particles. After coating HAp with the drug-loaded ChOSL, the particles were processed in a centrifugal field (21,000 rpm, experimental sections), implying that spherical morphologies were expected. In general, the processing of polymer systems in the centrifugal field leads to the formation of spherical morphologies of the processed particles.49
Figure 5.
PSD histograms and AFM images of a) A-loaded HAp/ChOSL and b) B-loaded HAp/ChOSL.
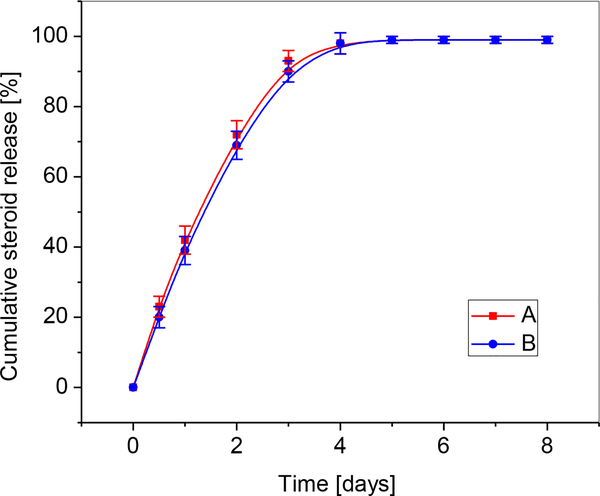
By comparing the areas of released steroids (A retention time of 17 min; B retention time of 27 min) in HPLC chromatograms, concentrations of the released derivatives were obtained. Figure 6 shows the percent cumulative release of A and B in PBS at 37 ° C under static conditions. During an 8-day period, the entire content of A and B was released from all the systems. The release followed a relatively linear, zero-order kinetic pattern for A and B during the first two days. Initially, after the first 24 h of degradation, 42% and 39% of A and B, respectively were released. Nearly complete release of the derivatives A and B, was registered after the third day, i.e. 93% and 90% of A and B, respectively.
Figure 6.
Comparative cumulative curves of the release of A and B in percents in PBS at 37 ° C over the degradation period.
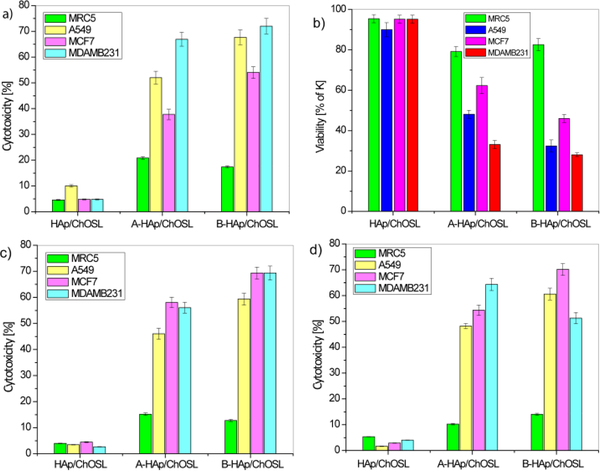
Figure 7 shows the cytotoxicity of healthy and breast cancer cells (MCF7 and MDA-MB-231), lung cancer cells (A549) and human fibroblasts (MRC-5) after incubation with drug free HAp/ChOLS, A-HAp/ChOLS and B-HAp/ChOLS, as measured in DET and MTT assays. The results of comparative DET testing of HAp/ChOLS, A-HAp/ChOLS and B-HAp/ChOLS particles for cytotoxicity towards MRC5, A549, MCF7 and MDA-MB-231 cells are shown in Figure 7a. Drug free HAp/ChOLS particles did not exhibit a significant cytotoxic effect (< 5 %) toward any one of the examined cell lines after 48 hours of incubation. Even at this low, practically negligible range of toxicities, the drug-free HAp/ChOLS particles were more viable to healthy MRC-5 cells than to cancerous A549. After 48 hours of action, B-HAp/ChOLS particles induced a greater cytotoxicity to all cancer cell lines tested in comparison with A-HAp/ChOLS. Thus, for example, B-HAp/ChOLS particles in the DET assay 48 h into the treatment (Figure 7b) maintained a high viability of healthy cells (95%), but reduced the viability of breast cancer cells (MDA-MB-231) down to 28%. The same trend was observed during the MTT test (Figure 7c). Three days (72 h) after a two-day treatment (48h) of the cells with the particles (Figure 7d), the trend observed with respect to healthy and cancer cells after shorter incubation/recovery periods still applied, suggesting prolonged effects exhibited by B-HAp/ChOLS particles, in this particularly against MCF-7 breast cancer cells. After the same time interval, a slight recovery of all other cells exposed to A-HAp/ChOLS particles was observed (Figure 7b), in particular the healthy MRC-5 cells. In general, however, A-HAp/ChOLS and B-HAp/ChOLS particles showed negligible inhibitory effects on healthy MRC-5 cells (Figure 7b). It is possible that the treatment results in the loss of the ability to use aerobic respiration due to mitochondrial defects in cancer cells, but not in healthy cells too.50 This phenomenon may also be one of the reasons for higher endurance of the treated healthy cells compared to the breast and lung cancer cells.
Figure 7.
Dye exclusion test (DET) and colorimetric tetrazolium salt (MTT) assay for different cell types challenged with HAp/ChOSL (drug-free), A-loaded HAp/ChOSL and B-loaded HAp/ChOSL particles: a) DET cytotoxicity @ 48h, b) DET viability @ 48h, c) MTT cytotoxicity @ 48 h + 48 h of recovery d) MTT cytotoxicity @ 48 h + 72 h of recovery.
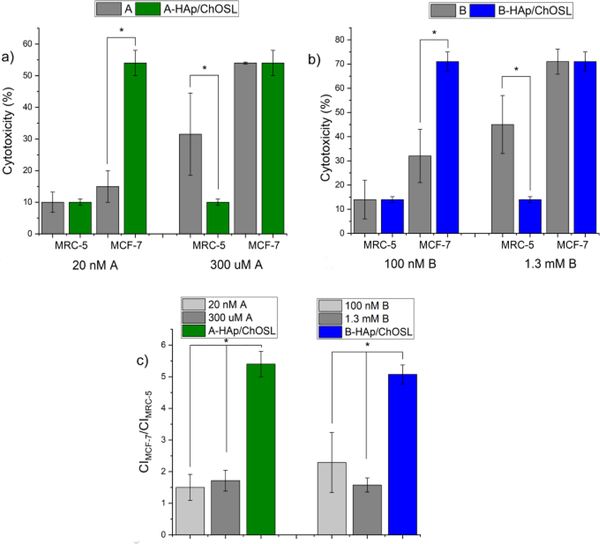
Fig.8 shows that the selective activity of the drug-loaded HAp/ChOSL particles is significantly higher than that of either A or B in their pure form. Specifically, at the dose of 20 nM of the pure derivative A, at which the cytotoxicity imposed on healthy MRC-5 cells by the pure drug equals that imposed by A-HAp/ChOSL particles, the cytotoxicity imposed onto breast cancer MCF-7 cells is significantly higher for A-HAp/ChOSL particles than for the pure derivative A: 54 vs. 15% (Fig. 8a). Similarly, at the dose of 300 uM of the pure derivative A, at which the cytotoxicity imposed on cancerous MCF-7 cells by the pure drug equals that imposed by A-HAp/ChOSL particles, the cytotoxicity imposed onto the healthy MRC-5 cells is significantly lower for A-HAp/ChOSL particles than for the pure derivative A: 10 vs. 31.5% (Fig.8a). The same trend is observed for the derivative B. Namely, at the dose of 100 nM of the pure derivative B, at which the cytotoxicity imposed on healthy MRC-5 cells by the pure drug equals that imposed by A-HAp/ChOSL particles, the cytotoxicity imposed onto breast cancer MCF-7 cells is significantly higher for B-HAp/ChOSL particles than for the pure derivative B: 71 vs. 32% (Fig. 8b). Similarly, at the dose of 1.3 mM of the pure derivative B, at which the cytotoxicity imposed on cancerous MCF-7 cells by the pure drug equals that imposed by B-HAp/ChOLS particles, the cytotoxicity imposed onto the healthy MRC-5 cells is significantly lower for B-HAp/ChOSL particles than for the pure derivative A: 14 vs. 45% (Fig. 8b). Consequently, the ratio of the cytotoxicity imposed onto cancerous MCF-7 cells to the cytotoxicity imposed onto healthy MRC-5 cells is significantly higher for both A- and B-loaded HAp/ChOSL than for the pure derivatives A and B (Fig.8c). These results indicate that the ability to selectively target breast cancer cells for destruction while leaving the healthy cells negligibly affected is due to the carrier and not the drug. As terminological clarification, by targeting here we primarily mean the ability of a carrier to affect the viability of one cell type (in this case, cancer cells) more than it affects the viability of another cell type (in this case, healthy cells), regardless of whether this involves a tighter physical interaction with the former cells, such as through ligand-receptor attraction, or a purely chemical effect, such as through greater susceptibility of the former cells to a chemical attack over the latter cells.
Figure 8.
Comparative cytotoxicity of healthy MRC-5 and breast cancer MCF-7 cells following 72 h incubation with different doses of pure derivatives A or B and A- or B-loaded HAp/ChOSL particles. (a) Cytotoxicity at 20 nM and 300 uM A compared to A-HAp/ChOSL. (b) Cytotoxicity at 100 nM and 1.3 mM B compared to B-HAp/ChOSL. (c) Ratio of the cytotoxicity imposed onto cancerous MCF-7 cells to the cytotoxicity imposed onto healthy MRC-5 cells by pure derivatives A or B compared to A-HAp/ChOSL and B-HAp/ChOSL.
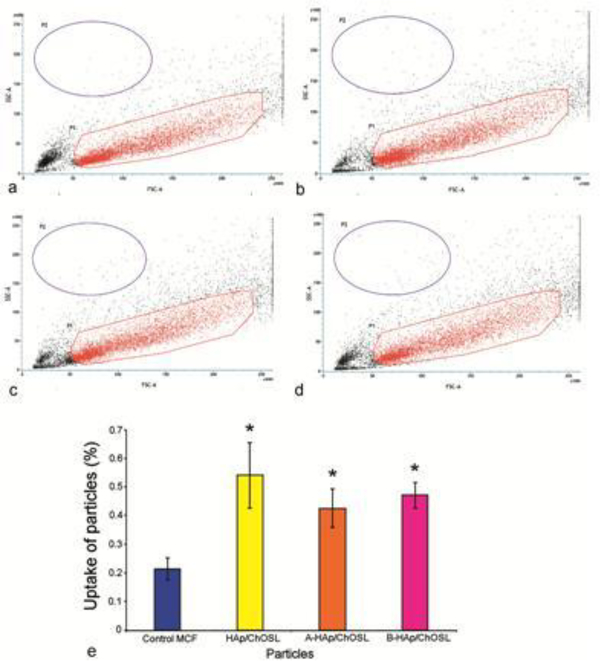
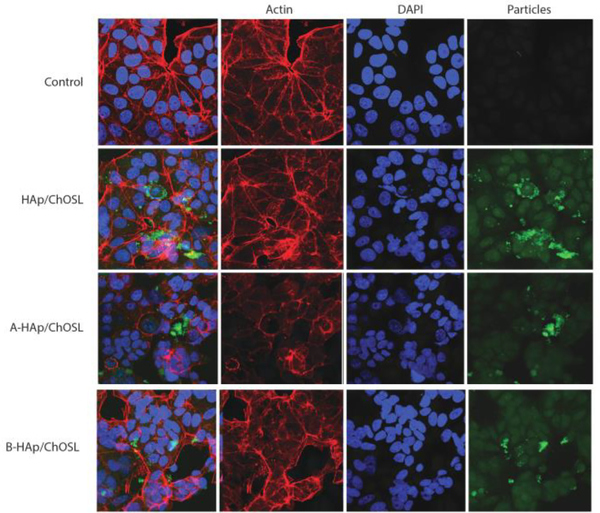
FACS studies have demonstrated that there was a negligible uptake of both drug-free and drug-loaded HAp/ChOSL particles by MCF7 breast cancer cells. The uptake was definitely present in the cells, as evidenced by the statistically significantly higher cell granularity in sample groups treated with HAp/ChOSL particles, be they drug-free or drug-loaded (Fig.10). However, less than 1% of cells in any given population uptook the particles. The pure, drug-free HAp/ChOSL particles were uptaken by the cells slightly more than the two drug-loaded HAp/ChOSL particle formulations, but the difference was not statistically significant. Since the viability of this same breast cancer cell line was affected by the particle treatment, which was mostly due to the derivatives A or B released by the particles, this has suggested that the drug release occurs extracellularly and that the particles do not assist the drug in crossing the plasma membrane. The particles, however, owing to their favorable positive charge, may still augment the activity of the drug by adhering tightly to the outer surface of the negatively charged plasma membrane. Fluorescent imaging of the interface between the MCF7 breast cancer cells and the drug-free and drug-loaded HAp/ChOSL particles has shown that there is indeed some level of interaction between the two entities. As seen in Fig. 9, the particles do co-localize to some degree with the cell boundaries, suggesting that the particles might be able to adhere to the cell membrane and release derivatives A and B directly in the vicinity of the cell membrane, thus helping it traverse the intrinsically unfavourable, hydrophilic milieu of the extracellular medium and be released straight into the favourable, hydrophobic cell membrane microenvironment. Another, more probable means by which the particles could augment the efficacy of the derivatives may be by sustained release, which would extend the half-life of the drug and prevent its rapid degradation upon administration as a bolus. In addition, as seen in Fig.9, control MCF7 cells display a characteristically wedged pattern of f-actin microfilaments, reflecting the orderly arrangement of the cells in planar monolayers of the 2D culture. This pattern is unchanged upon the treatment with drug-free HAp/ChOSL particles, but becomes severely disrupted upon the treatment with either A- or B-loaded HAp/ChOSL particles. In the drug-treated population, certain areas shows signs of disrupted cell organization, while others show more severe diminishments in the expression of cytoskeletal microfilaments (Fig. 9).
Figure 10.
FAC sorting of MCF7 breast cancer cells to determine the nanoparticle uptake based on increased granularity in cells, as represented by cell populations with an increased side scatter (SSC) profile. Parental MCF7 cell population with no particle uptake (a) and MCF7 cells treated with HAp/ChOSL (b), A- HAp/ChOSL (c) and B- HAp/ChOSL (d) particles showing two populations of cells, the parental control and one exhibiting granularity. (e) Percentage of cells uptaking HAp/ChOLS, A-HAp/ChOSL and B- HAp/ChOSL particles compared to the remaining population. Data points are shown as averages (n = 3) with error bars representing the standard deviation. Statistically significant difference (p < 0.05) compared to the untreated, control population is represented with an asterisk.
Figure 9.
Fluorescent optical micrographs of fluorescently stained MCF7 breast cancer cells (cytoskeletal f-actin - phalloidin; nucleus - DAPI) of the negative control and of cells incubated with HAp/ChOSL, A-HAp/ChOSL or B-HAp/ChOSL particles (green) following 24 h of incubation.
Summary
We previously demonstrated the feasibility of using spherical composite particles based on nano-HAp coated with chitosan-based polymers as a vehicle for parenteral administration of drugs. Here we report on the synthesis of a carrier composed of nanoparticulate hydroxyapatite (HAp) coated with chitosan oligosaccharide lactate (ChOSL). The composite particles were found to be suitable as a vehicle for the delivery of steroid derivatives 3β-hydroxy-16-hydroxymino-androst-5-ene-17-one (A) and 3β, 17β-dihydroxy −16-hydroxymino-androst-5-ene (B). The two heterocyclic derivatives contain three six-membered rings and one five-membered ring each and differ only in the fact that the derivative A has a carbonyl group (> C = O) at the C17 position of the five-membered ring in place an -OH group in the derivative B. 1H NMR and 13C NMR confirmed the correct chemical structure of the synthesized derivatives A and B introduced into the vehicles made of nano-HAp coated with ChOSL (HAp/ChOSL). We employed emulsification and, subsequently, lyophilization in the synthesis of HAp/ChOSL carriers loaded with derivatives A or B. Simultaneous FT-IR and TG-DT analyses confirmed that the drug loading was successful. Although the particles of both A-HAp/ChOSL and B-HAp/ChOSL adopted spherical morphologies, their sizes differed, equalling d50=138 nm and d50=223 nm, respectively, reiterating the significant changes in the particle properties resulting from the relatively minor modification in the drug structure, namely the conversion of C-17 carbonyl to hydroxyl.
The selective anticancer activity of the particles was confirmed using DET and MTT assays on the following cell lines: human breast carcinoma (MCF7 and MDA-MB-231), human lung carcinoma (A549) and human lung fibroblasts (MRC-5). The DET test revealed that A-HAp/ChOSL particles exhibit on average fourfold cytotoxicity toward breast cancer cells (MDA-MB-231) compared to that exhibited toward healthy cells (MRC-5) after 48 hours of incubation. Per the results of the MTT assay, B-HAp/ChOSL particles produce nearly six times greater cytotoxicity to all the breast cancer cell lines than to healthy cells after the 96 h and 120 h treatments. Particularly noticeable in the MTT assay were the toxicities imposed by A-loaded HAp/ChOSL and B-loaded HAp/ChOSL onto MDA-MB-231 and MCF7 breast cancer cells, respectively (> 70%), while at the same time bearing six times lower toxicity to the healthy MRC-5 line. After 48 h of treatment with B-loaded HAp/ChOSL particles, DET testing showed a similar selectivity, specifically high viability of healthy cells (83 %) and low viability of all cancer cell lines, particularly the breast (MDA-MB-231, 28 %). The rather limited selectivity of pure derivatives A and B toward breast cancer cells became drastically increased when they were delivered using HAp/ChOSL particles. Thus, whereas the ratio of the cytotoxicity imposed onto breast cancer cells and the cytotoxicity imposed onto healthy MRC-5 fibroblasts ranged from 1.5 to 1.7 for pure A and from 1.5 to 2.3 for pure derivative B depending on the concentration, it increased to 5.4 for A-loaded HAp/ChOSL and 5.1 for B-loaded HAp/ChOSL. In total, A-loaded HAp/ChOSL particles imposed 2 – 6 times greater toxicity to cancer cells than to healthy cells depending on the cell lines compared and cytotoxicity assays used, and this ratio was higher, equalling 4 – 6 times for B-loaded HAp/ChOSL. FACS analysis demonstrated poor uptake of HAp/ChOSL particles by MCF7 cells, suggesting that the drug release occurs extracellularly and the particles do not assist the drug to cross the plasma membrane. The augmented activity of the drugs by the carrier is most likely due to sustained release, but the favourable positive charge of the particles, allowing them to adhere to the outer surface of the negatively charged plasma membrane and release the drugs steadily and directly to the hydrophobic cell membrane milieu is a possible complementary mechanism. In support of this mechanism of action, fluorescent imaging of the interface between the MCF7 breast cancer cells and the drug-loaded HAp/ChOSL particles has shown the areas of co-localization of the particles with the cell boundaries, in addition to the evident regions of disrupted cytoskeletal structure resulting from the treatment with A-HAp/ChOSL and B-HAp/ChOSL particles, but not drug-free HAp/ChOSL.
Acknowledgements
Research presented in this article was supported by the Ministry of Education, Science and Technological Development of the Republic of Serbia (project No. III45004) and by the United States National Institutes of Health (R00/DE-021416 award). The authors acknowledge the help of Dr. Verica Đorđević and Dr. Dejan Bezbradica of the Faculty of Technology and Metallurgy, University of Belgrade, with ξ-potential and HPLC measurements.
Footnotes
Conflicts of interest
There are no conflicts to declare.
References
- 1.Dorozhkin SV, Mater. Sci. Eng. C, 2013, 33, 3085. [DOI] [PubMed] [Google Scholar]
- 2.Habraken W, Habibovic P, Epple M and Bohner M, Mater. Today, 2016, 19, 69. [Google Scholar]
- 3.Bose S and Tarafder S, Acta Biomater, 2012, 8, 1401. [DOI] [PMC free article] [PubMed] [Google Scholar]
- 4.Qi C, Lin J, Fu LH and Huang P, Chem. Soc. Rev, 2018, 47, 357. [DOI] [PubMed] [Google Scholar]
- 5.Uskoković V and Uskoković DP, J. Biomed. Mater. Res. - Part B Appl. Biomater., 2011, 96 B, 152. [DOI] [PubMed] [Google Scholar]
- 6.Sun Y, Chen Y, Ma X, Yuan Y, Liu C, Kohn J and Qian J, ACS Appl. Mater. Interfaces, 2016, 8, 25680. [DOI] [PubMed] [Google Scholar]
- 7.Ridi F, Meazzini I, Castroflorio B, Bonini M, Berti D and Baglioni P, Adv. Colloid Interface Sci, 2017, 244, 281. [DOI] [PubMed] [Google Scholar]
- 8.Haider A, Haider S, Han SS and Kang I-K, RSC Adv, 2017, 7, 7442. [Google Scholar]
- 9.Ignjatović N, Uskoković V, Ajduković Z and Uskoković D, Mater. Sci. Eng. C, 2013, 33, 943. [DOI] [PMC free article] [PubMed] [Google Scholar]
- 10.Ignjatović NL, Ninkov P, Sabetrasekh R and Uskoković DP, J. Mater. Sci. Mater. Med, 2010, 21, 231. [DOI] [PubMed] [Google Scholar]
- 11.Vukomanović M, Šarčev I, Petronijević B, Škapin SD, Ignjatović N and Uskoković D, Colloids Surfaces B Biointerfaces, 2012, 91, 144. [DOI] [PubMed] [Google Scholar]
- 12.de Souza Albernaz M, Weissmuller G, Linhares Rossi A, Malta Rossi A and Santos-Oliveira R, J. Diagnostic Imaging Ther, 2015, 2, 9. [Google Scholar]
- 13.Kumar MNVR, Muzzarelli RAA, Muzzarelli C, Sashiwa H and Domb AJ, Chem. Rev, 2004, 104, 6017. [DOI] [PubMed] [Google Scholar]
- 14.Ravi Kumar MNV, React. Funct. Polym, 2000, 46, 1. [Google Scholar]
- 15.Ignjatović N, Vranješ Djurić S, Mitić Ž, Janković D and Uskoković D, Mater. Sci. Eng. C, 2014, 43, 439. [DOI] [PubMed] [Google Scholar]
- 16.Vranješ-Đurić S and Ignjatović NL, in Nanotechnologies in Preventive and Regenerative Medicine, ed. Uskoković V and uskoković D, Elsevier, 2018, Chapter I, pp. 65–92. [Google Scholar]
- 17.Ignjatović N, Wu V, Ajduković Z, Mihajilov-Krstev T, Uskoković V and Uskoković D, Mater. Sci. Eng. C, 2016, 60, 357. [DOI] [PMC free article] [PubMed] [Google Scholar]
- 18.Li Z, Tan S, Li S, Shen Q and Wang K, Oncol. Rep, 2017, 38, 611. [DOI] [PMC free article] [PubMed] [Google Scholar]
- 19.Arya N and Katti DS, Int. J. Nanomedicine, 2015, 10, 2997. [DOI] [PMC free article] [PubMed] [Google Scholar]
- 20.Menon JU, Kuriakose A, Iyer R, Hernandez E, Gandee L, Zhang S, Takahashi M, Zhang Z, Saha D and Nguyen KT, Sci. Rep, 2017, 7, 1. [DOI] [PMC free article] [PubMed] [Google Scholar]
- 21.Muanprasat C and Chatsudthipong V, Pharmacol. Ther, 2017, 170, 80. [DOI] [PubMed] [Google Scholar]
- 22.Jadidi-Niaragh F, Atyabi F, Rastegari A, Kheshtchin N, Arab S, Hassannia H, Ajami M, Mirsanei Z, Habibi S, Masoumi F, Noorbakhsh F, Shokri F and Hadjati J, J. Control. Release, 2017, 246, 46. [DOI] [PubMed] [Google Scholar]
- 23.Gudmundsdottir S, Lieder R, Sigurjonsson OE and Petersen PH, J. Biomed. Mater. Res. - Part A, 2015, 103, 2778. [DOI] [PubMed] [Google Scholar]
- 24.Bharathiraja S, Bui NQ, Manivasagan P, Moorthy MS, Mondal S, Seo H, Phuoc NT, Vy Phan TT, Kim H, Lee KD and Oh J, Sci. Rep, 2018, 8, 1. [DOI] [PMC free article] [PubMed] [Google Scholar]
- 25.Suh MS, Shen J, Kuhn LT and Burgess DJ, Int. J. Pharm, 2017, 517, 58. [DOI] [PubMed] [Google Scholar]
- 26.Engkagul V, yanut Klaharn I, Sereemaspun A and Chirachanchai S, Nanomedicine Nanotechnology, Biol. Med, 2017, 13, 2523. [DOI] [PubMed] [Google Scholar]
- 27.Rasool F, Nayak D, Katoch A, Faheem MM, Yousuf SK, Hussain N, Belawal C, Satti NK, Goswami A and Mukherjee D, Sci. Rep, 2017, 7, 1. [DOI] [PMC free article] [PubMed] [Google Scholar]
- 28.Tantawy MA, Nafie MS, Elmegeed GA and Ali IAI, Bioorg. Chem, 2017, 73, 128. [DOI] [PubMed] [Google Scholar]
- 29.Li Z, Alyamani M, Li J, Rogacki K, Abazeed M, Upadhyay SK, Balk SP, Taplin ME, Auchus RJ and Sharifi N, Nature, 2016, 533, 547. [DOI] [PMC free article] [PubMed] [Google Scholar]
- 30.Djurendić EA, Savić MP, Klisurić OR, Sakač MN, Bogdanović GM, Jakimov DS and Penov Gaši KM, Struct. Chem, 2012, 23, 1761. [Google Scholar]
- 31.Savić MP, Djurendić EA, Petri ET, Ćelić A, Klisurić OR, Sakač MN, Jakimov DS, Kojić VV and Gaši KMP, RSC Adv, 2013, 3, 10385. [Google Scholar]
- 32.Ignjatović NL, Penov-Gaši KM, Wu VM, Ajduković JJ, Kojić VV, Vasiljević-Radović D, Kuzmanović M, Uskoković V and Uskoković DP, Colloids Surfaces B Biointerfaces, 2016, 148, 629–639. [DOI] [PMC free article] [PubMed] [Google Scholar]
- 33.Mosmann T, Immunol J Methods, 1983, 65, 55. [DOI] [PubMed] [Google Scholar]
- 34.Miljkovic D, Petrovic J, Stajic M and Miljkovic M, J. Org. Chem, 1973, 38, 3585. [Google Scholar]
- 35.Lak A, Mazloumi M, Mohajerani MS, Zanganeh S, Shayegh MR, Kajbafvala A, Arami H and Sadrnezhaad SK, J. Am. Ceram. Soc, 2008, 91, 3580. [Google Scholar]
- 36.Ignjatović NL, Liu CZ, Czernuszka JT and Uskoković DP, Acta Biomater, 2007, 3, 927. [DOI] [PubMed] [Google Scholar]
- 37.Chebl M, Abiad MG, Moussa Z and Patra D, J. Phys. Chem. C, 2016, 120, 11210. [Google Scholar]
- 38.Muzaffar S, Bhatti IA, Zuber M, Bhatti HN and Shahid M, Int. J. Biol. Macromol, 2017, 94, 51. [DOI] [PubMed] [Google Scholar]
- 39.Phil L, Naveed M, Mohammad IS, Bo L and Bin D, Biomed. Pharmacother, 2018, 102, 438. [DOI] [PubMed] [Google Scholar]
- 40.Fernández-de Castro L, Mengíbar M, Sánchez Á, Arroyo L, Villarán MC, Díaz de Apodaca E and Heras Á, LWT - Food Sci. Technol, 2016, 73, 368. [Google Scholar]
- 41.Fei X, Yu M, Zhang B, Cao L, Yu L, Jia G and Zhou J, Spectrochim. Acta - Part A Mol. Biomol. Spectrosc, 2016, 152, 343. [DOI] [PubMed] [Google Scholar]
- 42.Neufeld L and Bianco-Peled H, Int. J. Biol. Macromol, 2017, 101, 852. [DOI] [PubMed] [Google Scholar]
- 43.Alskär LC, Porter CJH and Bergström CAS, Mol. Pharm, 2016, 13, 251. [DOI] [PMC free article] [PubMed] [Google Scholar]
- 44.Nel AE, Mädler L, Velegol D, Xia T, Hoek EMV, Somasundaran P, Klaessig F, Castranova V and Thompson M, Nat. Mater, 2009, 8, 543. [DOI] [PubMed] [Google Scholar]
- 45.Uskoković V, J. Dispers. Sci. Technol, 2012, 33, 1762. [DOI] [PMC free article] [PubMed] [Google Scholar]
- 46.Pfeiffer C, Rehbock C, Huhn D, Carrillo-Carrion C, de Aberasturi DJ, Merk V, Barcikowski S and Parak WJ, J. R. Soc. Interface, 2014, 11, 20130931. [DOI] [PMC free article] [PubMed] [Google Scholar]
- 47.Zhang Y, Yang M, Portney NG, Cui D, Budak G, Ozbay E, Ozkan M and Ozkan CS, Biomed. Microdevices, 2008, 10, 321. [DOI] [PubMed] [Google Scholar]
- 48.Ertl P, Rohde B and Selzer P, J. Med. Chem, 2000, 43, 3714. [DOI] [PubMed] [Google Scholar]
- 49.Stevanovic M, Ignjatovic N, Jordovic B and Uskokovic D, J. Mater. Sci. Mater. Med, 2007, 18, 1339. [DOI] [PubMed] [Google Scholar]
- 50.Farah IO, Biomed. Sci. Instrum, 2007, 43, 110. [PubMed] [Google Scholar]


