Abstract
Niemann-Pick C disease (NPC) is an autosomal recessive lysosomal storage disorder resulting from mutations in the NPC1 (95% of cases) or NPC2 genes. Disturbance of copper homeostasis has been reported in NPC1 disease. In this study we have used whole-body positron emission tomography (PET) and brain electronic autoradiography with copper-64 (64Cu), in the form of the copper(II) bis(thiosemicarbazonato) complex 64Cu-GTSM, to image short-term changes in copper trafficking after intravenous injection in a transgenic mouse model of NPC1 disease. 64Cu-GTSM is taken up in all tissues and dissociates rapidly inside cells, allowing monitoring of the subsequent efflux and redistribution of 64Cu from all tissues. Significantly enhanced retention of 64Cu radioactivity was observed in brain, lungs and blood at 15 h post-injection in symptomatic Npc1−/− transgenic mice compared to wildtype controls. The enhanced retention of 64Cu in brain was confirmed by electronic autoradiography, particularly in the midbrain, thalamus, medulla and pons regions. Positron emission tomography imaging with 64Cu in selected chemical forms could be a useful diagnostic and research tool for the management and understanding of NPC1 disease.
Keywords: Niemann-Pick C, Copper-64, Positron emission tomography, Autoradiography, Copper dyshomeostasis
Introduction
Niemann-Pick disease type C (NPC) is an autosomal recessive lysosomal storage disorder resulting from mutations in the NPC1 (95% of cases) or NPC2 genes. It is characterised by the accumulation of lysosomal cholesterol and sphingolipids giving rise to liver dysfunction and progressive neurodegeneration, including cerebellar atrophy leading to ataxia. Additionally, NPC1 disease patients have been shown to develop Alzheimer’s disease-like neurofibrillary pathology, which also contributes to the neurodegenerative process (Love et al. 1995; Auer et al. 1995; Vanier 2010; Neufeld et al. 1999; Davies et al. 2000; Liscum 2000). Miglustat is approved as a disease-modifying therapy that slows disease progression (Sévin et al. 2007; Patterson et al. 2007).
In vitro and in vivo studies have demonstrated that abnormal lipid metabolism in NPC1 disease is accompanied by oxidative stress (Reddy et al. 2006; Klein et al. 2011; Smith et al. 2009; Zampieri et al. 2009; Zhang et al. 2008; Porter et al. 2010; Zhang et al. 2014; Klinke et al. 2015). Metal dyshomeostasis (notably copper) in NPC1 disease has been reported and may enhance reactive oxygen species (ROS) production and accelerate neurodegeneration (Vázquez et al. 2012a, b; Sakiyama et al. 2014; Connemann et al. 2012). The NPC1 protein may play a direct role in normal copper metabolism since it has been reported to mediate the incorporation of endosomal copper into ceruloplasmin in cultured hepatocytes (Yanagimoto et al. 2009, 2011). However, copper imbalance in NPC1 disease may merely be a consequence of aberrant lipid storage since copper and cholesterol metabolic pathways have been shown to be interconnected (Hung et al. 2013). Whole-brain copper levels have not been measured in human brain tissue, but were found to be decreased in NPC1 null mice compared to healthy controls (Hung et al. 2014). Copper content in the cerebellum was shown to be reduced or unchanged in NPC1 null mice relative to age-matched controls (Vázquez et al. 2012b, Hung et al. 2014). Copper levels in cerebrospinal fluid were found to be decreased in a very small cohort of NPC1 patients (n = 2) as compared with healthy subjects (Hung et al. 2014). Thus, reports on central nervous system (CNS) copper content in NPC are sparse and there is no clear consensus. Recently, a patient with copper overload (thought initially to be suffering from Wilson’s disease following the discovery of elevated copper in a liver biospy) was correctly rediagnosed with NPC, suggesting that tissue copper levels may be altered in NPC1 patients (Connemann et al. 2012). An improved understanding of copper trafficking and tissue distribution in NPC1 disease is therefore needed and would greatly facilitate (i) the development of new diagnostic techniques, (ii) the elucidation of the mechanism of disease pathogenesis and progression and (iii) the design of more effective therapies, including potential chelation therapy.
The increased availablity of positron emission tomography (PET) and positron-emitting radioisotopes of biologically important metals has made PET an attractive method for tracking trace metal fluxes both in humans and animal models (Bartnicka and Blower 2018). In this study we have explored for the first time the value of PET with the positron-emitting radioisotope 64Cu to image short-term copper trafficking in healthy Npc1+/+ versus presymptomatic and symptomatic Npc1−/− mice (6- and 9-week-old). The aim was to delineate potential abnormalities in copper trafficking, both in the CNS and at whole-body level, that might serve as a biomarker for the disorder. This novel approach enables dynamic, live, non-invasive investigation of Cu fluxes in the same mouse over time and could be readily extended to humans. Intravenous (i.v.) injection of 64Cu in the form of an ionic Cu(II) salt gives rise to radiocopper uptake in brain and spinal cord that is insufficient for PET imaging of uptake processes (Andreozzi et al. 2017). Instead, here we study copper retention and efflux of radiocopper delivered directly to cells and tissues, bypassing specific delivery processes by using 64Cu-GTSM [glyoxalbis(N4-methyl-3-thiosemicarbazonato) copper(II)], an uncharged, lipophilic Cu(II) complex that displays excellent blood–brain barrier (BBB) penetration and is able to release its Cu payload efficiently and nonselectively into cells (Torres et al. 2016; Fodero-Tavoletti et al. 2010).
The BALB/cNctr-Npc1m1N/J (Npc1−/−) null mutant mouse model of NPC1 disease is well-characterised and displays an early-onset, severe form of NPC1 disease, with lifespan limited to 11–12 weeks (Shang et al. 2013; Loftus et al. 1997; Morris et al. 1982; Shio et al. 1982; Bhuvaneswaran et al. 1982). Like NPC1 patients, NPC1 deficient (Npc1−/−) mice develop progressive neurodegeneration characterised by cerebral atrophy, hypomyelination and degeneration of cerebellar Purkinje cells (Voikar et al. 2002). A 6-weeks of age time point was chosen as representative of the presymptomatic/early stage of the disease, while 9-week-old mice represent the symptomatic phase of the disease (Shang et al. 2013).
Materials and methods
Animals
All animal experiments were performed in accordance with the Animals (Scientific Procedures) Act, 1986 and ARRIVE guidelines, under a UK Home Office Licence (PPL70/7459). Animals were kept in standard conditions and fed ad libitum with regular animal feed (PicoLab Rodent Diet 20 EXT IRR, LabDiet ®, US). BALB/cNctr-Npc1m1N/J mutant mice (The Jackson Laboratory, Charles River, UK) were maintained by heterozygote sibling matings and genotyped to identify Npc1−/− (null) and wildtype (Npc1+/+, WT) mice as previously described (Loftus et al. 1997). Food intake, natural behaviour and animal body weight were monitored weekly. At the appropriate age, animals (all from the same source; technical replicates) were assigned to groups and transported from the Oxford laboratory to the King’s laboratory for the imaging study and acclimatised for one week prior to imaging. Only female mice were used for the in vivo studies. Data acquisition and analysis were performed without blinding.
Radiochemistry
Glyoxalbis(N4-methyl-3-thiosemicarbazone) (H2-GTSM) was synthesised following a previously reported procedure (Torres et al. 2016). 64Cu was produced as previously reported on a CTI RDS 112 biomedical cyclotron at the Clinical PET Centre of St Thomas’ Hospital in the form of 64CuCl2 in 0.1 N HCl solution (4.8 GBq/μg). Radioactivity was measured using a Capintec CRC-25R dose calibrator. Radio-TLC was performed on a LabLogic Flow-Count scanner (scan speed: 0.25 mm/s), using MERCK 60 F254 silica gel TLC plates as the stationary phase and ethyl acetate as the mobile phase.
64CuCl2 (~ 100 MBq, pH 1, 0.5 mL) was buffered to pH 6 with a 3 M solution of sodium acetate (Sigma-Aldrich). To this solution, 10 µg of H2-GTSM in dimethyl sulfoxide (DMSO, 10 μL, 1 mg/mL, Sigma-Aldrich) were added. The reaction mixture was vortexed for 1 min and allowed to stand at room temperature for 5–10 min. The resulting 64Cu-GTSM solution was then loaded onto a C18 cartridge (Sep-Pak C18 Plus Short Cartridge, 360 mg Sorbent, 55–105 µm particle size, Waters Ltd.), previously conditioned with ethanol and water. The sample was washed through with water (5 mL) and ethanol (0.3 mL) and the product collected by elution with a further 1 mL ethanol (~ 90% isolated radiochemical yield, ≥ 95% radiochemical purity). For intravenous administration, 64Cu-GTSM was diluted in sterile 0.9% saline solution (w/v) to < 10% of total injected volume (< 200 μL).
PET/CT imaging
Imaging experiments were performed using a nano-Scan® PET/CT scanner (Mediso Medical Imaging Systems, Budapest, Hungary). 64Cu-GTSM-PET was performed in 6- and 9-week-old female Npc1−/− mice and age-matched WT controls (n = 7 in 9-week-old Npc1−/− group, n = 6 in 6-week-old Npc1−/− group, n = 5 in WT groups). All animals were anaesthetised by isoflurane inhalation (3%, Vet Tech Solutions Ltd.) for immobilisation and injected with 64Cu-GTSM (~ 15 to 20 MBq, ≤ 200 µL) via a lateral tail vein. Immediately after injection, mice were placed on the scan bed in the prone position and imaged for 30 min by PET/CT (PET: 400-600 keV energy window, 5 ns coincidence window, 0.30 × 0.30 × 0.30 mm3 voxel size; CT: 180 projections, 45 KVp, 0.25 × 0.25 × 0.21 mm3 voxel size). Anaesthesia was maintained with 1.5-2% isoflurane throughout the duration of the scan. Respiration rate and bed temperature were monitored during image acquisition. After imaging, mice were allowed to recover and housed overnight. At 15 h post-injection of 64Cu-GTSM, animals were re-scanned as described above.
PET image analysis
All PET/CT datasets were reconstructed using 3D iterative algorithms (8 iterations, 0.25 × 0.25 × 0.25 mm3 voxel size) (Magdics et al. 2011). Intercrystal scatter correction was applied. All PET images were decay-corrected to injection time prior to quantification. All reconstructed datasets were analysed using VivoQuant 1.21 software (Invicro, LLC, Boston, USA). PET and CT images were co-registered and fixed-volume 3D ROIs (~ 15 mm3) were drawn in organs of interest to measure 64Cu concentration. The sum of activity (MBq) in the organ ROI was divided by the sum of activity (MBq) in the whole-body ROI (excluding tail) at the time of injection and the resulting percentage [% injected dose (ID)] was normalised by the volume of the organ ROI to express 64Cu uptake as %ID/mL. Global and regional concentrations of 64Cu in the brain were measured using a mouse brain atlas NM/CT module (Invicro, LLC).
Ex vivo biodistribution
After the 15 h imaging time point, all mice were culled and dissected. Organs of interest were explanted, weighed and gamma-counted (LKB Wallac 1282) to measure 64Cu concentration in each organ as %ID/g. The sum of whole-body counts (excluding tail) and excreted activity (urine and faeces) was considered as the total ID.
Ex vivo brain autoradiography
After dissection and gamma counting, brain tissue was cryopreserved in 30% sucrose solution for ~ 6 h, flash-frozen in isopentane (Sigma-Aldrich) and stored at − 80 °C overnight. Sagittal 10 µm brain sections were then cut using a Bright 5040 cryotome and thaw-mounted onto Superfrost PLUS glass microscope slides (Menzel-Glaser, Thermo Scientific), which were then exposed to a storage phosphor screen (PerkinElmer, Super Resolution, 12.5 × 25.2 cm) for 15 h. Finally, the screen was scanned using a Typhoon 8600 scanner (Molecular Dynamics) and the resulting autoradiographs were analysed with OptiQuant 5.0 (PerkinElmer) and ImageJ (NIH).
Statistical analysis
In exploratory studies such as this where expected difference size and variance is unknown, the number of animals per group in our imaging experiments is typically estimated using a two-tailed T test with a confidence interval of 95% and a power of 80%. For a signal-to-noise ratio of 2 ± 1 versus 7.5 ± 4.5 after injection, to detect a nominal difference of 5.5 for a nominal standard deviation of 4.5, 8 animals per group need to be studied. Our group size was determined by approaching this ideal as closely as resources allowed and with a pre-set minimum of 3 per group, while avoiding breeding unnecessarily large numbers. Sample size differences are the result of sorting after genotyping; data from all available animals were included in the analysis. All data are reported as mean ± standard deviation (SD). Statistical analysis was performed using GraphPad Prism 5 (GraphPad Software Inc.). Significance of differences between groups was estimated with two-tailed Student’s t tests and Mann–Whitney U tests. Two-way repeated measures ANOVA with post hoc analyses using the Bonferroni multiple comparison correction was used to determine statistically significant differences between Npc1−/− mice and WT controls at different imaging time-points. No data were defined as outliers.
Results
PET/CT imaging
In order to investigate short-term (< 15 h) copper trafficking in NPC1 disease, Npc1−/− mice at 6 and 9 weeks of age and age-matched WT controls were intravenously injected with 64Cu-GTSM and live imaged from 0 to 30 min and from 15 to 15.5 h post-injection.
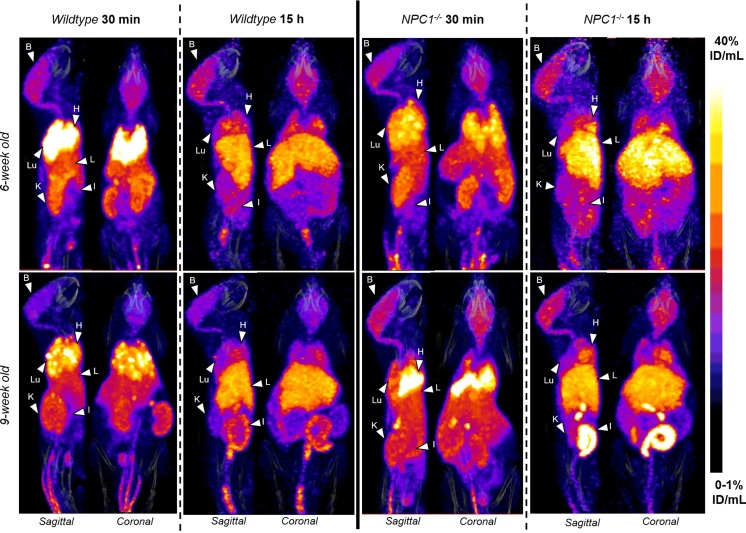
Figure 1, as an example, depicts the in vivo biodistribution of 64Cu in 6- and 9-week-old Npc1−/− mice and WT controls at 30 min and 15 h after injection At 30 min post-injection of the tracer the images were qualitatively similar for all four groups (6 week-old Npc1−/−, 6 week-old WT, 9 week-old Npc1−/−, 9 week-old WT), showing that 64Cu accumulated predominantly in the lungs, heart and to a lesser extent in the liver, intestines, kidneys, and brain. In addition, the images showed marked uptake in adrenal glands and spinal cord, organs that were not harvested ex vivo. At 15 h, the images for all four groups were also qualitatively similar but the activity in the lungs, kidneys, heart and adrenal glands was visibly diminished compared to 30 min, while uptake in brain, spinal cord and liver was not visibly different.
Fig. 1.
Representative sagittal and coronal views of PET/CT images (maximum intensity projection, MIP) of 6-week-old (top) and 9-week-old (bottom) female WT (left) and Npc−/− (right) mice at 30 min (left) and 15 h (right) post-injection of 64Cu-GTSM. PET images in all four groups were visually similar, showing high accumulation of 64Cu radioactivity in the heart (H), lungs (Lu), liver (L), kidneys (K), adrenals, intestines (I) and brain (B) at 30 min after injection of the tracer in all mice. The spinal cord was also clearly visible. While 64Cu accumulation decreased in the heart, lungs, adrenals and kidneys between 30 min and 15 h, the concentration of radiocopper in the liver and intestines increased. Brain uptake of 64Cu remained relatively constant over time. All MIPs were scaled to 0–1%ID/mL (min) and 40%ID/mL (max)
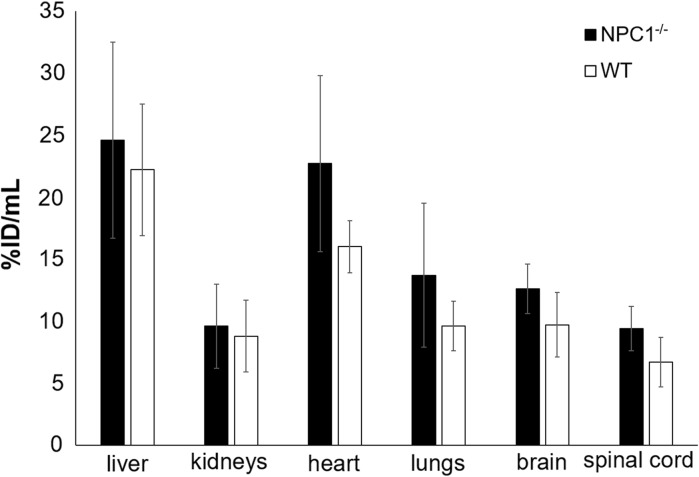
These visual impressions were confirmed by quantitative image analysis, from which uptake values were obtained in organs of interest (Fig. 2). Although the volume of smaller organs is overestimated by the method used to define ROIs because of the partial volume effect (and consequently the %ID/mL values may be underestimated), these values were similar to those obtained from ex vivo biodistribution in 9-week-old mice at 15 h (vide infra). The %ID/mL values for lung derived from PET were much less than the %ID/g values derived from ex vivo organ counting because the density of lung is much less than 1.0 g/mL, unlike other tissues. The standard deviations of the PET-derived uptake values were, however, higher than those of the values derived from ex vivo organ counting. Consequently, while the uptake in hearts, lungs and brains of 9-week-old Npc1−/− mice was higher than that in WT mice (by 42, 43 and 29% respectively) whether measured by PET or ex vivo organ counting, the differences measured by PET did not reach statistical significance. Uptake in spinal cord, as measured by PET, was also higher in 9-week-old Npc1−/− mice than in their WT counterparts (by 39%).
Fig. 2.
Uptake (%ID/mL) of 64Cu in organs distinguishable on PET scans of 9-week-old Npc1−/− (red bars, n = 7) and WT (blue bars, n = 5) mice 15 h post injection of 64Cu-GTSM, determined by quantitative image analysis. Error bars represent ± one standard deviation. The same trends are evident as in Fig. 7 but the standard deviations are larger because of the intrinsic limitations of PET region of interest quantification and volume determination
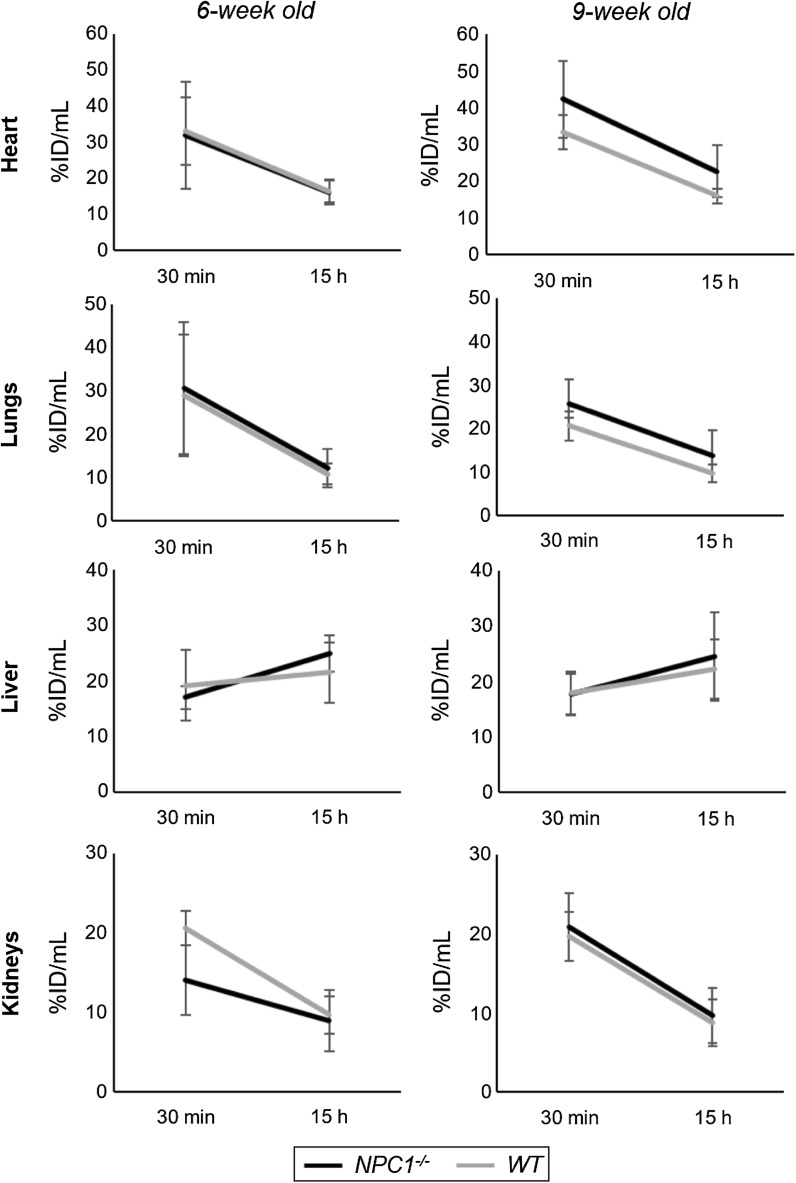
PET imaging allows investigation of the dynamics of the tracer distribution during the 15 h post injection. Figure 3 shows significant net efflux of radioactivity between 30 min and 15 h from heart (a percentage change in radioactivity of − 40 ± 26% in Npc1−/− mice, − 47 ± 19% in WT mice at 6 weeks; − 47 ± 11% in Npc1−/− mice, − 51 ± 10% in WT mice at 9 weeks), lungs (− 55 ± 21% in Npc1−/− mice, − 59% ± 13% in WT mice at 6 weeks; − 42 ± 33% in Npc1−/− mice, − 53 ± 9% in WT mice at 9 weeks) and kidneys (− 48 ± 10% in Npc1−/− mice, − 53 ± 12% in WT mice at 6 weeks; − 54 ± 11% in Npc1−/− mice, − 56 ± 8% in WT mice at 9 weeks). The liver, by contrast, showed a net influx of radioactivity between 30 min and 15 h (+ 48 ± 21% in Npc1−/− mice, + 20% ± 38% in WT mice at 6 weeks; + 43 ± 45% in Npc1−/− mice, + 32 ± 52% in WT mice at 9 weeks). However, this time-dependent change in liver activity was subject to large variation in all four groups, ranging from + 77 to − 50% in individual animals. The % efflux/influx in these organs of Npc1−/− mice was not significantly different to that in WT mice.
Fig. 3.
Dynamics of radioactivity uptake and efflux in heart, lungs, kidney and liver, showing uptake of 64Cu at 30 min and 15 h post injection of 64Cu-GTSM in 6-week-old (left) and 9-week-old (right) Npc1−/− (black, n = 7) and WT (grey, n = 5) mice. Error bars represent ± one standard deviation
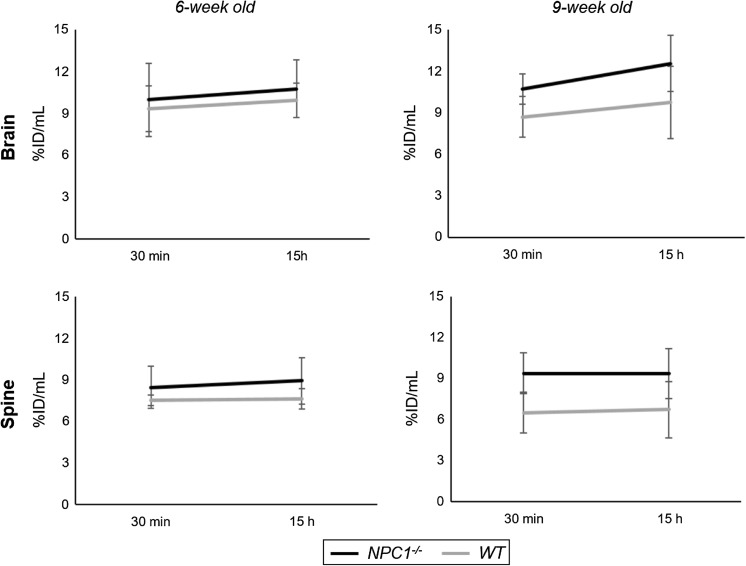
In marked contrast to heart, lungs, liver and kidneys, the changes in radioactivity levels in the CNS between 30 min and 15 h (Fig. 4) were minor and not significant, showing that activity accumulated by 30 min was retained; indeed, there was a small net increase of activity in the brain during the period (10 ± 10% in Npc1−/− mice, 8 ± 9% in WT mice at 6 weeks; 17 ± 17% in Npc1−/− mice, 11 ± 12% in WT mice at 9 weeks). Similarly, in spinal cord there was no significant net efflux; indeed a marginal (non-statistically significant) net influx between 30 min and 15 h (+ 6 ± 10% in Npc1−/− mice, + 1 ± 6% in WT mice at 6 weeks; 0 ± 7% in Npc1−/− mice, + 2 ± 9% in WT mice at 9 weeks).
Fig. 4.
Dynamics of radioactivity uptake and efflux in brain and spinal cord, showing uptake of 64Cu at 30 min and 15 h post injection of 64Cu-GTSM in 6-week-old (left) and 9-week-old (right) Npc1−/− (black, n = 7) and WT (grey, n = 5) mice. Error bars represent ± one standard deviation
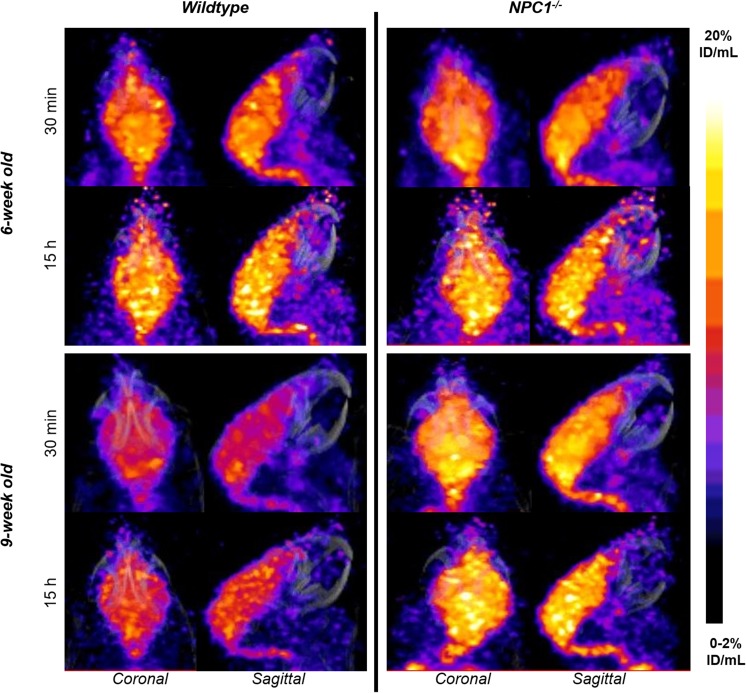
Despite the limitations of resolution of PET (of the order of 0.5–0.7 mm), imaging and quantitative analysis of the distribution of radioactivity within the brain was possible. Because of its low positron energy, 64Cu provides superior resolution images compared to many other radionuclides used for PET. The anatomical definition of brain regions was based on mapping of the images onto a three-dimensional digital mouse brain atlas. Figure 5 shows examplar images of brains from all four groups. Inhomogenous distribution of radioactivity within the brain was evident in all four groups both at 30 min and 15 h, and it is likely that the inhomogeneity is visually underestimated because of limited resolution of the PET scanner.
Fig. 5.
Representative coronal and sagittal PET/CT MIP images illustrating 64Cu distribution in the brains of 6-week-old (upper panel) and 9-week-old (lower panel) WT controls left and age-matched Npc1−/− mice (right) at 30 min (top) and 15 h (bottom) post-injection of 64Cu-GTSM. Nine-week-old Npc1−/− mice exhibited higher brain 64Cu accumulation than their WT littermates at all imaging time-points. All MIPs were scaled to 0–2%ID/mL (min) and 20%ID/mL (max)
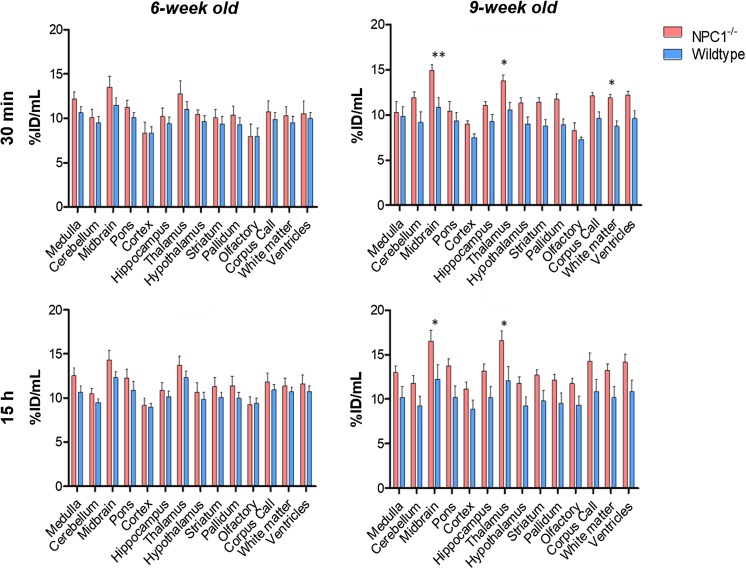
The results of quantitative regional analysis mapped onto the mouse brain atlas are shown in Fig. 6. The increased global brain uptake of radioactivity in Npc1−/− mice compared to WT mice was apparent in all anatomical regions examined and was statistically significant in the 9-week-old group. In all four groups, the regions of highest activity at both 30 min and 15 h were thalamus and midbrain and the regions of lowest activity were the cortex, olfactory bulb and cerebellum. In all groups, there were no significant changes in distribution among brain regions between 30 min and 15 h.
Fig. 6.
Top: Regional brain distribution of 64Cu in 6-week-old (left panels) and 9-week-old (right panels) Npc1−/− mice and age-matched controls at 30 min (top panels) and 15 h (bottom panels) post-injection of 64Cu-GTSM. Data are mean [n = 6-7 Npc1−/−, n = 5 WT)] ± SD. Statistically significant differences from healthy controls were evident in the 9-week-old groups and are indicated by * (p < 0.05) and ** (p < 0.01)
Post-hoc evaluation revealed significant differences in 64Cu concentration in specific brain regions between the Npc1−/− and WT 9-week-old groups at both imaging time-points (Fig. 6). At 30 min after injection, Npc1−/− mice exhibited significantly greater 64Cu levels than their WT littermates in the midbrain (p < 0.01), thalamus (p < 0.05) and white matter (p < 0.05); these significant differences persisted at 15 h in midbrain (p < 0.05) and thalamus (p < 0.05). In 6-week-old mice, the same trends were observed but regional differences did not reach statistical significance.
To show that these differences in 64Cu concentration in the CNS between Npc1−/− and WT 9-week-old mice were not affected by subtle differences in body weight between groups, 64Cu uptake was also expressed as standardised uptake values (SUV,1 which implicitly corrects for body weight). SUV measurements revealed significantly higher 64Cu concentration in the spine (p < 0.01; 30 min and 15 h) and brain (p < 0.01; 15 h) of 9-week old Npc1−/− mice, as well as enhanced 64Cu retention in midbrain and thalamus (p < 0.05; 30 min) and thalamus and hypothalamus (p < 0.05; 15 h) when compared to controls.
Ex vivo biodistribution
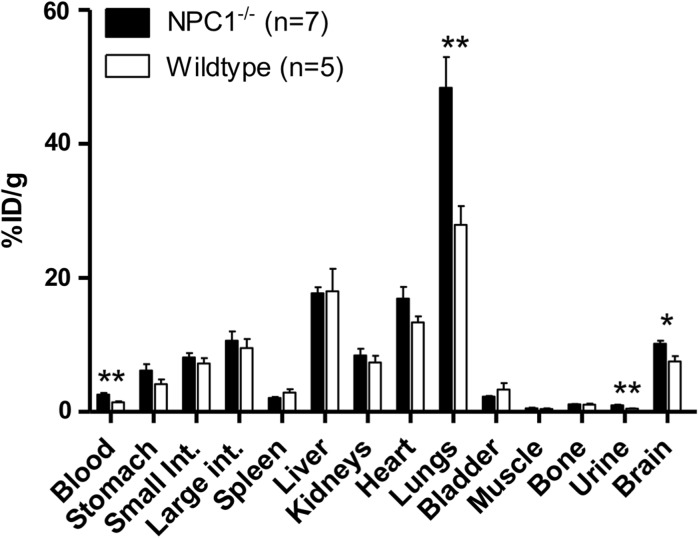
In both Npc1−/− and WT 9-week old mice, ex vivo biodistribution of radioactivity at 15 h post-injection of 64Cu-GTSM was measured by counting and weighing harvested organs post mortem after the imaging. A high retention (> 20%ID/g) was found in the lungs, liver, heart, intestines and brain (Fig. 7), similar to that observed previously in WT mice (Andreozzi et al. 2017; Torres et al. 2016). Significantly enhanced retention was observed in blood (by 78%, p = 0.0043), lungs (by 73%, p = 0.005) and brain (by 35%, p = 0.03) of Npc1−/− mice compared to WT mice (Fig. 7). Activity in urine was very low at this late time point but was significantly higher in Npc1−/− than in WT mice (p = 0.0015). Differences in other tissues were not statistically significant.
Fig. 7.
Radioactivity accumulation/retention in harvested organs of 9-week-old Npc1−/− (black bars, n = 7) and WT (white bars, n = 5) mice, 15 h after i.v. injection of 64Cu-GTSM, determined by ex vivo gamma counting. Error bars represent one standard deviation; **p < 0.01; *p < 0.05
Ex vivo brain autoradiography
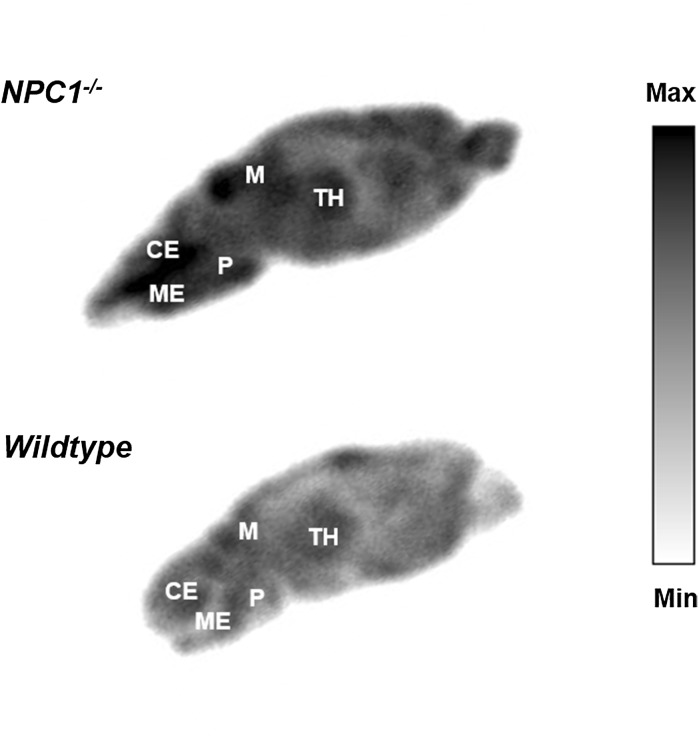
In order to generate high-resolution maps of the distribution of 64Cu within brain tissue, sagittal brain sections of Npc1−/− mice and WT controls sacrificed at 15 h post-injection of 64Cu-GTSM were imaged by phosphor imaging autoradiography. Images in Fig. 8 show the regional distribution of 64Cu in representative sagittal brain slices of Npc1−/− mice and WT controls at 15 h after injection of the tracer as measured by digital autoradiography. These ex vivo autoradiographs reflect the heterogeneous distribution of radioactivity within the brain, and the globally higher accumulation of 64Cu in the brains of 9-week-old Npc1−/− mice compared to age-matched WT controls, that were detected by PET imaging. The most prominent radioactive hotspots in the Npc1−/− brain autoradiographs were found in the midbrain, thalamus, medulla and pons regions.
Fig. 8.
Ex vivo autoradiographs from representative sagittal brain sections of 9-week-old Npc1−/− (top) and WT control (bottom) mice sacrificed at 15 h post-injection of 64Cu-GTSM. The main radioactive hotspots in the Npc1−/− brain autoradiographs were located in the thalamus, midbrain, cerebellum, medulla and pons areas. TH thalamus, M midbrain, CE cerebellum, ME medulla, P pons
Discussion
In this study, we have investigated in vivo copper trafficking in a mouse model of NPC1 disease at presymptomatic (6 weeks) and symptomatic (9 weeks) stages of the disorder by PET imaging using 64Cu-GTSM in order to identify any measurable changes in copper efflux and distribution associated with the pathology. We have focused particularly on the delineation of copper trafficking within the CNS since transition metal imbalance has been linked to enhanced oxidative stress in NPC1 disease and is therefore proposed to contribute to the neurodegenerative process characteristic of this disorder (Vázquez et al. 2011, 2012a; Porter et al. 2010). For this reason, we used 64Cu-GTSM as a vehicle to deliver intravenously-administered radioactive copper into the CNS and release it within cells, allowing subsequent monitoring of its efflux and trafficking. This mode of administration bypasses the innate absorption phase of endogenous copper metabolism and facilitates rapid deposition of radiocopper within the CNS. However, the fate of orally administered radiocopper should also be evaluated by PET in future studies in order to detect any potential abnormalities in the gastrointestinal absorption and subsequent transport of copper that might be associated with NPC1 disease.
As expected from a previous study (Torres et al. 2016), 64Cu-GTSM rapidly delivered radiocopper to all major organs after injection, including the heart, lungs, liver, intestines, kidneys, brain and spinal cord. The decrease of radioactivity in the heart, lungs and kidneys between 30 min and 15 h, and the accompanying accumulation in the liver and intestines, reflects excretion of radiocopper particularly via the biliary system. Significant increases in uptake (whether expressed as %ID/g or SUV) of 64Cu in several tissues were found in Npc1−/− compared to WT animals. However, despite previous studies reporting increased copper content in the liver of Npc1 deficient mice compared to control animals (Vázquez et al. 2011; Argüello et al. 2014; Hung et al. 2014), no significant differences in hepatic 64Cu concentration were found between Npc1−/− and WT groups at either 6 or 9 weeks of age. This discrepancy might be explained on the basis of differences between long-term (total copper content measurements) and short-term (acute trafficking studies described here) copper biodistribution; the previously reported increased copper levels in the liver of Npc1−/− mice are the result of prolonged accumulation of dietary copper in this organ, and might therefore not be measurable by acute PET measurements.
As previously observed both in healthy mice and models of Alzheimer’s disease (Torres et al. 2016; Fodero-Tavoletti et al. 2010), both brain and spinal cord showed surprisingly high radiocopper sequestration. The negligible clearance of 64Cu radioactivity from brain and spinal cord between 30 min and 15 h compared to other tissues, in all groups, might be caused by a particularly high metabolic demand for copper of the CNS and/or less active or absent copper efflux mechanisms compared to other tissues.
Differences in whole-brain and spinal cord 64Cu concentration between presymptomatic (6-week-old) Npc1−/− mice and age-matched controls were observed but did not reach statistical significance. However, the difference persisted and increased with age such that at 9 weeks, Npc1−/− mice exhibited significantly higher 64Cu concentration (whether expressed as %ID/g or SUV) than WT controls at both 30 min and 15 h post-injection of 64Cu-GTSM. Interestingly, these differences in brain and spinal cord 64Cu concentration between the Npc1−/− and WT groups were associated with a significant decrease in brain 64Cu concentration with age in these organs in WT mice.
Reduced total copper content observed in the cerebellum of NPC1-deficient mice (Hung et al. 2014) contrasts with the increased acute 64Cu uptake/retention in our experiments, highlighting the importance of measuring both long-term chronic total copper accumulation and its short-term trafficking. Copper levels in the remaining brain regions have not previously been reported.
The finding of significantly higher 64Cu concentration in the blood of Npc1−/− mice 15 h post injection than their WT littermates is in agreement with previous research revealing increased copper content in blood plasma in presymptomatic and symptomatic Npc1−/− mice compared to healthy controls (Vázquez et al. 2012b; Hung et al. 2014). This elevated blood 64Cu concentration (by 78%) in Npc1−/− mice would not fully account for the enhanced accumulation of 64Cu (by 35%) in their brains and spinal cords, because blood radioactivity is much lower than that of brain and spinal cord, and blood content in these tissue is not high. Elevation of plasma copper in NPC1-deficient mice has been associated with an increase in plasma ceruloplasmin levels, which might indicate a higher rate of synthesis/secretion of this protein in NPC1 disease (Vázquez et al. 2012b; Hung et al. 2014). NPC1 belongs to a family of proteins termed RND permeases that have been implicated in bacterial systems to play a role in metal ion transport (Kim et al. 2011). NPC1 may therefore directly play a role in copper export from the lysosome (Yanagimoto et al. 2009, 2011) or indirectly affect other transport systems involved in copper transport/homeostasis (Argüello et al. 2014) and merits further investigation.
Additional studies are needed to determine whether plasma 64Cu is inserted into ceruloplasmin or bound to other plasma proteins (e.g. albumin, transcuprein), and whether increased blood 64Cu concentration in Npc1−/− mice can be detected at earlier time-points after injection of the tracer (< 15 h). The relationship between blood copper concentration and disease severity and progression also needs to be evaluated in order to determine the potential of this parameter as an early diagnostic marker of NPC1 disease.
Conclusions
This study has demonstrated the potential of 64Cu-GTSM-PET as a tool to identify alterations in copper metabolism associated with NPC disease processes, particularly within the CNS. 64Cu-GTSM-PET revealed significantly increased 64Cu concentration in the brains and spinal cords of symptomatic Npc1−/− mice compared to healthy controls at both 30 min and 15 h post-injection of the tracer. Symptomatic Npc1−/− mice exhibited significantly higher 64Cu concentration in blood than their WT littermates at 15 h after injection. Despite the statistical power of this study being insufficient to confirm some of the subtler changes in copper trafficking, the origin of these metabolic abnormalities along with their relationship with disease severity and progression merit further investigation. Due to the inability of NPC1-deficient mouse models to mimic the phenotypic variability of human NPC1 disease, PET imaging of copper trafficking should additionally be performed in human subjects in order to delineate any potential abnormalities that could be used to assess the status of the disease and potentially monitor response to treatment.
Acknowledgements
Researchers at King’s College London were supported by the Alzheimer’s Society, Alzheimer’s Research UK., the King’s Health Partners Research Challenge Fund, the Centre of Excellence in Medical Engineering funded by the Wellcome Trust and the Engineering and Physical Sciences Research Council (EPSRC) under grant number WT088641/Z/09/Z, the King’s College London and University College London Comprehensive Cancer Imaging Centre funded by Cancer Research UK and EPSRC in association with the MEDICAL Research Council and Department of Health (England), and the National Institute for Health Research Biomedical Research Centre based at Guy’s and St. Thomas’ NHS Foundation Trust and King’s College London (KCL). Scanning equipment at KCL was funded by an equipment grant from the Wellcome Trust under grant number WT 084052/Z/07/Z. FP is a Royal Society Wolfson Merit Award recipient and a Wellcome Trust Investigator in Science. OC and FP were funded by Action Medical Research (2157) and FMP, DS, JS and CS by the Niemann-Pick Research Foundation. We thank Dr. Karen Shaw for the production of 64CuCl2 and Ciara Finucane for advice on the inviCRO brain atlas NM/CT module. The views expressed are those of the authors and not necessarily those of the NHS, the NIHR or the Department of Health.
Compliance with ethical standards
Conflict of interest
The authors have no conflicts of interest to declare.
Footnotes
%ID/g for the specified tissue divided by the %ID for the whole body, excluding tail.
Publisher's Note
Springer Nature remains neutral with regard to jurisdictional claims in published maps and institutional affiliations.
References
- Andreozzi EM, Torres JB, Sunassee K, Dunn J, Walker-Samuel S, Szanda I, Blower PJ. Studies of copper trafficking in a mouse model of Alzheimer’s disease by positron emission tomography: comparison of 64Cu acetate and 64CuGTSM. Metallomics. 2017;9:1622–1633. doi: 10.1039/C7MT00227K. [DOI] [PMC free article] [PubMed] [Google Scholar]
- Argüello G, Martinez P, Peña J, Chen O, Platt F, Zanlungo S, González M. Hepatic metabolic response to restricted copper intake in a Niemann-Pick C murine model. Metallomics. 2014;6:1527–1539. doi: 10.1039/C4MT00056K. [DOI] [PubMed] [Google Scholar]
- Auer I, Schmidt M, Lee V-Y, Curry B, Suzuki K, Shin R-W, Pentchev P, Carstea E, Trojanowski J. Paired helical filament tau (PHFtau) in Niemann-Pick type C disease is similar to PHFtau in Alzheimer’s disease. Acta Neuropathol. 1995;90:547–551. doi: 10.1007/BF00318566. [DOI] [PubMed] [Google Scholar]
- Bartnicka JJ, Blower PJ. Insights into trace metal metabolism in health and disease from PET: PET metallomics. J Nucl Med. 2018;59:1355–1359. doi: 10.2967/jnumed.118.212803. [DOI] [PMC free article] [PubMed] [Google Scholar]
- Bhuvaneswaran C, Morris MD, Shio H, Fowler S. Lysosome lipid storage disorder in NCTR-BALB/c mice. III. Isolation and analysis of storage inclusions from liver. Am J Pathol. 1982;108:160–170. [PMC free article] [PubMed] [Google Scholar]
- Connemann BJ, Gahr M, Schmid M, Runz H, Freudenmann RW. Low ceruloplasmin in a patient with Niemann-Pick Type C disease. J Clin Neurosci. 2012;19:620–621. doi: 10.1016/j.jocn.2011.05.038. [DOI] [PubMed] [Google Scholar]
- Davies JP, Chen FW, Ioannou YA. Transmembrane molecular pump activity of Niemann-Pick C1 protein. Science. 2000;290:2295–2298. doi: 10.1126/science.290.5500.2295. [DOI] [PubMed] [Google Scholar]
- Fodero-Tavoletti MT, Villemagne VL, Paterson BM, White AR, Li QX, Camakaris J, O’Keefe G, Cappai R, Barnham KJ, Donnelly PS. Bis(thiosemicarbazonato) Cu-64 complexes for positron emission tomography imaging of Alzheimer’s disease. J Alzheimers Dis. 2010;20:49–55. doi: 10.3233/JAD-2010-1359. [DOI] [PubMed] [Google Scholar]
- Hung YH, Bush AI, La Fontaine S. Links between copper and cholesterol in Alzheimer’s disease. Front Physiol. 2013;4:111. doi: 10.3389/fphys.2013.00111. [DOI] [PMC free article] [PubMed] [Google Scholar]
- Hung YH, Faux NG, Killilea DW, Yanjanin N, Firnkes S, Volitakis I, Ganio G, Walterfang M, Hastings C, Porter FD, Ory DS, Bush AI. Altered transition metal homeostasis in Niemann-Pick disease, type C1. Metallomics. 2014;6:542–553. doi: 10.1039/C3MT00308F. [DOI] [PMC free article] [PubMed] [Google Scholar]
- Kim EH, Nies DH, McEvoy MM, Rensing C. Switch or funnel: How RND-type transport systems control periplasmic metal homeostasis. J Bacteriol. 2011;193:2381–2387. doi: 10.1128/JB.01323-10. [DOI] [PMC free article] [PubMed] [Google Scholar]
- Klein A, Maldonado C, Vargas LM, Gonzalez M, Robledo F, Perez de Arce K, Muñoz FJ, Hetz C, Alvarez AR, Zanlungo S. Oxidative stress activates the c-Abl/p73 proapoptotic pathway in Niemann-Pick type C neurons. Neurobiol Dis. 2011;41:209–218. doi: 10.1016/j.nbd.2010.09.008. [DOI] [PubMed] [Google Scholar]
- Klinke G, Rohrbach M, Giugliani R, Burda P, Baumgartner MR, Tran C, Gautschi M, Mathis D, Hersberger M. LC-MS/MS based assay and reference intervals in children and adolescents for oxysterols elevated in Niemann-Pick diseases. Clin Biochem. 2015;48:596–602. doi: 10.1016/j.clinbiochem.2015.03.007. [DOI] [PubMed] [Google Scholar]
- Liscum L. Niemann-Pick type C mutations cause lipid traffic jam. Traffic. 2000;1:218–225. doi: 10.1034/j.1600-0854.2000.010304.x. [DOI] [PubMed] [Google Scholar]
- Loftus SK, Morris JA, Carstea ED, Gu JZ, Cummings C, Brown A, Ellison J, Ohno K, Rosenfeld MA, Tagle DA, Pentchev PG, Pavan WJ. Murine model of Niemann-Pick C disease: mutation in a cholesterol homeostasis gene. Science. 1997;277:232–235. doi: 10.1126/science.277.5323.232. [DOI] [PubMed] [Google Scholar]
- Love S, Bridges LR, Case CP. Neurofibrillary tangles in Niemann—Pick disease type C. Brain. 1995;118:119–129. doi: 10.1093/brain/118.1.119. [DOI] [PubMed] [Google Scholar]
- Morris MD, Bhuvaneswaran C, Shio H, Fowler S. Lysosome lipid storage disorder in NCTR-BALB/c mice. I. Description of the disease and genetics. Am J Pathol. 1982;108:140. [PMC free article] [PubMed] [Google Scholar]
- Magdics M, Szirmay-Kalos L, Tóth B, Légrády D, Cserkaszky Á, Balkay L, Domonkos B, Völgyes D, Patay, G, Major P, Lantos J and Bükki T (2011) Performance evaluation of scatter modeling of the GPU-based Tera-Tomo; 3D PET reconstruction. In: Nucl Sci Symp Med Imaging Conf (NSS/MIC), pp 4086–4088. IEEE. 10.1109/NSSMIC.2011.6153777
- Neufeld EB, Wastney M, Patel S, Suresh S, Cooney AM, Dwyer NK, Roff CF, Ohno K, Morris JA, Carstea ED, Incardona JP, Strauss JF, 3rd, Vanier MT, Patterson MC, Brady RO, Pentchev PG, Blanchette-Mackie EJ. The Niemann-Pick C1 protein resides in a vesicular compartment linked to retrograde transport of multiple lysosomal cargo. J Biol Chem. 1999;274:9627–9635. doi: 10.1074/jbc.274.14.9627. [DOI] [PubMed] [Google Scholar]
- Patterson MC, Vecchio D, Prady H, Abel L, Wraith JE. Miglustat for treatment of Niemann-Pick C disease: a randomised controlled study. Lancet Neurol. 2007;6:765–772. doi: 10.1016/S1474-4422(07)70194-1. [DOI] [PubMed] [Google Scholar]
- Porter FD, Scherrer DE, Lanier MH, Langmade SJ, Molugu V, Gale SE, Olzeski D, Sidhu R, Dietzen DJ, Fu R, Wassif CA, Yanjanin NM, Marso SP, House J, Vite C, Schaffer JE, Ory DS. Cholesterol oxidation products are sensitive and specific blood-based biomarkers for Niemann-Pick C1 disease. Sci Transl Med. 2010;2:56ra81. doi: 10.1126/scitranslmed.3001417. [DOI] [PMC free article] [PubMed] [Google Scholar]
- Reddy JV, Ganley IG, Pfeffer SR. Clues to neuro-degeneration in Niemann-Pick type C disease from global gene expression profiling. PLoS ONE. 2006;1:e19. doi: 10.1371/journal.pone.0000019. [DOI] [PMC free article] [PubMed] [Google Scholar]
- Sakiyama Y, Narita A, Osawa S, Nanba E, Ohno K, Otsuka M. Abnormal copper metabolism in Niemann-Pick disease type C mimicking Wilson’s disease. Neurol Clin Neurosci. 2014;2:193–200. doi: 10.1111/ncn3.122. [DOI] [Google Scholar]
- Sévin M, Lesca G, Baumann N, Millat G, Lyon-Caen O, Vanier MT, Sedel F. The adult form of Niemann-Pick disease type C. Brain. 2007;130:120–133. doi: 10.1093/brain/awl260. [DOI] [PubMed] [Google Scholar]
- Shang XY, Lin XJ, Manorek G, Howell SB. Claudin-3 and claudin-4 regulate sensitivity to cisplatin by controlling expression of the copper and cisplatin influx transporter CTR1. Mol Pharmacol. 2013;83:85–94. doi: 10.1124/mol.112.079798. [DOI] [PubMed] [Google Scholar]
- Shio H, Fowler S, Bhuvaneswaran C, Morris M. Lysosome lipid storage disorder in NCTR-BALB/c mice. II. Morphologic and cytochemical studies. Am J Pathol. 1982;108:150. [PMC free article] [PubMed] [Google Scholar]
- Smith D, Wallom KL, Williams IM, Jeyakumar M, Platt FM. Beneficial effects of anti-inflammatory therapy in a mouse model of Niemann-Pick disease type C1. Neurobiol Dis. 2009;36:242–251. doi: 10.1016/j.nbd.2009.07.010. [DOI] [PubMed] [Google Scholar]
- Torres JB, Andreozzi EM, Dunn JT, Siddique M, Szanda I, Howlett DR, Sunassee K, Blower PJ. PET imaging of copper trafficking in a mouse model of Alzheimer disease. J Nucl Med. 2016;57:109–114. doi: 10.2967/jnumed.115.162370. [DOI] [PMC free article] [PubMed] [Google Scholar]
- Vanier MT. Niemann-Pick disease type C. Orphanet J Rare Dis. 2010;5:16. doi: 10.1186/1750-1172-5-16. [DOI] [PMC free article] [PubMed] [Google Scholar]
- Vázquez MC, del Pozo T, Robledo FA, Carrasco G, Pavez L, Olivares F, González M, Zanlungo S. Alteration of gene expression profile in Niemann-Pick type C mice correlates with tissue damage and oxidative stress. PLoS ONE. 2011;6:e28777. doi: 10.1371/journal.pone.0028777. [DOI] [PMC free article] [PubMed] [Google Scholar]
- Vázquez MC, Balboa E, Alvarez AR, Zanlungo S. Oxidative stress: a pathogenic mechanism for Niemann-Pick type C disease. Oxid Med Cell Longev. 2012 doi: 10.1155/2012/205713. [DOI] [PMC free article] [PubMed] [Google Scholar]
- Vázquez MC, Martínez P, Alvarez AR, González M, Zanlungo S. Increased copper levels in in vitro and in vivo models of Niemann-Pick C disease. Biometals. 2012;25:777–786. doi: 10.1007/s10534-012-9546-6. [DOI] [PubMed] [Google Scholar]
- Voikar V, Rauvala H, Ikonen E. Cognitive deficit and development of motor impairment in a mouse model of Niemann-Pick type C disease. Behav Brain Res. 2002;132:1–10. doi: 10.1016/S0166-4328(01)00380-1. [DOI] [PubMed] [Google Scholar]
- Yanagimoto C, Harada M, Kumemura H, Koga H, Kawaguchi T, Terada K, Hanada S, Taniguchi E, Koizumi Y, Koyota S, Ninomiya H, Ueno T, Sugiyama T, Sata M. Niemann-Pick C1 protein transports copper to the secretory compartment from late endosomes where ATP7B resides. Exp Cell Res. 2009;315:119–126. doi: 10.1016/j.yexcr.2008.10.022. [DOI] [PubMed] [Google Scholar]
- Yanagimoto C, Harada M, Kumemura H, Abe M, Koga H, Sakata M, Kawaguchi T, Terada K, Hanada S, Taniguchi E, Ninomiya H, Ueno T, Sugiyama T, Sata M. Copper incorporation into ceruloplasmin is regulated by Niemann-Pick C1 protein. Hepatol Res. 2011;41:484–491. doi: 10.1111/j.1872-034X.2011.00788.x. [DOI] [PubMed] [Google Scholar]
- Zampieri S, Mellon SH, Butters TD, Nevyjel M, Covey DF, Bembi B, Dardis A. Oxidative stress in NPC1 deficient cells: protective effect of allopregnanolone. J Cell Mol Med. 2009;13:3786–3796. doi: 10.1111/j.1582-4934.2008.00493.x. [DOI] [PMC free article] [PubMed] [Google Scholar]
- Zhang JR, Coleman T, Langmade SJ, Scherrer DE, Lane L, Lanier MH, Feng C, Sands MS, Schaffer JE, Semenkovich CF, Ory DS. Niemann-Pick C1 protects against atherosclerosis in mice via regulation of macrophage intracellular cholesterol trafficking. J Clin Invest. 2008;118:2281–2290. doi: 10.1172/JCI32561. [DOI] [PMC free article] [PubMed] [Google Scholar]
- Zhang H, Wang Y, Lin N, Yang R, Qiu W, Han L, Ye J, Gu X. Diagnosis of Niemann-Pick disease type C with 7-ketocholesterol screening followed by NPC1/NPC2 gene mutation confirmation in Chinese patients. Orphanet J Rare Dis. 2014;9:82. doi: 10.1186/1750-1172-9-82. [DOI] [PMC free article] [PubMed] [Google Scholar]


