

Abstract
The aim was to evaluate the potential of Spectral Photon-Counting Computed Tomography (SPCCT) to differentiate between liquid embolic agents and iodinated contrast medium by using tantalum-characteristic K-edge imaging. Tubes with a concentration series of tantalum and inserts with different concentrations of iodine were scanned with a preclinical SPCCT system. Tantalum density maps (TDM) and iodine density maps (IDM) were generated from a SPCCT acquisition. Furthermore, region-of-interest (ROI) analysis was performed within the tubes in the conventional CT, the TDM and IDM. TDM and IDM enable clear differentiation between both substances. Quantitative measurements of different tantalum concentrations match well with those of actually diluted mixtures. SPCCT allows for differentiation between tantalum and iodine and may enable for an improved follow-up diagnosis in patients after vascular occlusion therapy.
Introduction
Arteriovenous malformation (AVM) is a vascular anomaly with a connection between arteries and veins and a lack of intervening capillary bed. AVMs can occur in the central nervous system with a prevalence of <1%1–4. Depending on multiple factors such as localization, size, feeding arteries and draining veins, AVMs can be treated by endovascular embolization, surgery, radiosurgery or by their combinations5–7. A variety of embolic agents has been introduced6,8,9 that can be divided into solid and liquid agents, with the latter being more commonly used. One of the essential requirements for these glues is radiopacity to control the process of intervention, success of vessel occlusion or potential complications in digital subtraction angiography.
Current liquid embolic agents are Onyx (producer: Covidien, eV3 Neurovascular, Irvine, Calif. USA)10–12 and Squid (producer: emboflu, Gland, Switzerland)13 consisting of ethylene vinyl alcohol copolymer dissolved in dimethyl sulfoxide (DMSO). Micronized tantalum powder is added for radiopaque visualization.
CT-angiography of the brain after embolization can be necessary to assess possible remaining feeders as well as the nidus in order to plan further procedures. The micronized tantalum powder, added to the liquid embolic agent for radiopacity, however, can cause severe beam hardening artifacts in these CT images. Sometimes it is difficult to appropriately assess brain tissue and vessels around the clot of liquid embolic agent (Fig. 1). This might affect diagnosis and therapy management14–16. In these cases, techniques reducing artefacts would be desirable to improve image quality.
Figure 1.

Un-enhanced CT scans of the brain after embolization of Arteriovenous malformations (AVMs) with Onyx, in the left occipital lobe (A), in the left parietal region (B) and left parietotemporal region (C). Noticeable are the artifacts that reduce diagnostic image quality.
Advanced CT imaging methods have been developed in the last years providing spectral information17 for the analysis of tissue composition as X-ray attenuation is energy- and material-dependent. Recently, several Spectral Photon-Counting CT (SPCCT) systems have been introduced, where X-ray photons are individually counted and spectrally binned by analyzing the pulse heights generated in a semi-conductor detection layer18–23. This concept allows to incorporate a multiple (more than two) energy bins for energy-selective data acquisition. Using one such prototype system, we could show that the SPCCT system enables differentiation between gadolinium-based and non-ionic iodine-based contrast material in a colon24 and liver25 phantom. Furthermore, it has been demonstrated that discrimination between gold nanoparticles and iodinated contrast agent is possible in different organs in vivo in animals using the SPCCT system26. First experiences of human imaging using a SPCCT system were carried out in cadaver18 and phantom studies27 or in vivo regarding the abdominal system28 and the vascular system of the head and neck29.
The aim of this specific study was to explore the feasibility of SPCCT for material decomposition of tantalum using its characteristic K-edge. Furthermore, we intended to analyze the potential of SPCCT for the differentiation between tantalum and iodine for an improved visualization.
Results
Figure 2 displays the results of the material decomposition for tantalum that is provided by the SPCCT system. Figure 2A shows a schematic explaining the content of the different tubes with a dilution series of tantalum in the range from 3.125% to 100% and a control tube containing DMSO. A conventional CT image of the phantom is contained in Fig. 2B, where one can observe that it is difficult to discriminate between the different dilutions in the low ranges. In the obtained tantalum density maps (TDM) (Fig. 2C), however, already the smallest dilution could be visually discriminated from the control tube containing pure DMSO (100%). Figure 2D contains an overlay of the conventional HU image and the TDM.
Figure 2.

CT-Scan of the phantom model containing tubes with a concentration series of tantalum diluted in DMSO. (A) Schematic of the phantoms contents, (B) HU image, (C) tantalum density map, and (D) fusion image of (B + C) using OsiriX (http://www.osirix-viewer.com).
Figure 3 shows a calibration curve of the tantalum material. With its aid, additional scans were analyzed and tantalum dilution concentrations were calculated. The quantitative measurements of the tubes with different tantalum concentrations matched well with the actually known mixtures (measured: 92.92 ± 0.004%, expected: 100%; measured: 58.85 ± 0.01%, expected: 50%; measured: 27.03 ± 0.01%, expected: 25%; measured: 11.84 ± 0.01%, expected 12.5%; measured: 0.73 ± 0.002%, expected: 0%; RMSE = 0.05). A corresponding Bland-Altman plot is displayed in Fig. 4, highlighting the difference between measured and expected tantalum concentrations versus the average of measured and expected tantalum concentrations. All measurements are located within the range of confidence limits (1.96).
Figure 3.

Calibration curve of tantalum showing correlation between tantalum density values and the prepared tantalum dilution series. 100% tantalum corresponds to a mixture of 1/3 Squid18 and 2/3 DMSO.
Figure 4.
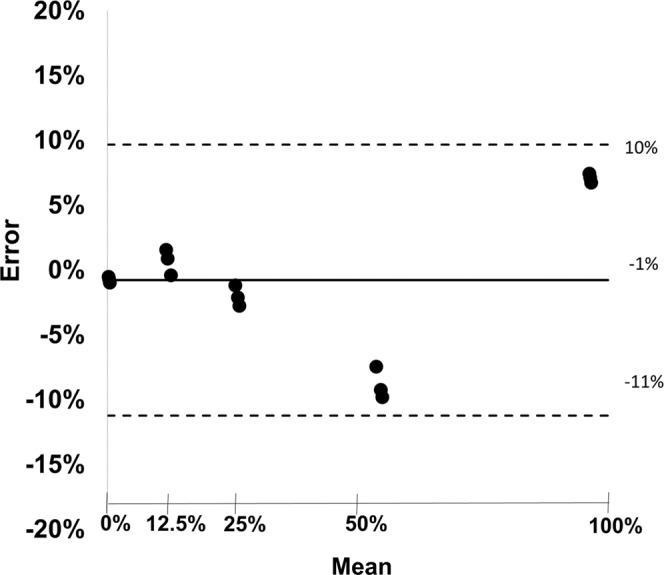
Bland-Altman plot showing difference between measured and expected tantalum concentrations versus average of true and expected tantalum concentrations. The black line represents the bias and the dashed lines represent upper and lower limits of the mean (confidence limits ± 1.96).
We observe that the TDMs and IDMs provided by SPCCT enable clear differentiation between tantalum and iodine. This is shown in Fig. 5, where Fig. 5A represents the conventional HU values, Fig. 5B the TDM and Fig. 5C the IDM. In the conventional HU-CT, the values of the tubes containing low concentrated tantalum, DMSO or high concentrated iodine are similar and can, therefore, not be differentiated. In the TDM, the values of the tubes correspond to the prepared dilution series; the tubes containing DMSO and iodine have values below 0. In the IDM, the dilution series of iodine can be reproduced and tantalum has negative values. DMSO has similar high values as high concentrated iodine, obviously due to similar physical background.
Figure 5.
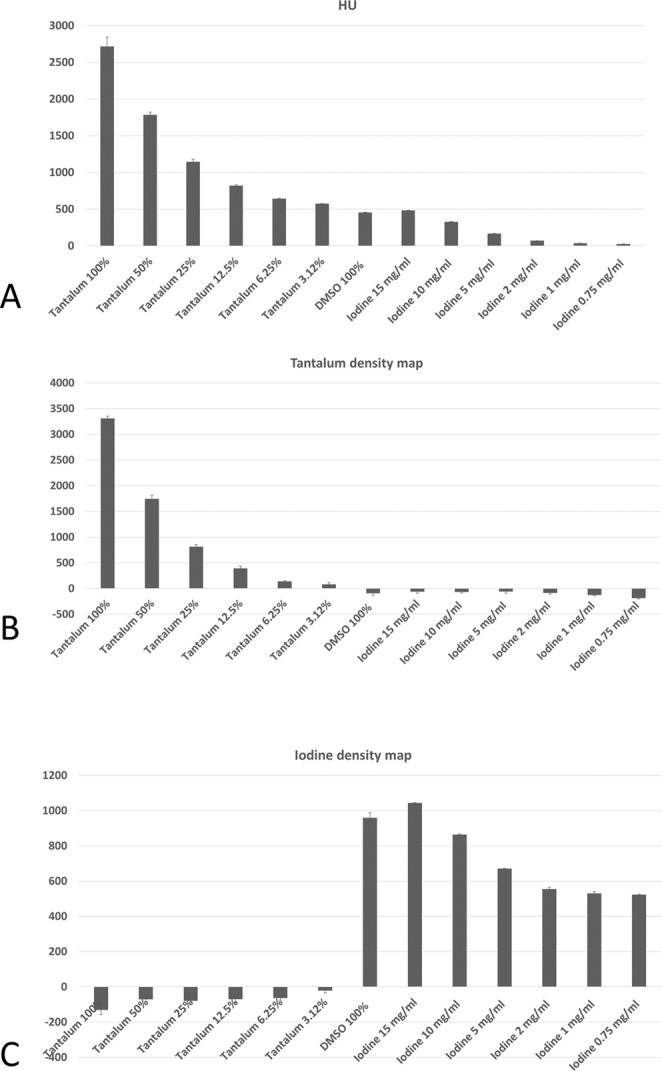
Bar plots showing the values of the region-of-interest (ROI) analyses within the tubes in Hounsfield Units (HU), tantalum density maps and iodine density maps.
Discussion
In this study, we demonstrated that SPCCT allows for material decomposition of tantalum and discrimination between tantalum and iodine.
Recently, we could already show that spectral images using different techniques allow for material quantification and that reliable measurements of iodine concentrations are possible even for very low concentrations of 0.5 mg/ml30,31. As SPCCT offers the potential to improve image quality and to lower image noise, further studies have to be performed using this promising novel technique.
Photon-counting detectors provide the possibility to measure the energy level of each detected photon based on pulse height analysis and enables material-specific imaging in CT by delivering information about energy-based attenuation profiles of tissues20. One highlight of the SPCCT system is its ability to specifically detect exogenous contrast media due to edges in the X-ray attenuation profiles of elements such as gold32. Since tantalum has its K-edge binding energy in the relevant energy range of the X-ray spectrum (67.4 keV), K-edge imaging of tantalum is feasible in the clinical setting. One study has recently been published using K-edge imaging of the SPCCT system33 to differentiate between two contrast agents (iodine and gadolinium) in vivo. The advantage of using SPCCT for tantalum imaging has been highlighted in our study. Material decomposition of tantalum is possible enabling discrimination between iodinated contrast agent and liquid embolic agent – containing tantalum powder. One study could show that tantalum has high attenuation, generates high contrast and provides higher signal and better element-specific image CNR in SPCCT over tungsten, gold and bismuth34. Furthermore, another study could show that tantalum enables to reduce the amount of contrast medium and radiation dose due to higher contrast enhancement and greater contrast-to-noise ratio compared to iodine-based contrast agent, and, thus, may improve vascular imaging in overweight patients35. A recent published study29 concluded that photon-counting CT might improve image quality of CT angiography compared to conventional single-energy CT scans using energy-integrating detectors CT. To summarize, it is obvious that photon-counting CT might improve image quality of CT scans of patients after AVM embolization.
First results of X-ray photon-counting CT scans of the brain in vivo could show a greater gray-white matter contrast compared with conventional CT36. CT scans of the brain are common in the clinical routine while evaluating brain injury in emergency cases or for follow-up controls. Beam hardening artifacts especially near to the base of the skull might affect diagnosis and potentially mimic intracranial hemorrhage. Also here, Photon-Counting CTs might be a promising technique to improve image quality.
One study18 used a photon-counting-detector CT scanner that is capable to image human-sized objects. The rotation time was 1.0 or 0.5 seconds, and is close to a conventional CT scanner with about 0.4 sec.37. Thus, it seems applicable for clinical use in the future.
One of the major concerns about CT technique is the radiation exposure with possible risks of cancer or cataract. One study concluded that photon-counting CT imaging is possible at clinical dose rates with clinical levels of image quality, and furthermore, improved CNR relative to state-of-the-art CT18. A review about photon-counting CT38 concludes that photon-counting CT can minimize image noise and increase spatial resolution that will enable to reduce radiation doses up to 30–40%.
In this phantom study we used a tube current of 100 mA and a tube voltage of 120 kVp that is comparable to another study scanning human heads in vivo with a clinical spectral dual-layer CT scanner (120 kVp and 260 mAs39).
The potential advantages of the SPCCT system, in particular material decomposition and artifact reduction, might also facilitate interpretation of CT examinations of patients after embolization therapies of brain AVMs. A frequent reported disadvantage of Onyx is the production of artifacts that often makes it difficult to interpret the areas near to the embolization material whether there is hemorrhage, the most important complication40, or a remaining feeder. Furthermore, the artifacts caused by the liquid embolic agents might affect planning of a subsequent radiotherapy and might lead to higher radiation doses16. Magnetic resonance imaging (MRI) instead of CT imaging might be a way to solve this challenge, but may not always be available or not possible in cases with contraindications such as a cardiac pacemaker. Furthermore, but to a lesser extent, Onyx can also cause susceptibility artifacts in MRI16.
Another solution to reduce artifacts due to the liquid embolic agents is the use of new embolic agents; one study could show that the precipitating hydrophobic injectable liquid “PHIL” produces fewer artifacts than Onyx in an in vivo model by using covalently bound iodine instead of tantalum powder for radiopacity41,42. However, these agents are relatively new and further studies are required to evaluate their efficacy. The results of our study in vitro are promising to reduce artifacts caused by tantalum and to improve image quality in patients after AVM embolization. Further studies in vivo are necessary to assess the potential impact of the SPCCT system.
A limitation of this study is that the absolute content of tantalum of the used liquid embolic agent (Squid 18) is unknown. We used a concentration series for our experiments. Additionally, DMSO has a high signal due to its chemical structure. In patients, DMSO is injected into the tubes before the injection of the liquid embolic agent to minimize the risk that it becomes hard within the tubes. Within the brain of the patient, DMSO is diluted and diffuses into the tissue, so this problem does not occur with patients. Furthermore, the errors in quantitative measurements were larger when measuring higher amounts of tantalum. One explanation could be that higher concentrations of tantalum lead to higher attenuation and thus photon starvation, which results in more artifacts resulting in higher errors. Further studies have to be performed to evaluate this observation.
To conclude, Spectral Photon-Counting CT provides tantalum density maps and allows for material decomposition and differentiation between tantalum and iodine in vitro. Therefore, the introduction of SPCCT into the clinical field may improve diagnostic imaging especially in patients after embolization of AVMs.
Materials and Methods
Scan specimens
We used Squid13 the as a tantalum-based liquid embolic agent for endovascular occlusion as it is used in human patients. We diluted the stock solution Squid18 (emboflu, Gland, Switzerland) with DMSO (1/3 Squid18 + 2/3 DMSO) to gain a working dilution suspension and performed a serial dilution as follows: 100%; 50%; 25%; 12.5%, 6.25%; 3.125%. Additionally, a tube was filled with 100% DMSO as control reference.
Inserts with different concentrations of iodine (0.75 mg/ml; 1 mg/ml; 2 mg/ml; 5 mg/ml, 10 mg/ml and 15 mg/ml; QRM GmbH, Möhrendorf, Germany) were used. All tubes and inserts were embedded into a solid cylinder of water-equivalent material and 10 cm diameter. Each scan included three different scan positions and eight slices.
Spectral Photon-Counting CT
All experiments were performed with a five bin X-ray spectral photon-counting computed tomography (SPCCT) system (Philips Healthcare, Haifa, Israel) derived from a modified clinical CT system to obtain spectral and conventional data21. This system is provided with energy-sensitive photon-counting detectors made of the direct conversion high band gap semiconductor cadmium zinc telluride. The in-plane field of view was 168 mm, and the z-coverage of the scanner at the isocenter was 2.5 mm. Axial scans over 360° were obtained with a tube current of 100 mA, a tube voltage of 120 kVp, and a scanner rotation time of 1 second.
Material decomposition and quantitative measurements
Multi-bin photon-counting data were pre-processed, and a conventional CT image was derived from the summed information contained in all energy bins. In addition, after pileup correction, the multi-bin counting data were used to perform a maximum likelihood-based material decomposition into a water and iodine material basis19,20 in projection space. The material-decomposed projections have been reconstructed using FBP with a standard filter kernel and no post processing was done to further reduce image noise on FBP images. The iodine and virtual non-contrast images were averaged to a slice thickness of 1 mm after CT reconstruction.
Region of interest analysis
First, a reference scan with the dilution series of tantalum was performed to calibrate the following measurements. Then, measurements of all tubes and inserts, as described above, were performed. Region-of-interest (ROI) analysis was performed within the tubes in the conventional images, the TDM and IDM using an image processing program (ImageJ, National Institutes of Health (NIH), United States43). Circular ROIs were set in the center of the tubes with a volume of 10 mm².
Statistical analysis
Bland-Altman analysis was performed to determine the agreement between measured and expected tantalum concentrations, additionally root mean square error (RMSE) was calculated.
Author Contributions
I.R. and D.P. conceived the study, analyzed the data, wrote the main manuscript text and prepared the figures. I.R., D.B.N., M.K., S.S.M., P.B.N. and D.P. performed the experiments. I.R., P.B.N. and D.P. contributed to the statistical analyses. All authors contributed in the interpretation of the findings and in the final stage of the writing.
Data Availability
The datasets analyzed during the current study are available from the corresponding author on reasonable request.
Competing Interests
The authors declare no competing interests. This work was supported by the German Research Foundation (DFG) and the Technical University of Munich within the funding programme Open Access Publishing.
Footnotes
Publisher’s note: Springer Nature remains neutral with regard to jurisdictional claims in published maps and institutional affiliations.
References
- 1.Arteriovenous Malformation Study, G. Arteriovenous malformations of the brain in adults. The New England journal of medicine340, 1812–1818, 10.1056/NEJM199906103402307 (1999). [DOI] [PubMed]
- 2.Brown RD, Jr., Wiebers DO, Torner JC, O’Fallon WM. Frequency of intracranial hemorrhage as a presenting symptom and subtype analysis: a population-based study of intracranial vascular malformations in Olmsted Country, Minnesota. J Neurosurg. 1996;85:29–32. doi: 10.3171/jns.1996.85.1.0029. [DOI] [PubMed] [Google Scholar]
- 3.Laakso A, Hernesniemi J. Arteriovenous malformations: epidemiology and clinical presentation. Neurosurg Clin N Am. 2012;23:1–6. doi: 10.1016/j.nec.2011.09.012. [DOI] [PubMed] [Google Scholar]
- 4.Ondra SL, Troupp H, George ED, Schwab K. The natural history of symptomatic arteriovenous malformations of the brain: a 24-year follow-up assessment. J Neurosurg. 1990;73:387–391. doi: 10.3171/jns.1990.73.3.0387. [DOI] [PubMed] [Google Scholar]
- 5.Richling, B. et al. Therapy of brain arteriovenous malformations: multimodality treatment from a balanced standpoint. Neurosurgery59, S148–157; discussion S143–113, 10.1227/01.NEU.0000237408.95785.64 (2006). [DOI] [PubMed]
- 6.Bruno CA, Jr., Meyers PM. Endovascular management of arteriovenous malformations of the brain. Interv Neurol. 2013;1:109–123. doi: 10.1159/000346927. [DOI] [PMC free article] [PubMed] [Google Scholar]
- 7.Conger A, Kulwin C, Lawton MT, Cohen-Gadol AA. Diagnosis and evaluation of intracranial arteriovenous malformations. Surg Neurol Int. 2015;6:76. doi: 10.4103/2152-7806.156866. [DOI] [PMC free article] [PubMed] [Google Scholar]
- 8.Howington JU, Kerber CW, Hopkins LN. Liquid embolic agents in the treatment of intracranial arteriovenous malformations. Neurosurg Clin N Am. 2005;16(355-363):ix–x. doi: 10.1016/j.nec.2004.08.013. [DOI] [PubMed] [Google Scholar]
- 9.Jahan R, et al. Embolization of arteriovenous malformations with Onyx: clinicopathological experience in 23 patients. Neurosurgery. 2001;48:984–995. doi: 10.1097/00006123-200105000-00003. [DOI] [PubMed] [Google Scholar]
- 10.Taki W, et al. A new liquid material for embolization of arteriovenous malformations. AJNR. American journal of neuroradiology. 1990;11:163–168. [PMC free article] [PubMed] [Google Scholar]
- 11.Panagiotopoulos V, et al. Embolization of intracranial arteriovenous malformations with ethylene-vinyl alcohol copolymer (Onyx) AJNR. American journal of neuroradiology. 2009;30:99–106. doi: 10.3174/ajnr.A1314. [DOI] [PMC free article] [PubMed] [Google Scholar]
- 12.Terada T, et al. Embolization of arteriovenous malformations with peripheral aneurysms using ethylene vinyl alcohol copolymer. Report of three cases. J Neurosurg. 1991;75:655–660. doi: 10.3171/jns.1991.75.4.0655. [DOI] [PubMed] [Google Scholar]
- 13.Akmangit I, et al. Preliminary experience with squid: a new liquid embolizing agent for AVM, AV fistulas and tumors. Turk Neurosurg. 2014;24:565–570. doi: 10.5137/1019-5149.JTN.11179-14.0. [DOI] [PubMed] [Google Scholar]
- 14.Ayad M, Eskioglu E, Mericle RA. Onyx: a unique neuroembolic agent. Expert Rev Med Devices. 2006;3:705–715. doi: 10.1586/17434440.3.6.705. [DOI] [PubMed] [Google Scholar]
- 15.Saatci I, et al. CT and MR imaging findings and their implications in the follow-up of patients with intracranial aneurysms treated with endosaccular occlusion with onyx. AJNR. American journal of neuroradiology. 2003;24:567–578. [PMC free article] [PubMed] [Google Scholar]
- 16.Shtraus N, et al. Radiosurgical treatment planning of AVM following embolization with Onyx: possible dosage error in treatment planning can be averted. Journal of neuro-oncology. 2010;98:271–276. doi: 10.1007/s11060-010-0177-x. [DOI] [PubMed] [Google Scholar]
- 17.McCollough CH, Leng S, Yu L, Fletcher JG. Dual- and Multi-Energy CT: Principles, Technical Approaches, and Clinical Applications. Radiology. 2015;276:637–653. doi: 10.1148/radiol.2015142631. [DOI] [PMC free article] [PubMed] [Google Scholar]
- 18.Gutjahr R, et al. Human Imaging With Photon Counting-Based Computed Tomography at Clinical Dose Levels: Contrast-to-Noise Ratio and Cadaver Studies. Invest Radiol. 2016;51:421–429. doi: 10.1097/RLI.0000000000000251. [DOI] [PMC free article] [PubMed] [Google Scholar]
- 19.Roessl E, Proksa R. K-edge imaging in x-ray computed tomography using multi-bin photon counting detectors. Phys Med Biol. 2007;52:4679–4696. doi: 10.1088/0031-9155/52/15/020. [DOI] [PubMed] [Google Scholar]
- 20.Schlomka JP, et al. Experimental feasibility of multi-energy photon-counting K-edge imaging in pre-clinical computed tomography. Phys Med Biol. 2008;53:4031–4047. doi: 10.1088/0031-9155/53/15/002. [DOI] [PubMed] [Google Scholar]
- 21.Si-Mohamed S, et al. Review of an initial experience with an experimental spectral photon-counting computed tomography system. Nuclear Instruments and Methods in Physics Research Section A: Accelerators, Spectrometers, Detectors and Associated Equipment. 2017;873:27–35. doi: 10.1016/j.nima.2017.04.014. [DOI] [Google Scholar]
- 22.Taguchi K. Energy-sensitive photon counting detector-based X-ray computed tomography. Radiol Phys Technol. 2017;10:8–22. doi: 10.1007/s12194-017-0390-9. [DOI] [PubMed] [Google Scholar]
- 23.Taguchi K, Iwanczyk JS. Vision 20/20: Single photon counting x-ray detectors in medical imaging. Med Phys. 2013;40:100901. doi: 10.1118/1.4820371. [DOI] [PMC free article] [PubMed] [Google Scholar]
- 24.Muenzel, D. et al. Spectral Photon-counting CT: Initial Experience with Dual-Contrast Agent K-Edge Colonography. Radiology, 160890, 10.1148/radiol.2016160890 (2016). [DOI] [PubMed]
- 25.Muenzel, D. et al. Simultaneous dual-contrast multi-phase liver imaging using spectral photon-counting computed tomography: a proof-of-concept study. European Radiology Experimental1, 10.1186/s41747-017-0030-5 (2017). [DOI] [PMC free article] [PubMed]
- 26.Cormode DP, et al. Multicolor spectral photon-counting computed tomography: in vivo dual contrast imaging with a high count rate scanner. Sci Rep. 2017;7:4784. doi: 10.1038/s41598-017-04659-9. [DOI] [PMC free article] [PubMed] [Google Scholar]
- 27.Symons R, et al. Low-dose lung cancer screening with photon-counting CT: a feasibility study. Phys Med Biol. 2017;62:202–213. doi: 10.1088/1361-6560/62/1/202. [DOI] [PMC free article] [PubMed] [Google Scholar]
- 28.Pourmorteza A, et al. Abdominal Imaging with Contrast-enhanced Photon-counting CT: First Human Experience. Radiology. 2016;279:239–245. doi: 10.1148/radiol.2016152601. [DOI] [PMC free article] [PubMed] [Google Scholar]
- 29.Symons R, et al. Photon-Counting Computed Tomography for Vascular Imaging of the Head and Neck: First In Vivo Human Results. Invest Radiol. 2018;53:135–142. doi: 10.1097/RLI.0000000000000418. [DOI] [PMC free article] [PubMed] [Google Scholar]
- 30.Ehn S, et al. Assessment of quantification accuracy and image quality of a full-body dual-layer spectral CT system. J Appl Clin Med Phys. 2018;19:204–217. doi: 10.1002/acm2.12243. [DOI] [PMC free article] [PubMed] [Google Scholar]
- 31.Sellerer T, et al. Dual-energy CT: a phantom comparison of different platforms for abdominal imaging. European radiology. 2018;28:2745–2755. doi: 10.1007/s00330-017-5238-5. [DOI] [PubMed] [Google Scholar]
- 32.Si-Mohamed S, et al. Evaluation of spectral photon counting computed tomography K-edge imaging for determination of gold nanoparticle biodistribution in vivo. Nanoscale. 2017;9:18246–18257. doi: 10.1039/c7nr01153a. [DOI] [PMC free article] [PubMed] [Google Scholar]
- 33.Si-Mohamed, S. et al. Improved Peritoneal Cavity and Abdominal Organ Imaging Using a Biphasic Contrast Agent Protocol and Spectral Photon Counting Computed Tomography K-Edge Imaging. Invest Radiol, 10.1097/RLI.0000000000000483 (2018). [DOI] [PMC free article] [PubMed]
- 34.Kim J, et al. Assessment of candidate elements for development of spectral photon-counting CT specific contrast agents. Sci Rep. 2018;8:12119. doi: 10.1038/s41598-018-30570-y. [DOI] [PMC free article] [PubMed] [Google Scholar]
- 35.Lambert JW, et al. An Intravascular Tantalum Oxide-based CT Contrast Agent: Preclinical Evaluation Emulating Overweight and Obese Patient Size. Radiology. 2018;289:103–110. doi: 10.1148/radiol.2018172381. [DOI] [PMC free article] [PubMed] [Google Scholar]
- 36.Pourmorteza A, et al. Photon-Counting CT of the Brain: In Vivo Human Results and Image-Quality Assessment. AJNR. American journal of neuroradiology. 2017;38:2257–2263. doi: 10.3174/ajnr.A5402. [DOI] [PMC free article] [PubMed] [Google Scholar]
- 37.Riederer I, et al. Radiation dose reduction in perfusion CT imaging of the brain using a 256-slice CT: 80 mAs versus 160 mAs. Clinical Imaging. 2018;50:188–193. doi: 10.1016/j.clinimag.2018.03.021. [DOI] [PubMed] [Google Scholar]
- 38.Willemink MJ, Persson M, Pourmorteza A, Pelc NJ, Fleischmann D. Photon-counting CT: Technical Principles and Clinical Prospects. Radiology. 2018;289:293–312. doi: 10.1148/radiol.2018172656. [DOI] [PubMed] [Google Scholar]
- 39.Riederer, I. et al. Acute infarction after mechanical thrombectomy is better delineable in virtual non-contrast compared to conventional images using a dual-layer spectral CT. Scientific Reports8, 10.1038/s41598-018-27437-7 (2018). [DOI] [PMC free article] [PubMed]
- 40.van Rooij, W. J., Sluzewski, M. & Beute, G. N. Brain AVM embolization with Onyx. AJNR. American journal of neuroradiology28, 172–177; discussion 178 (2007). [PMC free article] [PubMed]
- 41.Vollherbst, D. F. et al. Imaging artifacts of Onyx and PHIL on conventional CT, cone-beam CT and MRI in an animal model. Interv Neuroradiol, 1591019918782692, 10.1177/1591019918782692 (2018). [DOI] [PMC free article] [PubMed]
- 42.Kocer N, et al. Preliminary experience with precipitating hydrophobic injectable liquid in brain arteriovenous malformations. Diagn Interv Radiol. 2016;22:184–189. doi: 10.5152/dir.2015.15283. [DOI] [PMC free article] [PubMed] [Google Scholar]
- 43.Schneider CA, Rasband WS, Eliceiri KW. NIH Image to ImageJ: 25 years of image analysis. Nat Methods. 2012;9:671–675. doi: 10.1038/nmeth.2089. [DOI] [PMC free article] [PubMed] [Google Scholar]
Associated Data
This section collects any data citations, data availability statements, or supplementary materials included in this article.
Data Availability Statement
The datasets analyzed during the current study are available from the corresponding author on reasonable request.