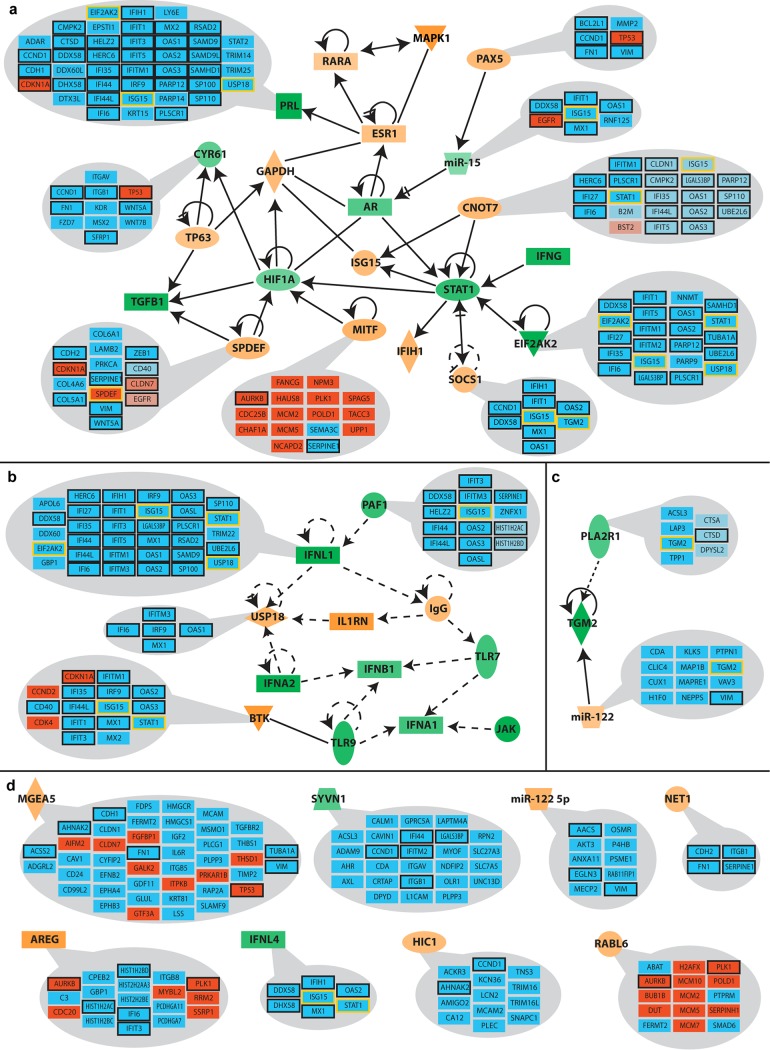
FIG 5.
Reported association of predicted upstream regulators and their regulated genes. Putative upstream regulators were identified by IPA based on the observed up- or downregulation of the indicated genes (blue boxes, downregulation; red boxes, upregulation). Light-hued boxes indicate genes for which an association with the regulator was not yet fully confirmed. The average predicted activity changes of regulators are represented by the intensity of their respective color (orange, increased activity; green, decreased activity). Black-framed boxes depict a regulation of the respective gene by more than one of the identified upstream regulators. Yellow-framed genes are themselves predicted to be upstream regulators. Upstream regulators were grouped into clusters according to their previously reported associations. (a) Cluster of factors directly involved with each other (solid lines); (b and c) clusters of predicted factors indirectly associated with each other (dashed lines); (d) upstream regulators without reported links to any of the other predicted factors from panels a to c.

