Abstract
PURPOSE
To evaluate the performance and limitations of the signal intensity ratio method for quantifying liver iron overload at 3T.
MATERIALS AND METHODS
Institutional review board approval and written informed consent from all participants were obtained. One hundred and five patients were included prospectively. All patients underwent a liver biopsy with biochemical assessment of hepatic iron concentration and a 3T MRI scan with 5 breath-hold single-echo gradient-echo sequences. Linear correlation between liver-to-muscle signal intensity ratio and liver iron concentration was calculated. The algorithm for calculating magnetic resonance hepatic iron concentration was adapted from the method described by Gandon et al. with echo times divided by 2. Sensitivity and specificity were calculated.
RESULTS
Five patients were excluded (coil selection failure or missing sequence) and 100 patients were analyzed, 64 men and 36 women, 52+/−13.3 years old, with a biochemical hepatic iron concentration range of 0 to 630 μmol/g (N<36μmol/g). Linear correlation between biochemical hepatic iron concentration and MR-hepatic iron concentration was excellent with a correlation coefficient = 0.96, p<0.0001. Sensitivity and specificity were respectively 83% [70 – 92] and 96% [85 – 99].
CONCLUSION
Signal intensity ratio method for quantifying liver iron overload can be used at 3T with echo times divided by 2.
INTRODUCTION
Iron overload diseases are common and have many different causes. The liver is the body’s main iron storage site. In the setting of genetic hemochromatosis or hematologic disorders requiring transfusions, hepatic iron concentration can be very high. A milder degree of iron overload can be observed in non-alcoholic fatty liver disease (NAFLD) and dysmetabolic iron overload syndrome (DIOS), prevalent in the Western population [1]. Left untreated, iron overload can lead to complications, the most severe being hepatocellular carcinoma [2,3]. An accurate evaluation of iron overload is needed to help determine treatment options as hepatic iron concentration reflects total body iron overload [4].
In magnetic resonance imaging (MRI), the presence of iron in liver tissue decreases signal intensity primarily on the gradient-echo sequences as they are more sensitive to magnetic susceptibility [5]. This decrease can be quantified by calculating the R2 value, the R2* value [6–11] or the signal intensity ratio (SIR) between the liver and paraspinal muscles [12–14]. These three methods were extensively validated at 1.5T in comparisons with biochemical hepatic iron concentrations (B-HIC) measured in biopsy specimens [15]. MRI is thus now used in routine clinical practice to diagnose, quantify and monitor iron overload [16].
MRI at 3T has become increasingly widespread in recent years. This has led to a strong demand for clinical validation of the above methods at 3T, as the results are quite different at this magnetic field. The significant increase in magnetic susceptibility produces a more marked signal decrease with the same iron burden. Acquisition parameters need to be adapted and new reference values established. Moreover, better sensitivity and accuracy can be expected at 3T, and this particularly means that a more definitive diagnosis of dysmetabolic iron overload syndrome can be reached. Conversely, quantification of severe overload cases may prove more difficult.
Concerning the T2* values, there are theoretical arguments supporting concordance between the different magnetic fields [17,18] whereas these do not exist for the SIR method. Regardless of the method, to our knowledge there have been no previous studies comparing MRI at 3T with biochemical hepatic iron quantification using biopsy specimens in a significant population of patients. The purpose of this study was to evaluate the signal intensity ratio (SIR) method for quantifying liver iron overload at 3T in terms of performance and limitations.
MATERIALS AND METHODS
Patients
The study protocol was approved by the local institutional review board. Between January 2007 and January 2013, 108 patients referred for liver biopsy with suspected liver iron and/or fat overload gave written informed consent to participate in our prospective single-center clinical study (Figure 1). In addition to the usual care, an MRI was scheduled to assess hepatic iron stores. The protocol was made so that biopsy and MRI were done the same day. Only three patients had a different order: 1 with the biopsy one day after MRI, 2 with the MRI 7 days after biopsy.
Fig. 1.
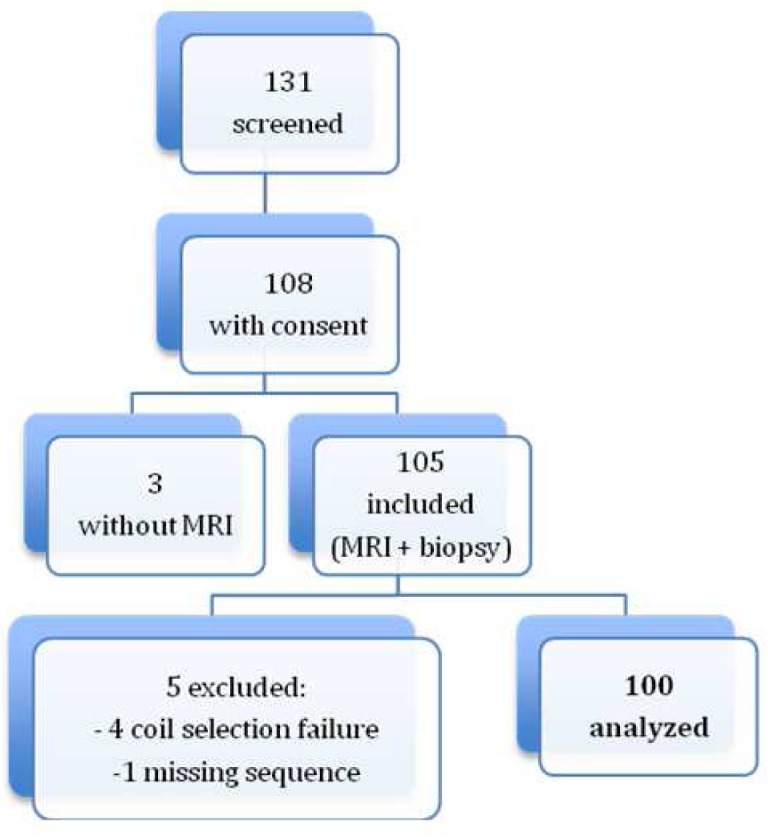
Patient flow chart.
Liver biopsy
Liver biopsy was indicated as per the guidelines of the American Association for the Study of Liver Diseases [19,20]. The indications were iron overload, dysmetabolic syndrome, chronic ethylism, viral hepatitis B or C or other liver diseases (autoimmune hepatitis, primary biliary cirrhosis). A biopsy sample was taken from the right lobe of the liver using a 16 gauge needle (Hepafix 16G, Braun, Melsingen, Germany) under ultrasound guidance. Fibrosis was scored on a 5-grade scale, ranging from 0 (no fibrosis) to 4 (cirrhosis) [21]. All measures were done by a senior pathologist. Biochemical hepatic iron concentration (B-HIC) was measured using Barry and Sherlock’s method on biopsy samples taken from paraffin wax embedded blocks [22]. Hepatic iron overload was defined as a B-HIC greater than 35 μmol/g (dry liver). Steatosis was graded as the percentage of hepatocytes containing lipid vacuoles. The etiologies of liver iron overload were determined by clinical, biochemical, genetic and lab test data.
MRI protocol
Two 3T MR scanners were successively used during the study: an Achieva (Philips, Best, Netherlands) for the first patients, designated as Group 1, and a MAGNETOM Verio (Siemens Healthcare, Erlangen, Germany, operating on Syngo MR B17 software) for the subsequent patients, designated as Group 2. A body coil was used to achieve homogeneous signal intensity in the imaged section and avoid signal depth fall-off. Only the Siemens MR scanner had a compensation method for B1 homogeneity. There was a slight difference of resonance frequency (127.794 vs 123.244 Hz) between the two MR scanners. Five breath-hold single-echo gradient-echo (GRE) sequences were performed using a protocol similar to the one described by Gandon [12] and Rose [23], but with half the echo time (TE). The first, opposed-phase echo was acquired for each patient, followed by 4 in-phase echoes. The selected TEs were slightly increased for the second machine to be exactly in phase (Table 1). Five slices were acquired for each sequence, capturing the middle and main part of the liver. Centering was the same, as sequences were copied on each other. The matrix was 256*256 for Group 1 and 192*162 for Group 2. All other scanning parameters were identical on the two machines with a repetition time of 120 msec, flip angle (FA) of 20°, slice thickness of 7 mm, field of view of 400×400mm2, bandwidth of 1042 kHz and 1 excitation. Each acquisition lasted 15s.
Table 1.
Sequence parameters for the two MR scanners
| Group 1 | Group 2 | |
|---|---|---|
| TE1 (msec) | 1.15 | 1.23 |
| TE2 (msec) | 2.30 | 2.46 |
| TE3 (msec) | 4.60 | 4.92 |
| TE4 (msec) | 9.20 | 9.84 |
| TE5 (msec) | 13.8 | 14.76 |
| Slices | 5 | 5 |
| Matrix | 128*128 | 192*162 |
| TR (msec) | 120 | 120 |
| FA (°) | 20 | 20 |
| Thickness (mm) | 7 | 7 |
| FOV (mm2) | 400*400 | 400*337 |
| Excitation | 1 | 1 |
MRI data analysis
For each sequences, circular regions of interest (ROIs) of 706 mm2 were placed in the same section plane. The plane section was chosen according to the following criteria: presence of right liver and paraspinous muscles. An ImageJ (NIH, Bethesda, USA) plugin was used to place ROIs. Three ROIs were placed with a free hand technique in the right hepatic lobe, avoiding inclusion of vessels, biliary tracts, hepatic lesions or artifacts, in order to get the mean signal intensity (SI) and 2 ROIs in the paraspinous muscles (one on each). The ROIs drawn on the first sequence were automatically spread through the other sequences in the same section plane at the same position. The liver-to-muscle SIR was calculated for each sequence: the mean SI of the three liver ROIs was divided by the mean SI of the two muscle ROIs.
The algorithm was derived from to the one described at 1.5T [12], and was defined from the new data set. Linear regressions between B-LIC and the logarithm of LM ratios (MR-LIC) were calculated for each echo, excluding LM ratio values below 0.2 and over 1.2. To avoid fat influence, the out-phased first echo measures were used only when liver signal on the in-phase second echo was significantly decreased, with a L/M ratio below 0.5. MR-LIC was then calculated from regression parameters for each sequence. Finally only the highest SIR-LIC of the 5 sequences was selected for each patient to determine the MR-LIC. In order to assess interobserver reproducibility, measurements were done by two trained radiologists. Measures and results were automatically saved in a spreadsheet.
Statistical analysis
Using the linear correlations observed between B-HIC and SIR values, an adaptation and an update of the algorithm previously described at 1.5T was made to 3T in order to get hepatic iron quantification (MR-HIC) [12]. Linear correlations were also applied using Pearson correlations. We used the area under the receiver operating characteristic (ROC) curve to assess the SIR method at 3T. Sensitivity and specificity were calculated. We compared MR-HIC and B-HIC with the Bland and Altman statistical method. The results were expressed as mean differences with 95% CIs. Subgroups analysis were also performed. First, linear correlations were made for patients over 200μmol/g defined by B-HIC. Second, patients were classified into three groups according to their histologically steatosis assessment: <=5%, 5 – 30% and >=30%. Linear correlation and Student’s t-test were used to evaluate the influence of steatosis (significant p-value < 0.05). Finally, comparison between the datasets acquired on the two scanners (Group 1 and 2) was also performed using with Pearson correlations and a Student test. Sensitivity and specificity were also calculated. Intra-class correlation coefficient was used to assess interobserver variability.
All analyses were performed using SAS 9.4 (SAS Institute, Cary, NC, USA).
RESULTS
Patient characteristics
One hundred and five patients were enrolled in the study, with different biopsy indications: 58 had iron overload detected by a blood test, 52 had dysmetabolic iron overload syndrome (DIOS), 15 had chronic ethylic intoxication, 15 had either hepatitis B or C and 6 had other liver diseases (autoimmune hepatitis, primary biliary cirrhosis).
The 105 patients enrolled in the study were divided into two groups: the first 36 patients included were scanned on the Philips scanner (Group 1) and the following 69 on the Siemens scanner (Group 2). In the second group, 4 patients were excluded due to a coil selection failure and 1 patient due to a missing sequence. Finally, 100 patients (64 men and 36 women) were analyzed. The mean age was 52+/−13.3 years old. B-HIC ranged from 0 to 630 μmol/g. Forty-six patients had normal B-HIC values. Patient details and iron overload distribution are provided in Table 2, both overall and for each group. Fifty-four patients had steatosis <=5%, 15 patients between 5 and 30% and 31 patients >=30%.
Table 2.
Patient characteristics, divided into two groups according to MR scanner
| Group 1 (Philips) | Group 2 (Siemens) | Total | p | |
|---|---|---|---|---|
| Analyzed MRI | 36 | 64 | 100 | |
| Men/Women | 19/17 | 45/19 | 64/36 | 0.0795 |
| Mean age | 51.9 (25–75) | 52.2 (18–74) | 52.1 | 0.9226 |
| Mean B-HIC (μmol/g) | 111.9 (0–479) | 100.4 (0–630) | 104.5 | 0.7000 |
| B-HIC | 0.1034 | |||
| B-HIC < 36μmol/g | 12 | 34 | 46 | |
| 36 μmol/g <= B-HIC < =100 μmol/g | 9 | 15 | 24 | |
| B-HIC > 100 μmol/g | 15 | 15 | 30 | |
| B-HIC > 200 μmol/g | 7 | 12 | 19 | |
| Mean steatosis grading (%) | 20.7 (0–80) | 19.9 (0–80) | 20.2 | 0.8851 |
Results on all patients
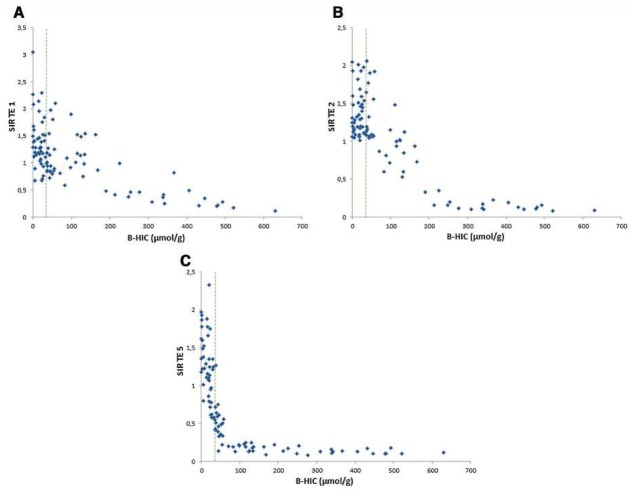
On each sequence, the SIR decrease was closely correlated with the increase in iron burden. The longer the TE, the faster the decrease proved to be. For severe overloads, the SI decrease was already significant on the first echo (Figure 2a). For mild overloads, the SI decrease was seen only on the longest TEs (Figure 2c).
Fig. 2.
(a) Graphical representation of liver-to-muscle SIR as compared to B-HIC for the first echo. This TE enabled quantification in patients with severe overload, above 200 μmol/g, but led to dispersion and lack of correlation for mild overload cases. With this opposed-phase TE, a signal decrease can also be due to liver steatosis. (b) Graphical representation of liver-to-muscle SIR as compared to B-HIC for the second echo. This graph shows a progressive decrease in SIR between normal iron concentration and 200μmol/g. (c) Graphical representation of liver-to-muscle SIR as compared to B-HIC for the fourth echo. This graph shows a fast decrease in SIR as the iron concentration increases, achieving a more accurate evaluation of mild iron concentration, including in the normal range. The algorithm can be tuned to the appropriate echo according to the overload observed.
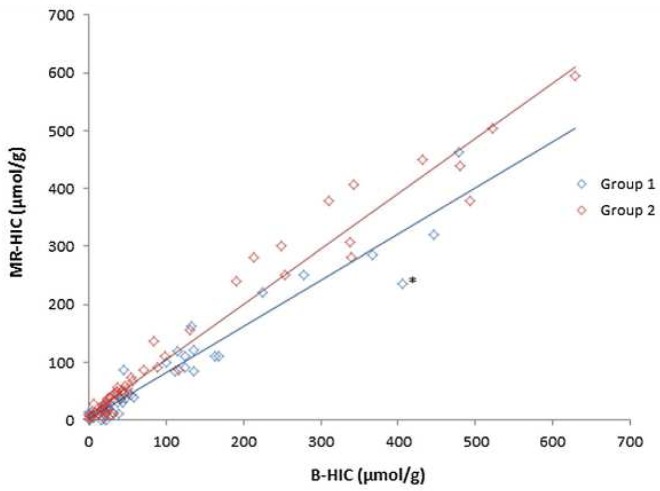
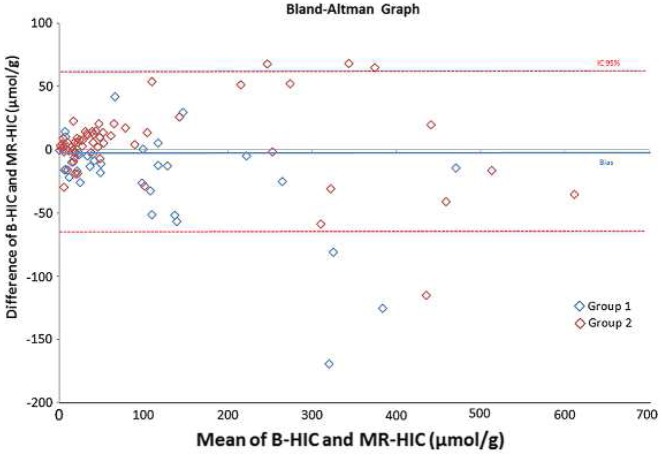
According to our algorithm, iron overloads confirmed by MRI (MR-HIC) and B-HIC were well correlated (correlation coefficient = 0.96, p<0.0001) as shown in Figure 3 and using Bland and Altman comparison as shown in Figure 4.
Fig. 3.
MR-HIC versus B-HIC correlation graph. Correlation between MR-HIC and B-HIC was very good (R2>0.95). When B-HIC is over 200 μmol/g, the correlation and R2 value are stable but a slight discordance can be noted for some values. The asterisk is a discordant point relates to a patient in Group 1 and detailed in fig 6.
Fig. 4.
Bland and Altman comparison between B-HIC and MR-HIC (μmol/g)
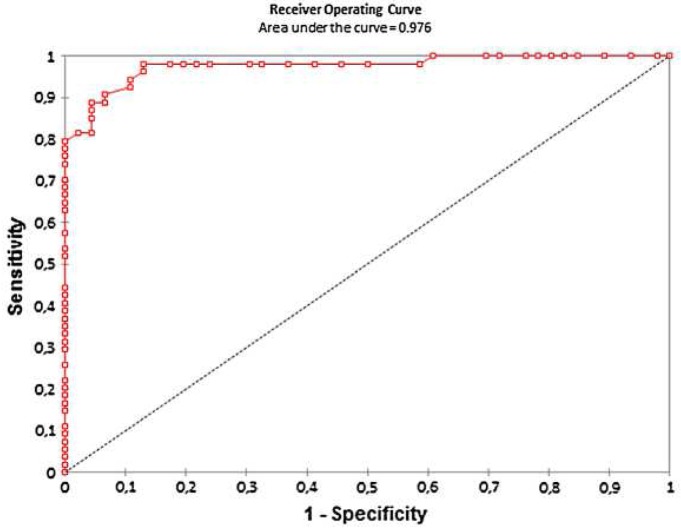
The area under the ROC curve was 0.97 (Fig. 5). Using B-HIC pathological threshold of 36 μmol/g the best sensitivity and specificity were obtained with a MR-LIC threshold of 32 μmol/g, respectively of 98% [89–100] and 87% [74–94].
Fig. 5.
ROC curve performance of MRI with biopsy as the standard reference
Reproducibility between the two radiologists was excellent with an intra-class coefficient correlation of 0.99 [0.98–0.99].
Subgroup analysis
A first subgroup analysis was performed for patients with high B-HIC (> 200 μmol/g). Eighteen patients were involved and the correlation coefficient between B-HIC and MR-HIC for these patients was 0.73 (p=0.0005). The best sensitivity and specificity values for MR-LIC were obtained with a threshold of 162 μmol/g, with a sensitivity of 100% [79–100] and specificity of 99% [93–100]. The area under the ROC curve was 0.99.
A second subgroup analysis was performed according to the three steatosis groups previously described. There was no evidence of any statistical difference in iron assessment between these three groups. (p=0.54).
Finally, the correlation coefficient between B-HIC and MR-HIC was excellent for both groups: 0.93 for Group 1 (p<0.0001) and 0.97 for Group 2 (p<0.0001). The best sensitivity and the specificity of MR-HIC for Group 1 were respectively 96% [78 – 100] and 100% [71 – 100] with an MR-HIC threshold of 22 μmol/g. The AUROC was 0.98. The best sensitivity and the specificity of MR-HIC for Group 2 were 97% [82 – 100] and 94% [79 – 99], with a pathological threshold of 39 μmol/g MR-HIC. The AUROC was 0.99.
DISCUSSION
This study shows that iron overload can be reliably quantified at 3T, achieving excellent correlation with B-HIC findings using the method initially described by Gandon et al. with TEs divided by two [12]. The decrease in liver signal intensity due to the presence of iron – unlike for the paraspinal muscles – enables relatively simple computing of MR-HIC using an algorithm similar to the one described at 1.5T and used in routine clinical practice [12].
With a comparable TE, 3T provides about 40% more signal and is twice as sensitive to iron overload as 1.5T. Improved sensitivity is particularly useful in clinical practice due to the growing interest in DIOS and the impact of iron on the natural history of NAFLD [24]. Most of the iron overloads are under 250 μmol/g in DIOS. Iron overload, although mild, is associated with more severe liver damage and the benefits of iron depletion treatment have been advanced [25–28]. Therefore, a more accurate assessment of liver iron burden in those patients via the use of 3T MRI could provide a more reliable assessment of the impact of iron overload in the natural history of NAFLD or DIOS. The aim is to achieve more efficient selection of patients who could benefit from treatment. However, for high overloads, the benefit of a 3T MR system disappears compared to 1.5T.
The R2 or R2* calculation are the other methods available for assessing liver iron overload. R2 is less sensitive to iron overload, particularly at 3T [29]. However, to our knowledge, there have been no clinical studies correlating R2 or R2* and biochemically quantified hepatic iron overload in a significant population of patients at 3T. Anwar used the equation of Storey et al., describing the relationship between 1.5 and 3T values of R2*, and compared the T2* with the liver iron concentration but with an insufficient number of patients (N=2) who had a liver biopsy within 6 months of the MRI [18,30]. In addition, theoretical analyses suggest that T2* would be halved when switching from 1.5T to 3T [17,18,31]. The results achieved with our halved TEs are consistent with these analyses. Moreover, there is no clinical data in the literature comparing the accuracy of SIR and R2* for quantifying iron overload at 3T, but it is likely that the two methods would produce similar results in mild overload cases, with the same sensitivity increase [32].
As at 1.5T, severe overloads of over 200 μmol/g were quantified with the SIR method at 3T using a very short TE (21). With the T2* calculation, similar values were only assessed at 1.5T using a 0.8 msec TE [33]. Therefore, it is likely that to calculate very short T2* at 3T, as indicated previously, TE would need to be reduced by half, with a first TE of around 0.4 msec. In routine clinical practice, TEs like these are very difficult to achieve [18]. At 3T, Meloni et al. used a first TE at 1.6 msec with a calculation limitation in the case of moderate or severe iron overload [17]. The SIR method could therefore offer an alternative for quantifying severe overload at 3T.
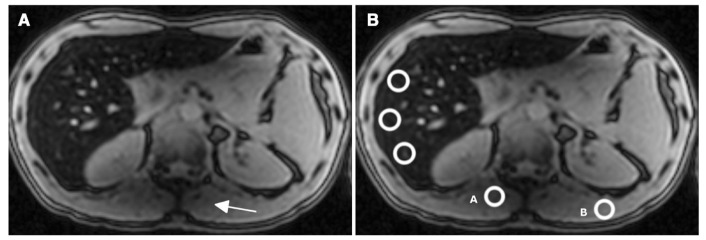
Although the correlation was still good over 200 μmol/g B-HIC, with a global correlation coefficient of 0.73 (p=0.0005), greater deviations were observed for higher values, as shown in Figure 3. The first reason advanced is a slight possible deviation with MRI quantification, especially in Group 1 who didn’t had at that time a compensation method for B1 heterogeneity. One of discordant point, marked by an asterisk in Figure 3, illustrates these potential errors. In that case, the MRI shows a hyposignal of the paraspinous muscles due to B1 heterogeneity (Figure 5). Particular attention should be paid to the positioning of muscle ROIs if this artifact is observed to avoid any impact on clinical management. However, this warrants further investigation in a study with more iron-overloaded patients, thus increasing the number of correlations. A second reason of discordance could be that MRI produces average values for the entire liver whereas liver biopsy is performed on a sample (10).
The results obtained with TEs below the first in-phase echo may be influenced by the presence of fat [34–38]. The liver signal decreases with steatosis in the opposed phase. In usual practice, most patients have either iron or fat overload except for patients with DIOS. However, they have only mild to moderate iron overload and so a shorter TE in the opposed phase is not required as in-phase echoes are sufficient for accurate iron assessment. Quantification of severe iron overload, which is mainly due to genetic hemochromatosis or transfusion-induced, does require the use of shorter TEs, in opposed phase. In this case combined steatosis is rare and its effect on the signal decrease is very slight compared to the effect of iron. Our series is consistent with this observation as the results are well correlated with the iron quantification biopsy results and are not influenced by fat despite both populations being included.
This study has several limitations. First, the acquisitions were performed on two different MR scanners, with slightly different resonance frequency (3%) and TEs (8%) which partially explains lower values observed in group 1. However, this is also one of the strength of the study since the results show excellent quantification accuracy for both scanners. Second, use of the SIR method and hence the muscle signal as the standard reference is based on the assumption that it is similar to the liver signal without any iron overload. However this comparison relies on homogeneous coil sensitivity between those two areas. Use of an integrated body coil is imperative and automatic coil selection must be prevented. Phased array coils can increase the muscle signal and lead to overestimation. In our series, four patients were excluded due to automatic spine coil selection. A preliminary check on all the acquisition parameters is essential before performing any quantification. This is included in the freely available ImageJ plugin we created (available on www.ironbymr.fr). Third, a central hyposignal due to B1 heterogeneity can be observed at 3T, especially if there is no compensation method via either software or a dielectric cushion. This was the case in Group 1 since the scanner used did not offer any compensation method. However, even if this artifact obviously minimize iron quantification in a few cases, it has a minimum effect on the overall results, with no statistically significant difference and an r2 correlation coefficient above 0.95 for both groups. It is also easy to recognize it then and pay attention to the muscle ROIs positioning, Fourth, five single-echo sequences with different TE values need to be acquired, while the T2* calculation uses only one sequence. This limitation can be overcome by using a multi-echo sequence to obtain both SIR and T2*, alternating in-phase and opposed-phase echoes in order to jointly evaluate hemochromatosis and steatosis. However, unlike single-echo sequences, these multi-echo sequences are not always available in standard configuration.
Finally, this study validates the quantification of hepatic iron overload at 3T using the SIR method with single-echo GRE sequences that are constantly available on all scanners. The iron quantification at this higher magnetic field could be benefit for patient with low or mild iron overload. Moreover, very short TEs also enable severe overloads to be quantified. The use of an MR scanner with a B1 correction method or dielectric cushion is recommended to avoid an artificial decrease in paraspinal muscle signal intensity. Further research should investigate the use of multi-echo sequences to simplify the acquisition protocol and to allow a simultaneous SIR and R2* calculation in order to overcome each technique limitations.
Fig. 6.
This MRI corresponds to the forty-year old male patient marked by an asterisk in Figure 3 (B-HIC = 405 μmol/g and MR-HIC=236μmol/g). First echo (TE=1.15 msec) image. (a) The signal decreases in the left lobe of the liver and in the paraspinal muscles (arrowhead) due to a B1 heterogeneity artifact. (b) The MR-HIC estimation can vary between 190 and 390 μmol/g just by moving ROI A, in the artifact area, or B, outside the artifact area, to determine the muscle signal intensity reference.
Acknowledgments
We received support from the national clinical research program for public hospitals of France. Thanks to Tracey Westcott for the language help. Thanks to Aude Tavenard for the statistical analysis. Thanks to all the MRI team of University Hospital of Rennes.
Abbreviations
- MRI
magnetic resonance imaging
- NAFLD
non-alcoholic fatty liver disease
- DIOS
dysmetabolic iron overload syndrome (DIOS)
- B-HIC
biochemical hepatic iron concentration
- SIR
signal intensity ratio
- GRE
echo gradient-echo
- TE
echo time
- ROI
region of interest
- MR-HIC
MRI hepatic iron quantification
- ROC
receiver operating characteristic
Footnotes
Compliance with Ethical Standards:
This study was funded by the national clinical research program for public hospitals of France.
Ethical approval: all procedures performed in studies involving human participants were in accordance with the ethical standards of the institutional and/or national research committee and with the 1964 Helsinki declaration and its later amendments or comparable ethical standards.
Informed consent: Informed consent was obtained from all individual participants included in the study.
References
- 1.Blachier M, Leleu H, Peck-Radosavljevic M, Valla D-C, Roudot-Thoraval F. The burden of liver disease in Europe: a review of available epidemiological data. J Hepatol. 2013;58:593–608. doi: 10.1016/j.jhep.2012.12.005. [DOI] [PubMed] [Google Scholar]
- 2.Deugnier Y, Turlin B. Iron and hepatocellular carcinoma. J Gastroenterol Hepatol. 2001;16:491–4. doi: 10.1046/j.1440-1746.2001.02430.x. [DOI] [PubMed] [Google Scholar]
- 3.Harrison SA, Bacon BR. Relation of hemochromatosis with hepatocellular carcinoma: epidemiology, natural history, pathophysiology, screening, treatment, and prevention. Med Clin North Am. 2005;89:391–409. doi: 10.1016/j.mcna.2004.08.005. [DOI] [PubMed] [Google Scholar]
- 4.Niederau C, Fischer R, Sonnenberg A, Stremmel W, Trampisch HJ, Strohmeyer G. Survival and causes of death in cirrhotic and in noncirrhotic patients with primary hemochromatosis. N Engl J Med. 1985;313:1256–62. doi: 10.1056/NEJM198511143132004. [DOI] [PubMed] [Google Scholar]
- 5.Brittenham GM, Badman DG National Institute of Diabetes and Digestive and Kidney Diseases (NIDDK)Workshop. Noninvasive measurement of iron: report of an NIDDK workshop. Blood. 2003;101:15–9. doi: 10.1182/blood-2002-06-1723. [DOI] [PubMed] [Google Scholar]
- 6.St Pierre TG, Clark PR, Chua-anusorn W, Fleming AJ, Jeffrey GP, Olynyk JK, et al. Noninvasive measurement and imaging of liver iron concentrations using proton magnetic resonance. Blood. 2005;105:855–61. doi: 10.1182/blood-2004-01-0177. [DOI] [PubMed] [Google Scholar]
- 7.Wood JC, Enriquez C, Ghugre N, Tyzka JM, Carson S, Nelson MD, et al. MRI R2 and R2* mapping accurately estimates hepatic iron concentration in transfusion-dependent thalassemia and sickle cell disease patients. Blood. 2005;106:1460–5. doi: 10.1182/blood-2004-10-3982. [DOI] [PMC free article] [PubMed] [Google Scholar]
- 8.Hankins JS, McCarville MB, Loeffler RB, Smeltzer MP, Onciu M, Hoffer FA, et al. R2* magnetic resonance imaging of the liver in patients with iron overload. Blood. 2009;113:4853–5. doi: 10.1182/blood-2008-12-191643. [DOI] [PMC free article] [PubMed] [Google Scholar]
- 9.Chandarana H, Lim RP, Jensen JH, Hajdu CH, Losada M, Babb JS, et al. Hepatic iron deposition in patients with liver disease: preliminary experience with breath-hold multiecho T2*-weighted sequence. AJR Am J Roentgenol. 2009;193:1261–7. doi: 10.2214/AJR.08.1996. [DOI] [PubMed] [Google Scholar]
- 10.Garbowski MW, Carpenter J-P, Smith G, Roughton M, Alam MH, He T, et al. Biopsy-based calibration of T2* magnetic resonance for estimation of liver iron concentration and comparison with R2 Ferriscan. J Cardiovasc Magn Reson. 2014;16:40. doi: 10.1186/1532-429X-16-40. [DOI] [PMC free article] [PubMed] [Google Scholar]
- 11.Henninger B, Zoller H, Rauch S, Finkenstedt A, Schocke M, Jaschke W, et al. R2* relaxometry for the quantification of hepatic iron overload: biopsy-based calibration and comparison with the literature. Rofo. 2015;187:472–9. doi: 10.1055/s-0034-1399318. [DOI] [PubMed] [Google Scholar]
- 12.Gandon Y, Olivié D, Guyader D, Aubé C, Oberti F, Sebille V, et al. Non-invasive assessment of hepatic iron stores by MRI. Lancet. 2004;363:357–62. doi: 10.1016/S0140-6736(04)15436-6. [DOI] [PubMed] [Google Scholar]
- 13.Alústiza JM, Artetxe J, Castiella A, Agirre C, Emparanza JI, Otazua P, et al. MR quantification of hepatic iron concentration. Radiology. 2004;230:479–84. doi: 10.1148/radiol.2302020820. [DOI] [PubMed] [Google Scholar]
- 14.Ernst O, Rose C, Sergent G, L’Herminé C. Hepatic iron overload: quantification with MR imaging at 1. 5 T. AJR Am J Roentgenol. 1999;172:1141–2. doi: 10.2214/ajr.172.4.10587170. [DOI] [PubMed] [Google Scholar]
- 15.Castiella A, Alústiza JM, Emparanza JI, Zapata EM, Costero B, Díez MI. Liver iron concentration quantification by MRI: are recommended protocols accurate enough for clinical practice? Eur Radiol. 2011;21:137–41. doi: 10.1007/s00330-010-1899-z. [DOI] [PubMed] [Google Scholar]
- 16.Brissot P, Troadec M-B, Bardou-Jacquet E, Le Lan C, Jouanolle A-M, Deugnier Y, et al. Current approach to hemochromatosis. Blood Rev. 2008;22:195–210. doi: 10.1016/j.blre.2008.03.001. [DOI] [PubMed] [Google Scholar]
- 17.Meloni A, Positano V, Keilberg P, De Marchi D, Pepe P, Zuccarelli A, et al. Feasibility, reproducibility, and reliability for the T*2 iron evaluation at 3 T in comparison with 1. 5 T. Magn Reson Med. 2012;68:543–51. doi: 10.1002/mrm.23236. [DOI] [PubMed] [Google Scholar]
- 18.Storey P, Thompson AA, Carqueville CL, Wood JC, de Freitas RA, Rigsby CK. R2* imaging of transfusional iron burden at 3T and comparison with 1. 5T. J Magn Reson Imaging. 2007;25:540–7. doi: 10.1002/jmri.20816. [DOI] [PMC free article] [PubMed] [Google Scholar]
- 19.Rockey DC, Caldwell SH, Goodman ZD, Nelson RC, Smith AD American Association for the Study of Liver Diseases. Liver biopsy. Hepatology. 2009;49:1017–44. doi: 10.1002/hep.22742. [DOI] [PubMed] [Google Scholar]
- 20.Bacon BR, Adams PC, Kowdley KV, Powell LW, Tavill AS American Association for the Study of Liver Diseases. Diagnosis and management of hemochromatosis: 2011 practice guideline by the American Association for the Study of Liver Diseases. Hepatology. 2011;54:328–43. doi: 10.1002/hep.24330. [DOI] [PMC free article] [PubMed] [Google Scholar]
- 21.Poynard T, Bedossa P, Opolon P. Natural history of liver fibrosis progression in patients with chronic hepatitis C. The OBSVIRC, METAVIR, CLINIVIR, and DOSVIRC groups. Lancet. 1997;349:825–32. doi: 10.1016/s0140-6736(96)07642-8. [DOI] [PubMed] [Google Scholar]
- 22.Barry M, Sherlock S. Measurement of liver-iron concentration in needle-biopsy specimens. Lancet. 1971;1:100–3. doi: 10.1016/s0140-6736(71)90838-5. [DOI] [PubMed] [Google Scholar]
- 23.Rose C, Vandevenne P, Bourgeois E, Cambier N, Ernst O. Liver iron content assessment by routine and simple magnetic resonance imaging procedure in highly transfused patients. Eur J Haematol. 2006;77:145–9. doi: 10.1111/j.0902-4441.2006.t01-1-EJH2571.x. [DOI] [PubMed] [Google Scholar]
- 24.Dongiovanni P, Fracanzani AL, Fargion S, Valenti L. Iron in fatty liver and in the metabolic syndrome: a promising therapeutic target. J Hepatol. 2011;55:920–32. doi: 10.1016/j.jhep.2011.05.008. [DOI] [PubMed] [Google Scholar]
- 25.Nelson JE, Bhattacharya R, Lindor KD, Chalasani N, Raaka S, Heathcote EJ, et al. HFE C282Y mutations are associated with advanced hepatic fibrosis in Caucasians with nonalcoholic steatohepatitis. Hepatology. 2007;46:723–9. doi: 10.1002/hep.21742. [DOI] [PubMed] [Google Scholar]
- 26.Valenti L, Fracanzani AL, Bugianesi E, Dongiovanni P, Galmozzi E, Vanni E, et al. HFE genotype, parenchymal iron accumulation, and liver fibrosis in patients with nonalcoholic fatty liver disease. Gastroenterology. 2010;138:905–12. doi: 10.1053/j.gastro.2009.11.013. [DOI] [PubMed] [Google Scholar]
- 27.Valenti L, Fracanzani AL, Dongiovanni P, Bugianesi E, Marchesini G, Manzini P, et al. Iron depletion by phlebotomy improves insulin resistance in patients with nonalcoholic fatty liver disease and hyperferritinemia: evidence from a case-control study. Am J Gastroenterol. 2007;102:1251–8. doi: 10.1111/j.1572-0241.2007.01192.x. [DOI] [PubMed] [Google Scholar]
- 28.Equitani F, Fernandez-Real JM, Menichella G, Koch M, Calvani M, Nobili V, et al. Bloodletting ameliorates insulin sensitivity and secretion in parallel to reducing liver iron in carriers of HFE gene mutations. Diabetes Care. 2008;31:3–8. doi: 10.2337/dc07-0939. [DOI] [PubMed] [Google Scholar]
- 29.Ghugre NR, Doyle EK, Storey P, Wood JC. Relaxivity-iron calibration in hepatic iron overload: Predictions of a Monte Carlo model. Magn Reson Med. 2014 doi: 10.1002/mrm.25459. [DOI] [PMC free article] [PubMed] [Google Scholar]
- 30.Anwar M, Wood J, Manwani D, Taragin B, Oyeku SO, Peng Q. Hepatic Iron Quantification on 3 Tesla (3 T) Magnetic Resonance (MR): Technical Challenges and Solutions. Radiol Res Pract. 2013;2013:628150. doi: 10.1155/2013/628150. [DOI] [PMC free article] [PubMed] [Google Scholar]
- 31.Ghugre NR, Coates TD, Nelson MD, Wood JC. Mechanisms of tissue-iron relaxivity: nuclear magnetic resonance studies of human liver biopsy specimens. Magn Reson Med. 2005;54:1185–93. doi: 10.1002/mrm.20697. [DOI] [PMC free article] [PubMed] [Google Scholar]
- 32.Peng P, Huang Z, Long L, Zhao F, Li C, Li W, et al. Liver iron quantification by 3 tesla MRI: calibration on a rabbit model. J Magn Reson Imaging. 2013;38:1585–90. doi: 10.1002/jmri.24074. [DOI] [PubMed] [Google Scholar]
- 33.Wood JC, Enriquez C, Ghugre N, Tyzka JM, Carson S, Nelson MD, et al. MRI R2 and R2* mapping accurately estimates hepatic iron concentration in transfusion-dependent thalassemia and sickle cell disease patients. Blood. 2005;106:1460–5. doi: 10.1182/blood-2004-10-3982. [DOI] [PMC free article] [PubMed] [Google Scholar]
- 34.Outwater EK, Blasbalg R, Siegelman ES, Vala M. Detection of lipid in abdominal tissues with opposed-phase gradient-echo images at 1. 5 T: techniques and diagnostic importance. Radiographics. 1998;18:1465–80. doi: 10.1148/radiographics.18.6.9821195. [DOI] [PubMed] [Google Scholar]
- 35.Siegelman ES. MR imaging of diffuse liver disease. Hepatic fat and iron Magn Reson Imaging. Clin N Am. 1997;5:347–65. [PubMed] [Google Scholar]
- 36.Dixon WT. Simple proton spectroscopic imaging. Radiology. 1984;153:189–94. doi: 10.1148/radiology.153.1.6089263. [DOI] [PubMed] [Google Scholar]
- 37.Fishbein MH, Stevens WR. Rapid MRI using a modified Dixon technique: a non-invasive and effective method for detection and monitoring of fatty metamorphosis of the liver. Pediatr Radiol. 2001;31:806–9. doi: 10.1007/s002470100547. [DOI] [PubMed] [Google Scholar]
- 38.Glover GH. Multipoint Dixon technique for water and fat proton and susceptibility imaging. J Magn Reson Imaging. 1991;1:521–30. doi: 10.1002/jmri.1880010504. [DOI] [PubMed] [Google Scholar]


