

Abstract
Aims
The importance of true worsening renal failure (WRF), which is associated with a poor prognosis, had been suggested in patients with acute heart failure (AHF). The aim of the present study was to establish the biomarker strategy for the prediction of true WRF in AHF.
Methods and results
Two hundred eighty‐one patients with AHF were analysed. Their biomarkers were measured within 30 min of admission. Patients were assigned to the non‐WRF (n = 168), pseudo‐WRF (n = 56), or true‐WRF (n = 57) groups using the criteria of both acute kidney injury on admission and increasing serum creatinine value during the first 7 days. A Kaplan–Meier curve showed that the survival and heart failure event rate of the true‐WRF group within 1000 days was significantly lower than that of the non‐WRF and pseudo‐WRF groups (P ≤ 0.001). The multivariate Cox regression model also indicated that true WRF was an independent predictor of 1000 day mortality and heart failure events [hazard ratio: 4.315, 95% confidence interval (CI): 2.466–7.550, P ≤ 0.001, and hazard ratio: 2.834, 95% CI: 1.893–4.243, P ≤ 0.001, respectively]. The serum heart‐type fatty acid‐binding protein (s‐HFABP) levels were significantly higher in the true‐WRF group than in the non‐WRF and pseudo‐WRF groups (P ≤ 0.001). The multivariate logistic regression model indicated that the predictive biomarker for the true‐WRF group was the s‐HFABP level (odds ratio: 5.472, 95% CI: 2.729–10.972, P ≤ 0.001). The sensitivity and specificity for indicating the presence of true WRF were 73.7% and 76.8% (area under the curve = 0.831) for s‐HFABP in whole patients, respectively, and 94.7% and 72.7% (area under the curve = 0.904) in non‐chronic kidney disease (CKD) patients, respectively.
Conclusions
Cardiac biomarkers, especially the s‐HFABP, might predict the development of true WRF in AHF patients. Furthermore, the predictive value was higher in AHF patients without CKD than in those with CKD.
Keywords: Acute kidney injury, Heart‐type fatty acid‐binding protein, Neutrophil gelatinase‐associated lipocalin, Liver fatty acid‐binding protein, Mortality
Introduction
Acute renal impairment is commonly complicated in patients with acute heart failure (AHF) and is evaluated as worsening renal failure (WRF) or acute kidney injury (AKI).1, 2, 3 WRF is defined as an increase of ≥0.3 mg/dL in the serum creatinine level compared with the value on admission,4, 5 and it has been established as the gold standard for the evaluation of acute renal impairment in patients with AHF.6 However, it was recently reported that WRF alone is not an independent determinant of the outcomes in patients with AHF.7 Indeed, in some cases, WRF has not been associated with the prognosis, defined as ‘pseudo‐WRF’. As such, the definition of true WRF is required.8
The components of AKI were recently introduced in the field of AHF. We already reported that AKI leads to adverse outcome in patients with AHF.3, 9, 10 Approximately 30% of AHF patients already have AKI on admission to the intensive care unit (ICU),3 and such a complication is strongly associated with a poor in‐hospital mortality rate and long‐term prognosis.10 The presence of AKI on admission was therefore suggested to be an important factor influencing the outcomes of AHF patients. We further suggested the combined concept of WRF and AKI.11 In our previous report, AKI on admission and an increase of ≥0.3 mg/dL in the serum creatinine level during the first 5 days compared with the value on admission were independent predictors of the long‐term mortality.11 We performed a four‐group comparison (AKI/no‐AKI and WRF/no‐WRF) in that study.11 On the basis of those findings, we concluded that the presence of WRF with AKI on admission might be defined as true WRF. Acute renal impairment is sometimes complicated in cases of AHF, and some mechanisms have been suggested. Based on the ‘cardiorenal syndrome’, an acute renal impairment in AHF may sometimes simply be a marker of more severe heart failure (HF) rather than of renal WRF.
We hypothesized that true WRF was associated with severe HF and not related to renal tubular dysfunction; therefore, a cardiac biomarker rather than a renal urine biomarker would be useful for the prediction of true WRF, which is associated with adverse outcomes in patients with severely decompensated AHF. We therefore selected the major potential biomarkers, including both serum cardiac [i.e. heart‐type fatty acid‐binding protein (HFABP), high‐sensitivity troponin T (hsTnT), N‐terminal pro‐brain‐type natriuretic peptide (NT‐proBNP), and brain‐type natriuretic peptide (BNP)] and renal urinary [i.e. the urine neutrophil gelatinase‐associated lipocalin (NGAL), liver fatty acid‐binding protein (LFABP), β2‐microglobulin (β2MG), and acetyl‐β‐d‐glucosaminidase (NAG) and albumin excretion] biomarkers, and evaluated the predictive value of these biomarkers for prediction of ‘true WRF’ in patients with AHF.
Methods
Subjects
Two hundred eighty‐one AHF patients who were admitted to the ICU of Nippon Medical School Chiba Hokusoh Hospital between March 2010 and February 2014 were enrolled in this study. AHF was defined as either new‐onset HF or decompensation of chronic HF with symptoms sufficient to warrant hospitalization.12 On the basis of the 2016 European Society of Cardiology guidelines for the diagnosis of AHF, we diagnosed AHF according to the plasma natriuretic peptide level (BNP ≥ 100 pg/mL) (Class I, Level A), a 12‐lead electrocardiogram (Class I, Level C), laboratory measurements [troponins, blood urea nitrogen (BUN), creatinine, sodium, potassium, glucose, liver function, and complete blood counts] (Class I, Level C), and echocardiography (Class I, Level C).12 The treating physician at the emergency department diagnosed AHF within 30 min of admission. AHF presented as either new‐onset or decompensated chronic HF with symptoms sufficient to warrant hospitalization. The patients who met any of the following criteria were admitted to the ICU: (i) patients who required high‐projectile oxygen inhalation (including mechanical support) to treat orthopnoea; (ii) patients who required inotrope or mechanical support due to low blood pressure; and (iii) patients who required various types of diuretics to improve general or lung oedema. The treatment strategy was chosen by each physician. In all cases, diuretics or vasodilators were administered for the treatment of AHF. All of the patients had a New York Heart Association (NYHA) functional class of either III or IV.
Urinary biomarker excretion and serum biomarker measurements
The urine and blood samples were collected within 30 min of admission. The urine and blood samples were centrifuged within 5 min at 4°C and immediately frozen at −80°C until they were analysed. The serum levels of HFABP, hsTnT, NT‐proBNP, and BNP were measured on admission. In addition, the urine NGAL, LFABP, β2MG, NAG, and albumin excretion were also measured on admission. These urine and serum biomarkers were measured by the Special Reference Laboratory (SRL©, Tokyo, Japan). The level of urine LFABP was measured with an enzyme‐linked immunosorbent assay (ELISA) using a human LFABP ELISA Kit (Kyowa Medex Co., Tokyo, Japan). The level of urinary NGAL was measured using the NGAL ELISA Kit (R&D Systems, Inc., Minneapolis, MN). The serum HFABP was measured using a MARKIT‐M HFABP ELISA Kit until June 2012 and using a LIBLIA HFABP latex agglutination turbidimetric immunoassay from July 2012 (DS Pharma Biomedical, Osaka, Japan). The lower and upper limits of detection for the urinary NGAL concentration were 4 and 500 pg/mL, respectively, and the lower limit for the urine LFABP was 2.9 pg/mL.
The evaluation of worsening renal failure and acute kidney injury
We set the definition of WRF during the acute phase of AHF in the present study on the basis of the evidence that almost all WRF occurs within seven days.5, 13 We defined WRF as an increase of ≥0.3 mg/dL in the serum creatinine level during the first 7 days vs. the creatinine value on admission and non‐WRF as an increase of <0.3 mg/dL in the serum creatinine level during the first 7 days vs. the creatinine value on admission. Patients who were receiving continuous renal replacement therapy during the first 7 days were defined as having WRF even if they had an increase of <0.3 mg/dL in the serum creatinine level during the first 7 days (Figure 1 ).
Figure 1.

This study evaluated the relationship between worsening renal failure (WRF) and acute kidney injury (AKI) on admission and the biomarkers. This is a schematic illustration of the group assignment. The patients were assigned to four categories on the basis of the WRF and AKI status at admission. The patients without AKI who did not develop WRF during the first 7 days were assigned to the no‐WRF/no‐AKI (n = 117) group, and the patients without AKI who did develop WRF were assigned to the WRF/no‐AKI (n = 56) group. The AKI patients who did not develop WRF during the first 7 days were assigned to the no‐WRF/AKI (n = 51) group, and the AKI patients who did develop WRF were assigned to the WRF/AKI (n = 57) group. We defined no‐WRF as no‐WRF/no‐AKI and no‐WRF/AKI, pseudo‐WRF as WRF/no‐AKI, and true WRF as WRF/AKI. AKI was defined as an increase in the serum creatinine value of ≥0.3 mg/dL or ≥1.5‐fold on admission vs. the minimum creatinine values during hospitalization. WRF was defined as an increase in the serum creatinine value of ≥0.3 mg/dL during the first 7 days in comparison with the admission creatinine value. The patients who underwent continuous renal replacement therapy (CRRT) on the admission date were defined as having AKI at admission, and those who underwent CRRT during the first 7 days were defined as having WRF. KDIGO, Kidney Disease: Improving Global Outcomes; s‐cr, serum creatinine value.
We evaluated the presence of AKI using only the creatinine criteria of the Kidney Disease: Improving Global Outcomes classification.14 AKI on admission was defined on the basis of the ratio of the serum creatinine value recorded on admission to the baseline creatinine value. ‘No AKI’ was diagnosed as an increase in the serum creatinine level of <1.5‐fold from the baseline and of <0.3 mg/dL from the baseline. Patients who received continuous renal replacement therapy within 24 h were defined as having AKI. With regard to the baseline level of creatinine, the baseline level was defined as the lowest value recorded during admission (Figure 1 ).
Procedures
Worsening renal failure occurred in 113 patients (40.2%) and did not occur in 168 patients (59.8%). No AKI was present in 173 patients (no‐AKI) (61.6%), while AKI was present on admission in 108 patients (38.4%). Based on these results, the true‐WRF group was defined as those with WRF and AKI on admission (n = 57), and the pseudo‐WRF group was defined as those with WRF without AKI on admission (n = 56). The non‐WRF group included the patients without WRF and with or without AKI (n = 168) (Figure 1 ).
We compared the patients' characteristics, including their age, gender, the presence of de novo or recurrent HF, the aetiology of HF, the risk factors for atherosclerosis (diabetes mellitus, hypertension, and dyslipidaemia), vital signs [systolic blood pressure (SBP) and heart rate], the left ventricular ejection fraction (LVEF) on echocardiography, the NYHA class, arterial blood gas data, laboratory data (BUN, total bilirubin, haemoglobin, BNP, C‐reactive protein, and other variables), chest X‐ray findings (lung congestion and massive pleural effusion), physical findings (peripheral oedema), the medications administered during ICU admission, and the duration of admission (duration of ICU stay and hospital stay). Pulmonary congestion on chest X‐ray was defined on the basis of the expansion of bilateral pulmonary arteries in the hilar area or a butterfly shadow on the lung field, and pleural effusion was defined on the basis of dulling of the cardiophrenic angle on at least one side of the lungs or the existence of a vanishing tumour. LVEF was calculated using the Teichholz method or Simpson method on admission (Sonos 5500, Hewlett Packard, Palo Alto, CA; or Vivid I, GE Yokogawa Medical, Tokyo, Japan).
The long‐term prognosis was evaluated and included the all‐cause death and HF events, including all‐cause death and readmission for HF within 1000 days. The patients were clinically followed up at a routine outpatient clinic. For the patients who were followed up at other institutes, their prognoses were determined by telephone contact. The prognostic value in terms of the 1000 day all‐cause death and HF events was evaluated using a Cox regression hazard model, and a Kaplan–Meier curve analysis with significant differences calculated using the log‐rank test was performed.
The urine and serum biomarker levels were compared among the non‐WRF, pseudo‐WRF, and true‐WRF groups. The receiver operating characteristic (ROC) curves for the cardiac and renal urine biomarkers were calculated to predict the optimum cut‐off values, and the sensitivity, specificity, and area under the ROC curve (AUC) were determined to indicate the optimum values for predicting inclusion in the true‐WRF group. All cardiac and renal urine biomarkers were selected for inclusion in a multivariate logistic regression model. The cut‐off values for the cardiac and renal urine biomarkers included in the multivariate logistic regression model were determined by the median values of each factor.
Furthermore, an ROC curve analysis was also performed in each chronic kidney disease (CKD) or non‐CKD patient as a subgroup analysis. CKD was diagnosed on the basis of the creatinine value observed within 1 year. For patients in whom the creatinine value had not been measured within 1 year before admission, those who had been previously diagnosed with CKD were considered to have CKD. CKD was defined as a syndrome comprising a low glomerular filtration rate (<60 mL/min/1.73 m2) with a history of more than 3 months.15 Patients who did not have medical records at Chiba Hokusoh Hospital for the 3 months before admission were diagnosed with CKD using another institution's data for the 3 months before admission. Kidney damage, as identified by abnormal findings in the urine and imaging tests,15 was used to diagnose CKD in some of the patients in the present study; therefore, CKD was diagnosed only by a low glomerular filtration rate with a history of more than 3 months. In the present study, 163 of 281 patients (58.0%) were diagnosed with CKD.
Statistical analyses
All data were statistically analysed using the SPSS 22.0 J software program (SPSS Japan Institute, Tokyo, Japan). All numerical data were expressed as the median (25–75% interquartile range). The Mann–Whitney U‐test was used to compare two groups, and the Kruskal–Wallis test was used to compare three groups. Normality was assessed using the Shapiro–Wilk W test. Comparisons of all proportions were performed with a χ2 analysis. Significant biomarkers indicating the true‐WRF group were determined by the multivariate logistic regression model. All cardiac and renal urinary biomarkers affecting renal impairment were included in this model. The continuous variables were dichotomized by the all‐patient cohort. ROC curves were calculated to predict the cut‐off values, and the sensitivity, specificity, and AUC were determined. A P‐value < 0.05 was considered to be statistically significant. The prognostic value in terms of the 1000 day all‐cause death and HF events was evaluated using a Cox regression hazard model, and a Kaplan–Meier curve analysis with significant differences calculated using the log‐rank test was performed. All clinically relevant factors affecting the prognosis, including the gender, age (per 1 year increase), SBP (per 10 mmHg increase), total bilirubin (per 1.0 mmol/L increase), sodium (per 1.0 mmol/L increase), C‐reactive protein (per 1.0 mg/dL increase), haemoglobin (per 1.0 mg/dL increase), and LVEF (per 1% increase), were selected for inclusion in the multivariate Cox regression hazard model associated with the 1000 day all‐cause death and HF events in the all‐patient cohort. The multivariate Cox regression hazard model was developed by backward stepwise selection.
Ethical concerns
The Research Ethics Committee of Nippon Medical School Chiba Hokusoh Hospital approved the study protocol.
Results
Patient characteristics and the true worsening renal failure group
The median age was 76 years, and the patient cohort was 66.9% male. The median LVEF on admission was 39%; 185 (65.8%) patients had new‐onset HF, and 216 (76.9%) had NYHA Class IV on admission. The aetiology was ischaemic heart disease in 119 (42.3%) patients.
The relationship between the patients' characteristics on admission and the WRF status is described in Table 1 and Table S1 . The SBP was significantly lower, the lactate level was significantly higher, and the serum levels of sodium and the serum levels of BUN, creatinine, potassium, and C‐reactive protein were significantly higher in the true‐WRF group than in the pseudo‐WRF group. Furthermore, the patients who had massive pleural effusion on chest X‐ray were significantly more frequent, and the rate of administration of nitroglycerin was significantly lower and that of dopamine and dobutamine was significantly higher in the true‐WRF group than in the pseudo‐WRF group (Table 1 and Table S1 ). These results suggest that the true‐WRF patients might include those with severely decompensated AHF (i.e. biventricular HF).
Table 1.
Relationship between the patients' characteristics on admission and worsening renal failure
| Total (n = 281) | Non‐WRF (n = 168) | Pseudo‐WRF (n = 56) | True WRF (n = 57) | P‐value | |
|---|---|---|---|---|---|
| Characteristics | |||||
| Age (years old) | 76 (67–82) | 76 (68–82) | 78 (72–84) | 75 (63–80) | 0.113 |
| Type (new onset, %) | 185 (65.8) | 114 (67.9) | 33 (58.9) | 38 (66.7) | 0.470 |
| Gender (male, %) | 188 (66.9) | 108 (64.3) | 39 (69.6) | 41 (71.9) | 0.507 |
| Aetiology (ischaemia, %) | 119 (42.3) | 92 (45.2) | 19 (33.9) | 24 (42.1) | 0.333 |
| Vital signs and status | |||||
| Systolic blood pressure (mmHg) | 160 (136–186) | 160 (138–181) | 175 (151–199) | 141 (102–174) | <0.001 |
| Heart rate (b.p.m.) | 108 (91–130) | 110 (93–130) | 109 (91–131) | 98 (87–120) | 0.048 |
| LVEF (%) | 39 (28–50) | 38 (28–51) | 40 (31–50) | 40 (27–52) | 0.937 |
| NYHA (IV, %) | 216 (76.9) | 129 (76.8) | 38 (67.9) | 49 (86.0) | 0.074 |
| CKD (yes, %) | 163 (58.0) | 83 (49.4) | 42 (75.0) | 38 (66.7) | 0.001 |
| Laboratory data | |||||
| Total bilirubin (mg/dL) | 0.6 (0.4–0.9) | 0.6 (0.4–0.9) | 0.6 (0.4–0.9) | 0.6 (0.3–1.1) | 0.946 |
| BUN (mg/dL) | 25.8 (18.2–40.2) | 21.8 (16.8–30.8) | 27.1 (19.7–35.6) | 48.5 (34.3–68.0) | <0.001 |
| Creatinine (mg/dL) | 1.18 (0.89–1.88) | 1.02 (0.82–1.30) | 1.31 (1.00–1.99) | 2.13 (1.64–3.17) | <0.001 |
| Sodium (mmol/L) | 140 (137–142) | 140 (138–142) | 140 (139–142) | 139 (133–142) | 0.025 |
| Potassium (mmol/L) | 4.2 (3.8–4.7) | 4.2 (3.8–4.7) | 4.2 (3.8–4.6) | 4.7 (4.1–5.2) | <0.001 |
| Uric acid (mg/dL) | 6.9 (5.5–8.3) | 6.6 (5.3–7.9) | 6.9 (5.4–8.2) | 7.9 (6.4–10.7) | <0.001 |
| Haemoglobin (g/dL) | 12.3 (10.4–13.9) | 12.5 (10.6–14.0) | 12.3 (10.5–13.8) | 11.2 (9.4–13.0) | 0.089 |
| C‐reactive protein (mg/dL) | 0.76 (0.18–3.72) | 0.54 (0.15–2.10) | 0.80 (0.21–4.48) | 1.41 (0.27–5.86) | 0.042 |
| Chest X‐ray | |||||
| Lung congestion (yes, %) | 255 (90.7) | 153 (91.1) | 53 (94.6) | 49 (86.0) | 0.198 |
| Massive pleural effusion (yes, %) | 117 (41.6) | 57 (33.9) | 27 (48.2) | 33 (57.9) | 0.007 |
| Physical findings | |||||
| Peripheral oedema (yes, %) | 152 (54.1) | 84 (50.0) | 34 (60.7) | 34 (59.6) | 0.374 |
| Medication (cases) during ICU | |||||
| Furosemide (yes, %) | 257 (91.5) | 154 (91.7) | 52 (92.9) | 51 (89.5) | 0.804 |
| Nitroglycerin (yes, %) | 136 (48.4) | 84 (50.0) | 30 (53.6) | 22 (38.6) | 0.227 |
| Nicorandil (yes, %) | 50 (17.8) | 32 (19.1) | 11 (19.6) | 7 (12.3) | 0.473 |
| Carperitide (yes, %) | 141 (50.2) | 78 (46.4) | 32 (57.1) | 31 (54.4) | 0.296 |
| Dopamine (yes, %) | 19 (6.8) | 5 (3.0) | 3 (5.4) | 11 (19.3) | <0.001 |
| Dobutamine (yes, %) | 40 (14.2) | 18 (10.7) | 5 (8.9) | 17 (29.8) | 0.001 |
| ACE‐I/ARB (yes, %) | 101 (35.9) | 74 (44.1) | 18 (32.1) | 9 (15.8) | 0.001 |
| Beta‐blocker (yes, %) | 84 (29.9) | 54 (32.1) | 18 (32.1) | 12 (21.1) | 0.264 |
| Spironolactone (yes, %) | 97 (34.5) | 74 (44.0) | 13 (23.2) | 10 (17.5) | <0.001 |
| Outcome | |||||
| ICU hospitalization (days) | 4 (3–5) | 3 (3–5) | 4 (3–5) | 7 (3–11) | <0.001 |
| Total hospitalization (days) | 26 (16–41) | 24 (16–35) | 27 (18–37) | 34 (16–59) | 0.053 |
| In‐hospital mortality (yes, %) | 36 (12.8) | 9 (5.4) | 5 (8.9) | 22 (38.6) | <0.001 |
ACE‐I, angiotensin‐converting enzyme inhibitor; ARB, angiotensin II receptor blocker; BUN, blood urea nitrogen; CKD, chronic kidney disease; ICU, intensive care unit; LVEF, left ventricular ejection fraction measured by echocardiography; NYHA, New York Heart Association; WRF, worsening renal failure.
P‐value, between the three groups, is determined by the Kruskal–Wallis test or the χ2 test. All numerical data were expressed as the median (25–75% interquartile range).
Only the cardiac biomarkers on admission, including BNP, NT‐proBNP, hsTnT, and HFABP, were significantly higher in the true‐WRF group than in the pseudo‐WRF group. The renal urinary biomarkers on admission, including NGAL, LFABP, β2MG, NAG, and albumin, were not significantly different between the true‐WRF group and the pseudo‐WRF group (Table 2). These results suggest that the true‐WRF patients included AHF with cardiac stress rather than renal tubular injury.
Table 2.
Relationship between the cardiac or renal urinary biomarkers on admission and worsening renal failure
| Total (n = 281) | Non‐WRF (n = 168) | Pseudo‐WRF (n = 56) | True WRF (n = 57) | P‐value | |
|---|---|---|---|---|---|
| Cardiac biomarkers | |||||
| BNP (pg/mL) | 735 (441–1563) | 695 (415–1306) | 744 (535–1542) | 1089 (554–2179) | 0.026 |
| NT‐proBNP (pg/mL) | 6219 (2452–13 729) | 5346 (2179–11 364) | 5976 (3029–14 428) | 9258 (6211–34 536) | <0.001 |
| hsTnT (ng/L) | 60 (33–137) | 57 (29–137) | 51 (33–96) | 82 (55–148) | 0.006 |
| HFABP (ng/mL) | 13.8 (8.3–27.7) | 10.7 (7.1–20.1) | 13.3 (9.2–25.5) | 35.5 (19.1–68.1) | <0.001 |
| Renal urinary biomarkers | |||||
| NGAL (ng/mg·cre) | 87.2 (28.3–301.3) | 59.4 (19.2–183.6) | 110.4 (33.0–471.1) | 152.9 (87.2–600.3) | <0.001 |
| LFABP (ng/mg·cre) | 57.9 (14.4–184.8) | 40.3 (10.4–136.7) | 85.4 (25.7–325.5) | 81.8 (30.2–269.0) | 0.009 |
| β2MG (μg/mg·cre) | 671 (156–7178) | 478 (129–2920) | 4273 (282–35 801) | 1052 (192–15 810) | 0.001 |
| NAG (U/mg·cre) | 16.1 (10.0–24.9) | 14.3 (9.3–21.6) | 21.3 (11.3–27.3) | 21.0 (11.9–33.7) | 0.014 |
| Albumin (mg/g·cre) | 493 (151–1950) | 433 (146–1500) | 1034 (331–4592) | 669 (125–2637) | 0.003 |
| Osmolality (mOsm/L) | 433 (370–573) | 477 (381–638) | 444 (382–570) | 376 (336–468) | <0.001 |
BNP, brain‐type natriuretic peptide; HFABP, heart‐type fatty acid‐binding protein; hsTnT, high‐sensitivity troponin T; LFABP, liver fatty acid‐binding protein; NAG, acetyl‐β‐d‐glucosaminidase; NGAL, neutrophil gelatinase‐associated lipocalin; NT‐proBNP, N‐terminal pro‐brain‐type natriuretic peptide; WRF, worsening renal failure; β2MG, β2‐microglobulin.
P‐value, between the three groups, is determined by the Kruskal–Wallis test. All numerical data were expressed as the median (25–75% interquartile range).
The prognosis of the true worsening renal failure patients
The length of ICU hospitalization was 7 (3–11) days in the true‐WRF group, which was significantly longer than in the pseudo‐WRF group. Thirty‐six of the 281 patients died in the hospital, including 22 of the 57 patients (38.6%) in the true‐WRF group, which was significantly greater than in the pseudo‐WRF group. Neither the length of ICU hospitalization nor the rate of in‐hospital mortality differed significantly between the no‐WRF group and pseudo‐WRF group (Table 1).
Sixty‐seven deaths and 129 HF events occurred within 1000 days. The Kaplan–Meier survival curves showed that the prognosis, including the rate of all‐cause death and HF events, was significantly poorer in the true‐WRF group than in the other groups (Figure 2 ). The multivariate Cox regression model also indicated that true WRF was an independent predictor of 1000 day mortality and HF events [hazard ratio: 4.315, 95% confidence interval (CI): 2.466–7.550, P < 0.001 and hazard ratio: 2.834, 95% CI: 1.893–4.243, P < 0.001, respectively] (Table 3). These findings suggest that inclusion in the true‐WRF group in the present study indicated a worse prognosis among AHF patients.
Figure 2.

Kaplan–Meier survival curves for each worsening renal failure (WRF) category. (A) The rate of all‐cause death in the true‐WRF group was significantly (P < 0.001) poorer than that in the pseudo‐WRF and non‐WRF groups. (B) The rate of heart failure (HF) events in the true‐WRF group was significantly (P < 0.001) poorer than that in the pseudo‐WRF and non‐WRF groups.
Table 3.
The univariate and multivariate analyses of the associations between 1000 day all‐cause death and HF event and the clinical findings
| All‐cause death | All‐cause death | HF event | ||||||||||
|---|---|---|---|---|---|---|---|---|---|---|---|---|
| Univariate | Multivariate | Univariate | Multivariate | |||||||||
| HR | 95% CI | P‐value | HR | 95% CI | P‐value | HR | 95% CI | P‐value | HR | 95% CI | P‐value | |
| Status of WRF | ||||||||||||
| Non‐WRF | 1.000 | 1.000 | 1.000 | 1.000 | ||||||||
| Pseudo‐WRF | 1.034 | 0.662–2.711 | 0.416 | 1.932 | 0.933–4.004 | 0.076 | 1.352 | 0.857–2.134 | 0.195 | 1.341 | 0.844–2.133 | 0.215 |
| True WRF | 5.093 | 3.002–8.640 | <0.001 | 4.315 | 2.466–7.550 | <0.001 | 2.768 | 1.855–4.130 | <0.001 | 2.834 | 1.893–4.243 | <0.001 |
| Laboratory data | ||||||||||||
| Age (per 1 year increase) | 1.023 | 0.999–1.047 | 0.062 | 1.036 | 1.010–1.063 | 0.006 | 1.032 | 1.015–1.050 | <0.001 | 1.039 | 1.021–1.058 | <0.001 |
| SBP (per 10 mmHg increase) | 0.819 | 0.767–0.875 | <0.001 | 0.850 | 0.792–0.912 | <0.001 | 0.942 | 0.900–0.986 | 0.011 | |||
| Total bilirubin (per 1 mg/dL increase) | 1.389 | 1.128–1.711 | 0.002 | 1.146 | 0.939–1.399 | 0.181 | ||||||
| Sodium (per 1.0 mmol/L increase) | 0.917 | 0.888–0.948 | <0.001 | 0.947 | 0.918–0.978 | 0.001 | 0.946 | 0.917–0.975 | <0.001 | 0.942 | 0.915–0.970 | <0.001 |
| C‐reactive protein (per 1 mg/dL increase) | 0.996 | 0.974–1.018 | 0.721 | 0.968 | 0.930–1.008 | 0.119 | 1.002 | 0.993–1.012 | 0.621 | |||
| Haemoglobin (per 1.0 mg/dL increase) | 0.896 | 0.814–0.986 | 0.025 | 0.927 | 0.866–0.993 | 0.031 | ||||||
| LVEF (per 1% increase) | 1.000 | 0.987–1.014 | 0.974 | 1.000 | 0.990–1.010 | 0.991 | ||||||
CI, confidence interval; HF, heart failure; HR, hazard ratio; LVEF, left ventricular ejection fraction measured by echocardiography; SBP, systolic blood pressure; WRF, worsening renal failure.
Prediction of true worsening renal failure
The ROC curves are shown in Figure 3 . Regarding cardiac biomarkers, the value of serum HFABP that produced the optimum balance between the sensitivity and specificity to indicate the presence of true WRF (73.7% and 76.8%, respectively; AUC = 0.811, P < 0.001) was 21.9 ng/mL for the overall patients; this value was 40.5 ng/L for serum hsTnT (87.7% and 37.5%; AUC = 0.637, P = 0.001) and 6196 pg/mg for serum NT‐proBNP (75.4% and 55.8%; AUC = 0.673, P < 0.001) (Figure 3A ). All cardiac markers, especially serum HFABP, were able to detect true WRF in AHF patients. However, only the urinary NGAL and urinary NAG were able to detect true WRF, with sensitivity, specificity, and AUC of 76.9%, 55.1%, and 0.677 (P < 0.001) and 53.8%, 66.8%, and 0.591 (P = 0.043), respectively. Furthermore, the urinary biomarkers did not have a generally adequate AUC value for the prediction and detection of true WRF (Figure 3B ). Interestingly, with regard to the non‐CKD patients, only the serum HFABP, serum NT‐proBNP, and urinary NGAL were able to detect true WRF. The AUC of the serum HFABP was particularly high at 0.904 (sensitivity and specificity: 94.7% and 72.7%) Figure 4 . In addition, the results of the multivariate logistic regression model for indicating true WRF found that the specific biomarker was the serum HFABP (≥22.9 ng/mL; odds ratio: 5.472, 95% CI: 2.729–10.972, P < 0.001) (Table 4).
Figure 3.

A receiver operating characteristic (ROC) curve analysis for the prediction of true worsening renal failure (WRF). (A) The ROC curve analysis of the cardiac biomarkers, including the serum heart‐type fatty acid‐binding protein (HFABP) (red line), N‐terminal pro‐brain‐type natriuretic peptide (NT‐proBNP) (blue line), and high‐sensitivity troponin T (hsTnT) (green line), for predicting true WRF. The sensitivity and specificity for indicating the presence of true WRF were 73.7% and 76.8% [area under the ROC curve (AUC) = 0.811, P < 0.001] for serum HFABP, 75.4% and 55.8% (AUC = 0.673, P < 0.001) for serum NT‐proBNP, and 87.7% and 37.5% (AUC = 0.637, P = 0.001) for serum hsTnT, respectively. (B) The ROC curve analysis of the renal urinary biomarkers, including the urinary neutrophil gelatinase‐associated lipocalin (NGAL) (pink line), the urinary liver fatty acid‐binding protein (LFABP) (light blue line), the urinary β2‐microglobulin (β2MG) (light green line), the urinary acetyl‐β‐d‐glucosaminidase (NAG) (orange line), and the urinary albumin (purple line), for predicting true WRF. The sensitivity and specificity for indicating the presence of true WRF was 76.9% and 55.1% (AUC = 0.677, P < 0.001) for urinary NGAL, 84.6% and 31.7% (AUC = 0.578, P = 0.082) for urinary LFABP, 42.3% and 73.7% (AUC = 0.542, P = 0.353) for urinary β2MG, 53.8% and 66.8% (AUC = 0.591, P = 0.043) for urinary NAG, and 25.0% and 85.4% (AUC = 0.495, P = 0.913) for urinary albumin, respectively.
Figure 4.
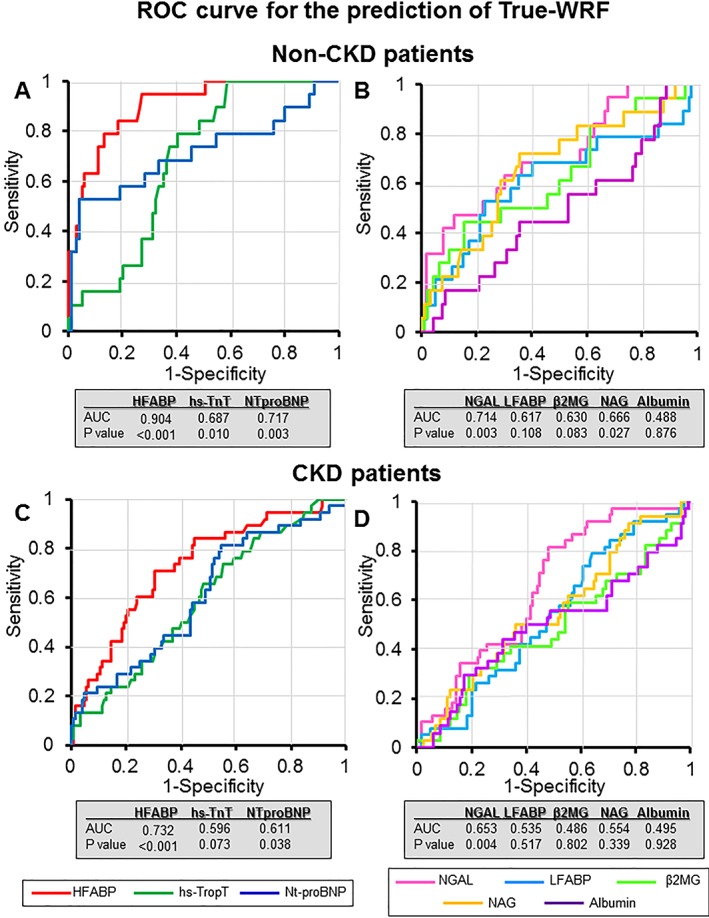
A receiver operating characteristic (ROC) curve analysis for the prediction of true worsening renal failure (WRF) in patients with non‐chronic kidney disease (CKD) and CKD. The ROC curve analysis of the cardiac biomarkers, including the serum heart‐type fatty acid‐binding protein (HFABP) (red line), N‐terminal pro‐brain‐type natriuretic peptide (NT‐proBNP) (blue line), and the high‐sensitivity troponin T (hsTnT) (green line), for predicting true WRF are shown in (A) and (C). The ROC curve analysis of the renal urinary biomarkers, including the urinary neutrophil gelatinase‐associated lipocalin (NGAL) (pink line), urinary liver fatty acid‐binding protein (LFABP) (light blue line), urinary β2‐microglobulin (β2MG) (light green line), urinary acetyl‐β‐d‐glucosaminidase (NAG) (orange line), and urinary albumin (purple line), for predicting true WRF are shown in (B) and (D). (A) The area under the ROC curve (AUC) for serum HFABP, NT‐proBNP, and hsTnT in non‐CKD patients was 0.904 (P < 0.001), 0.687 (P = 0.010), and 0.717 (P = 0.003), respectively. (B) The AUC for urinary NGAL, LFABP, NAG, β2MG, and albumin in non‐CKD patients was 0.714 (P = 0.003), 0.617 (P = 0.108), 0.630 (P = 0.083), 0.666 (P = 0.027), and 0.488 (P = 0.876), respectively. (C) The AUC for serum HFABP, NT‐proBNP, and hsTnT in CKD patients was 0.732 (P < 0.001), 0.596 (P = 0.073), and 0.611 (P = 0.038), respectively. (D) The AUC for urinary NGAL, LFABP, NAG, β2MG, and albumin in CKD patients was 0.653 (P = 0.004), 0.535 (P = 0.517), 0.486 (P = 0.802), 0.554 (P = 0.339), and 0.495 (P = 0.928), respectively
Table 4.
The univariate and multivariate analyses of the associations between true WRF and the biomarkers
| Prediction of true WRF | Univariate analysis | Multivariate analysis | ||||
|---|---|---|---|---|---|---|
| OR | 95% CI | P‐value | OR | 95% CI | P‐value | |
| Cardiac biomarkers | ||||||
| HFABP (≥22.9 ng/mL) | 7.783 | 4.076–14.859 | <0.001 | 5.472 | 2.729–10.972 | <0.001 |
| hsTnT (≥19.1 ng/mg·cre) | 2.865 | 1.533–5.356 | 0.001 | |||
| NT‐proBNP (≥19.9 U/mg·cre) | 3.535 | 1.853–6.744 | <0.001 | 2.296 | 1.105–4.770 | 0.026 |
| Renal urinary biomarkers | ||||||
| NGAL (≥89.0 ng/mg·cre) | 3.600 | 1.887–6.868 | <0.001 | 2.722 | 1.320–5.615 | 0.007 |
| LFABP (≥58.8 ng/mg·cre) | 1.803 | 0.995–3.267 | 0.052 | |||
| β2MG (≥19.9 U/mg·cre) | 1.337 | 0.725–2.464 | 0.353 | |||
| NAG (≥16.1 U/mg·cre) | 1.474 | 0.797–2.724 | 0.216 | |||
| Albumin (≥36.7 ng/mg·cre) | 1.091 | 0.593–2.005 | 0.780 | |||
CI, confidence interval; HFABP, heart‐type fatty acid binding; hsTnT, high‐sensitivity troponin T; LFABP; liver fatty acid‐binding protein; NAG, acetyl‐β‐d‐glucosaminidase; NGAL; neutrophil gelatinase‐associated lipocalin; NT‐proBNP, N‐terminal pro‐brain‐type natriuretic peptide; OR, odds ratio; WRF, worsening renal failure; β2MG, β2‐microglobulin.
Discussion
We demonstrated in the present study that cardiac markers, especially the serum HFABP level, were more effective markers for predicting the development of true WRF during the first 7 days after admission than renal urinary biomarkers in patients with AHF. The prediction of true WRF, which is associated with adverse long‐term outcomes, may be more reliable using a marker of cardiac injury and/or congestion than using a marker of renal tubular injury. These results suggest that the true‐WRF group included patients with severe AHF who developed severe congestion and cardiac failure (i.e. biventricular HF) at admission rather than those with renal tubular injury. Cardiac dysfunction induces renal impairment, which presents as cardiorenal syndrome.16 The results of the present study might support the importance of cardiorenal syndrome for the evaluation of true‐WRF patients with AHF.
We would like to discuss in detail the following two topics: (i) the mechanisms that can predict the true WRF using cardiac markers and (ii) why the serum HFABP is the most reliable cardiac marker, being even more reliable than NT‐proBNP and hsTnT (Figure 3 and 4 ).
Mechanisms underlying true worsening renal failure in acute heart failure
Worsening renal failure has been defined as a change in the serum creatinine level of ≥0.3 mg/mL in most reports, and this definition has long been established as the gold standard and shown to be associated with an increased risk of long‐term all‐cause/cardiovascular mortality and morbidity in AHF patients.1, 2, 17, 18 However, WRF alone was found to have no prognostic value in patients with hospitalized AHF in a recent report.7 Such patients who did not have an adverse outcome were therefore defined as pseudo‐WRF, and the importance of defining true WRF that is associated with an adverse outcome was suggested.8 WRF is involved in various mechanisms underlying acute renal impairment in AHF. Therefore, it is important to clarify the specific mechanisms that lead to adverse outcomes and predict the true‐WRF patients on the basis of these mechanisms. WRF patients who had increased cardiac markers on admission were found to have worse outcomes in the present study than those without such increases, suggesting that mechanisms such as cardiorenal syndrome might be important for predicting true WRF in AHF.
Increased values of cardiac marker can indicate excessive cardiac, lung, and general congestion at admission, that is, patients with a severe cardiac status and biventricular HF. These patients are usually complicated with renal congestion, so excessive general congestion, including renal congestion, on admission might be one mechanism underlying true WRF. Indeed, the patients who had massive pleural effusion were more likely to be in the true‐WRF group, suggesting that patients with biventricular HF were more likely to be true‐WRF patients. Severely cardiac ill patients with renal congestion who develop WRF despite aggressive decongestive treatment may suffer an adverse outcome. In the present study, decongestion was difficult during the first 7 days in AHF patients who were severely cardiac ill on admission.
Traditionally, renal impairment has been attributed to hypoperfusion of the kidney due to progressive impairment of the cardiac output or intravascular volume depletion secondary to the aggressive use of diuretics.19 However, attention has shifted from cardiac output (‘forward failure’) to venous congestion (‘backward failure’) as the most important haemodynamic determinant.4 The development of ‘congestive kidney failure’ induced by the increased renal venous pressure arising from venous congestion (increased renal afterload) and increased renal interstitial pressure (intrinsic renal compromise) was reported as an important mechanism in AHF patients.4 Renal congestion can be also caused by cardiorenal syndrome, which may be a key factor influencing the renal impairment of AHF patients. Metra et al. reported that patients who had WRF and persistent signs of congestion at the time of discharge had an increased risk of death and death or rehospitalization, and WRF with persistent congestion was an independent predictor of a poor outcomes.7 These findings suggest that the presence of renal congestion might be a key factor for identifying true‐WRF patients.
We previously defined acute renal impairment at admission as ‘AKI on admission’3 and described it as an independent predictor of an adverse long‐term prognosis in AHF patients.10 The key mechanism underlying AKI on admission may be renal congestion, as AHF patients usually have excessive cardiac, lung, and general congestion at admission. In the present study, true WRF was defined as AKI following WRF. We therefore assumed the renal congestion on admission following WRF was the true‐WRF group in AHF.
As mentioned previously, excessive congestion with WRF might be key factors influencing the adverse outcome in AHF patients. Excessive congestion can be caused by severely decompensated AHF (i.e. severe cardiac failure). Therefore, the identification of a diagnostic biomarker that can reflect heart congestion might be particularly useful for predicting true WRF among AHF patients. Cardiac stress markers, not renal injury markers, were therefore deemed suitable for evaluation regarding their utility for predicting true WRF.
Mechanisms underlying the increasing serum heart‐type fatty acid‐binding protein levels and true worsening renal failure
Several reasons may explain why the serum HFABP was able to predict true AKI in AHF patients.
First, the serum level of HFABP indicates the presence of latent and ongoing cardiomyocyte damage and is a sensitive marker of minor myocardial injury in patients with AHF.20 HFABP is rapidly released into the circulation when the myocardium is injured, and this tissue can be easily injured by sudden volume and pressure overload (i.e. heart congestion). HFABP is mainly present in the myocardium and is rapidly released by myocardial ischaemia and necrosis, oxidative stress, and apoptosis. Therefore, severely decompensated cardiac failure (i.e. biventricular HF) is a candidate mechanism underlying the increased levels of serum HFABP. These conditions might also be the main stimuli for HFABP serum release in AHF.21 Indeed, the serum HFABP level was elevated in all AHF patients in our study and would likely be even more highly elevated in severely decompensated AHF. The usefulness of HFABP as a biomarker for the detection of true WRF was mainly driven by the molecule's biochemistry during myocardial injury. Biventricular HF (i.e. severely decompensated AHF) can easily induce renal congestion, and the serum HFABP was elevated in patients with biventricular HF by severe cardiac stress.
Second, the serum level of HFABP might reflect the injury of the distal tubular cells. In 1992, the presence of two types of fatty acid‐binding protein was detected in the kidney: HFABP, located in the distal tubular cells, and LFABP, located in the proximal cells.22, 23 HFABP is released early following tissue injury to the kidneys, especially the distal tubular cells.22 It was shown to be involved in free fatty acid transport from the cytosol to mitochondria and was mainly found in the urine.24 It can be used as a biomarker for detecting ischaemic injury in the kidney perfusates of donor or rat models of gentamicin‐induced renal damage.25 Increased HFABP release has been associated with ischaemic kidney tissue injury.26 However, the relationship between elevated serum HFABP levels and distal tubular cell injury has been underreported, and trivial distal tubular cell injury might contribute to the elevation of serum HFABP levels in AHF.
Finally, it was suggested that HFABP accumulated in the glomerular podocytes of clinical and experimental models of obesity‐related glomerulopathy.27 Therefore, if the serum HFABP levels are extremely high due to myocardial injury, HFABP might be accumulated in glomerular podocytes, which may lead to kidney injury. Although the increased expression of HFABP has not been reported in cardiovascular patients, this possibility should be explored in future studies.
As mentioned previously, serum HFABP levels might also be increased by renal mechanisms (distal tubular injury), and elevated HFABP levels might be induced by the glomerular injury. Although the serum hsTnT and NT‐proBNP levels are also candidates for the detection of myocardial injury, mechanisms of increase due to kidney involvement have never been reported. Therefore, the serum HFABP might be the most effective and reasonable marker for use in detecting true WRF in AHF patients.
Study limitations
The present study is associated with several limitations. First, this was a retrospective study that was performed in a single centre. It is therefore possible that unmeasured variables or missing data affected the results. Second, our study population was limited to patients who were admitted to the ICU; thus, AHF patients who were admitted to general wards were excluded from this study. The patients were treated in a ‘closed ICU’ in our institute. All of the physicians in our ‘closed ICU’ are cardiologists. Thus, the majority of patients with severely decompensated AHF were admitted to the ICU. These patients were almost certain exposed to critical stimuli in the emergency room on admission, and serum and urinary biomarkers might be easily increased in such critical situations. The AHF patients admitted to the general ward might be less strongly affected by critical stimuli than them admitted to the ICU, and the urinary and serum biomarkers were not increased in these patients compared with the AHF patients who required intensive care. Our main result might have been affected by this inclusion criterion in the present study. Third, no urine volume criteria were used for the definition of AKI in the present study. The definition of AKI used in the present study was based on the presence of AKI on admission; therefore, it was impossible to include urinary criteria. Fourth, we did not present sufficient haemodynamic data (i.e. central venous pressure and pulmonary artery wedge pressure) in the present study. The aim of the present study was to predict true WRF using samples collected within 15 min after admission. Therefore, the data on admission (i.e. emergency room) might be important for evaluating patients' conditions. As the haemodynamics are easily affected by the first treatment received in the emergency room, comparing the biomarker or AKI at admission and the haemodynamic data after treatment makes no sense. It might be a major limitation to discuss the mechanisms of true WRF in the present study. Finally, the method by which the HFABP level was evaluated by the DS Pharma Biomedical changed completely from July 2012. We therefore switched our method from a MARKIT‐M HFABP ELISA Kit to a LIBLIA HFABP latex agglutination turbidimetric immunoassay. This difference in methods was a major limitation of the present study; however, the results from each method showed good correlation (r = 0.994). The values of HFABP obtained from these different methods would therefore not have been markedly different.
Conclusions
The serum HFABP level was the most useful marker for predicting true WRF associated with all‐cause death within 1000 days. Inclusion in the true‐WRF group might reflect a severe HF status among patients with AHF.
Conflict of interest
The authors declare no conflicts of interest in association with the present study.
Funding
None declared.
Supporting information
Table S1. Relationship between the patients' characteristics on admission and WRF.
Acknowledgements
We are grateful to the staff of the ICU and the Medical Records Office at Nippon Medical School Chiba Hokusoh Hospital for collecting the medical data.
Shirakabe A., Hata N., Kobayashi N., Okazaki H., Matsushita M., Shibata Y., Uchiyama S., Sawatani T., Asai K., and Shimizu W. (2019) Worsening renal failure in patients with acute heart failure: the importance of cardiac biomarkers, ESC Heart Failure, 6: 416–427. 10.1002/ehf2.12414.
References
- 1. Cowie MR, Komajda M, Murray‐Thomas T, Underwood J, Ticho B, Investigators P . Prevalence and impact of worsening renal function in patients hospitalized with decompensated heart failure: results of the prospective outcomes study in heart failure (POSH). Eur Heart J 2006; 27: 1216–1222. [DOI] [PubMed] [Google Scholar]
- 2. Kociol RD, Greiner MA, Hammill BG, Phatak H, Fonarow GC, Curtis LH, Hernandez AF. Long‐term outcomes of Medicare beneficiaries with worsening renal function during hospitalization for heart failure. Am J Cardiol 2010; 105: 1786–1793. [DOI] [PubMed] [Google Scholar]
- 3. Hata N, Yokoyama S, Shinada T, Kobayashi N, Shirakabe A, Tomita K, Kitamura M, Kurihara O, Takahashi Y. Acute kidney injury and outcomes in acute decompensated heart failure: evaluation of the RIFLE criteria in an acutely ill heart failure population. Eur J Heart Fail 2010; 12: 32–37. [DOI] [PubMed] [Google Scholar]
- 4. Mullens W, Abrahams Z, Francis GS, Sokos G, Taylor DO, Starling RC, Young JB, Tang WH. Importance of venous congestion for worsening of renal function in advanced decompensated heart failure. J Am Coll Cardiol 2009; 53: 589–596. [DOI] [PMC free article] [PubMed] [Google Scholar]
- 5. Forman DE, Butler J, Wang Y, Abraham WT, O'Connor CM, Gottlieb SS, Loh E, Massie BM, Rich MW, Stevenson LW, Young JB, Krumholz HM. Incidence, predictors at admission, and impact of worsening renal function among patients hospitalized with heart failure. J Am Coll Cardiol 2004; 43: 61–67. [DOI] [PubMed] [Google Scholar]
- 6. Nunez J, Minana G, Santas E, Bertomeu‐Gonzalez V. Cardiorenal syndrome in acute heart failure: revisiting paradigms. Rev Esp Cardiol 2015; 68: 426–435. [DOI] [PubMed] [Google Scholar]
- 7. Metra M, Davison B, Bettari L, Sun H, Edwards C, Lazzarini V, Piovanelli B, Carubelli V, Bugatti S, Lombardi C, Cotter G, Dei Cas L. Is worsening renal function an ominous prognostic sign in patients with acute heart failure? The role of congestion and its interaction with renal function. Circ Heart Fail 2012; 5: 54–62. [DOI] [PubMed] [Google Scholar]
- 8. Sokolski M, Zymlinski R, Biegus J, Siwolowski P, Nawrocka‐Millward S, Todd J, Yerramilli MR, Estis J, Jankowska EA, Banasiak W, Ponikowski P. Urinary levels of novel kidney biomarkers and risk of true worsening renal function and mortality in patients with acute heart failure. Eur J Heart Fail 2017; 19: 760–767. [DOI] [PubMed] [Google Scholar]
- 9. Shirakabe A, Hata N, Kobayashi N, Shinada T, Tomita K, Tsurumi M, Matsushita M, Okazaki H, Yamamoto Y, Yokoyama S, Asai K, Mizuno K. Long‐term prognostic impact after acute kidney injury in patients with acute heart failure. Int Heart J 2012; 53: 313–319. [DOI] [PubMed] [Google Scholar]
- 10. Shirakabe A, Hata N, Kobayashi N, Shinada T, Tomita K, Tsurumi M, Matsushita M, Okazaki H, Yamamoto Y, Yokoyama S, Asai K, Mizuno K. Prognostic impact of acute kidney injury in patients with acute decompensated heart failure. Circ J: Off J Jpn Circ Soc 2013; 77: 687–696. [DOI] [PubMed] [Google Scholar]
- 11. Shirakabe A, Hata N, Kobayashi N, Okazaki H, Matsushita M, Shibata Y, Nishigoori S, Uchiyama S, Asai K, Shimizu W. Worsening renal function definition is insufficient for evaluating acute renal failure in acute heart failure. ESC Heart Failure 2018; 5: 322–331. [DOI] [PMC free article] [PubMed] [Google Scholar]
- 12. Ponikowski P, Voors AA, Anker SD, Bueno H, Cleland JG, Coats AJ, Falk V, Gonzalez‐Juanatey JR, Harjola VP, Jankowska EA, Jessup M, Linde C, Nihoyannopoulos P, Parissis JT, Pieske B, Riley JP, Rosano GM, Ruilope LM, Ruschitzka F, Rutten FH, van der Meer P, Authors/Task Force M , Document R . 2016 ESC guidelines for the diagnosis and treatment of acute and chronic heart failure: the Task Force for the diagnosis and treatment of acute and chronic heart failure of the European Society of Cardiology (ESC). Developed with the special contribution of the Heart Failure Association (HFA) of the ESC. Eur J Heart Fail 2016; 18: 891–975. [DOI] [PubMed] [Google Scholar]
- 13. Thambidorai SK, Parakh K, Martin DO, Shah TK, Wazni O, Jasper SE, Van Wagoner DR, Chung MK, Murray RD, Klein AL. Relation of C‐reactive protein correlates with risk of thromboembolism in patients with atrial fibrillation. Am J Cardiol 2004; 94: 805–807. [DOI] [PubMed] [Google Scholar]
- 14. KDIGO . Clinical practice guideline for acute kidney injury. Kidney Int Suppl 2012; 2: 1–138. [Google Scholar]
- 15. Iseki K. Chronic kidney disease in Japan. Intern Med 2008; 47: 681–689. [DOI] [PubMed] [Google Scholar]
- 16. Ronco C, Haapio M, House AA, Anavekar N, Bellomo R. Cardiorenal syndrome. J Am Coll Cardiol 2008; 52: 1527–1539. [DOI] [PubMed] [Google Scholar]
- 17. Patel UD, Greiner MA, Fonarow GC, Phatak H, Hernandez AF, Curtis LH. Associations between worsening renal function and 30‐day outcomes among Medicare beneficiaries hospitalized with heart failure. Am Heart J 2010; 160: 132–138 e131. [DOI] [PMC free article] [PubMed] [Google Scholar]
- 18. Metra M, Nodari S, Parrinello G, Bordonali T, Bugatti S, Danesi R, Fontanella B, Lombardi C, Milani P, Verzura G, Cotter G, Dittrich H, Massie BM, Dei Cas L. Worsening renal function in patients hospitalised for acute heart failure: clinical implications and prognostic significance. Eur J Heart Fail 2008; 10: 188–195. [DOI] [PubMed] [Google Scholar]
- 19. Ljungman S, Laragh JH, Cody RJ. Role of the kidney in congestive heart failure. Relationship of cardiac index to kidney function. Drugs 1990; 39: 10–21 discussion 22–14. [DOI] [PubMed] [Google Scholar]
- 20. Hoffmann U, Espeter F, Weiss C, Ahmad‐Nejad P, Lang S, Brueckmann M, Akin I, Neumaier M, Borggrefe M, Behnes M. Ischemic biomarker heart‐type fatty acid binding protein (hFABP) in acute heart failure—diagnostic and prognostic insights compared to NT‐proBNP and troponin I. BMC Cardiovasc Disord 2015; 15: 50. [DOI] [PMC free article] [PubMed] [Google Scholar]
- 21. Azzazy HM, Pelsers MM, Christenson RH. Unbound free fatty acids and heart‐type fatty acid‐binding protein: diagnostic assays and clinical applications. Clin Chem 2006; 52: 19–29. [DOI] [PubMed] [Google Scholar]
- 22. Maatman RG, van de Westerlo EM, van Kuppevelt TH, Veerkamp JH. Molecular identification of the liver‐ and the heart‐type fatty acid‐binding proteins in human and rat kidney. Use of the reverse transcriptase polymerase chain reaction. Biochem J 1992; 288: 285–290. [DOI] [PMC free article] [PubMed] [Google Scholar]
- 23. Maatman RG, Van Kuppevelt TH, Veerkamp JH. Two types of fatty acid‐binding protein in human kidney. Isolation, characterization and localization. Biochem J 1991; 273: 759–766. [DOI] [PMC free article] [PubMed] [Google Scholar]
- 24. Veerkamp JH, van Moerkerk HT. Fatty acid‐binding protein and its relation to fatty acid oxidation. Mol Cell Biochem 1993; 123: 101–106. [DOI] [PubMed] [Google Scholar]
- 25. Jochmans I, Moers C, Smits JM, Leuvenink HG, Treckmann J, Paul A, Rahmel A, Squifflet JP, van Heurn E, Monbaliu D, Ploeg RJ, Pirenne J. Machine perfusion versus cold storage for the preservation of kidneys donated after cardiac death: a multicenter, randomized, controlled trial. Ann Surg 2010; 252: 756–764. [DOI] [PubMed] [Google Scholar]
- 26. Pelsers MM, Hermens WT, Glatz JF. Fatty acid‐binding proteins as plasma markers of tissue injury. Clin Chim Acta; Int J Clin Chem 2005; 352: 15–35. [DOI] [PubMed] [Google Scholar]
- 27. Chen HM, Zheng CX, Gao Q, Ge YC, Liu ZH. Heart‐type fatty acid binding protein is associated with proteinuria in obesity. PLoS One 2012; 7: e45691. [DOI] [PMC free article] [PubMed] [Google Scholar]
Associated Data
This section collects any data citations, data availability statements, or supplementary materials included in this article.
Supplementary Materials
Table S1. Relationship between the patients' characteristics on admission and WRF.