

The combination of the hepatitis C virus (HCV) nonstructural protein 5A (NS5A) inhibitor elbasvir and the NS3/4A protease inhibitor grazoprevir is a potent, once-daily therapy indicated for the treatment of chronic HCV infection in individuals coinfected with human immunodeficiency virus (HIV). We explored the pharmacokinetic interactions of elbasvir and grazoprevir with ritonavir and ritonavir-boosted HIV protease inhibitors in three phase 1 trials.
KEYWORDS: virology, elbasvir, grazoprevir, ritonavir, atazanavir, lopinavir, darunavir
ABSTRACT
The combination of the hepatitis C virus (HCV) nonstructural protein 5A (NS5A) inhibitor elbasvir and the NS3/4A protease inhibitor grazoprevir is a potent, once-daily therapy indicated for the treatment of chronic HCV infection in individuals coinfected with human immunodeficiency virus (HIV). We explored the pharmacokinetic interactions of elbasvir and grazoprevir with ritonavir and ritonavir-boosted HIV protease inhibitors in three phase 1 trials. Drug-drug interaction trials with healthy participants were conducted to evaluate the effect of ritonavir on the pharmacokinetics of grazoprevir (n = 10) and the potential two-way pharmacokinetic interactions of elbasvir (n = 30) or grazoprevir (n = 39) when coadministered with ritonavir-boosted atazanavir, lopinavir, or darunavir. Coadministration of ritonavir with grazoprevir increased grazoprevir exposure; the geometric mean ratio (GMR) for grazoprevir plus ritonavir versus grazoprevir alone area under the concentration-time curve from 0 to 24 h (AUC0–24) was 1.91 (90% confidence interval [CI]; 1.31 to 2.79). Grazoprevir exposure was markedly increased with coadministration of atazanavir-ritonavir, lopinavir-ritonavir, and darunavir-ritonavir, with GMRs for grazoprevir AUC0–24 of 10.58 (90% CI, 7.78 to 14.39), 12.86 (90% CI, 10.25 to 16.13), and 7.50 (90% CI, 5.92 to 9.51), respectively. Elbasvir exposure was increased with coadministration of atazanavir-ritonavir, lopinavir-ritonavir, and darunavir-ritonavir, with GMRs for elbasvir AUC0–24 of 4.76 (90% CI, 4.07 to 5.56), 3.71 (90% CI, 3.05 to 4.53), and 1.66 (90% CI, 1.35 to 2.05), respectively. Grazoprevir and elbasvir had little effect on atazanavir, lopinavir, and darunavir pharmacokinetics. Coadministration of elbasvir-grazoprevir with atazanavir-ritonavir, lopinavir-ritonavir, or darunavir-ritonavir is contraindicated, owing to an increase in grazoprevir exposure. Therefore, HIV treatment regimens without HIV protease inhibitors should be considered for HCV/HIV-coinfected individuals who are being treated with elbasvir-grazoprevir.
INTRODUCTION
Globally, 2.3 million people infected with human immunodeficiency virus (HIV) also are infected with hepatitis C virus (HCV) (1). Chronic HCV infection is a major cause of morbidity and death in individuals coinfected with HIV and HCV (2). HCV/HIV-coinfected people are at 2-fold greater risk for cirrhosis and 6-fold greater risk for decompensated liver disease than are people with HIV infection who are not coinfected with HCV (3). These risks are even higher among coinfected individuals with low CD4 T lymphocyte cell counts (4). People with HCV/HIV coinfection may have more rapid progression to AIDS and AIDS-related death (5). Therefore, treatment of HCV infection in the HIV-infected population represents an important unmet medical need.
Elbasvir (EBR) is a small-molecule inhibitor of HCV nonstructural protein 5A (NS5A), and grazoprevir (GZR) is a reversible, noncovalent, competitive inhibitor of the HCV NS3/4A protease (6, 7). The fixed-dose combination of EBR and GZR is indicated for the treatment of chronic HCV genotype 1 or 4 infection (8, 9), and it displayed high efficacy in people with chronic HCV infection in phase 3 clinical trials (10–13). In particular, EBR/GZR administered for 12 weeks achieved sustained HCV virologic response rates of 96% in a phase 3 trial of people with HCV genotype 1, 4, or 6 infection and HIV coinfection (14). Following oral administration, EBR has a time to maximum concentration (Tmax) of ∼3 h, with a mean half-life (t1/2) of ∼24 h (8, 9). EBR elimination is mediated by both cytochrome P450 3A (CYP3A) metabolism and excretion of the parent compound (8, 9). Elimination of EBR into urine is negligible. EBR is a substrate of CYP3A and P-glycoprotein (P-gp), is an inhibitor of intestinal breast cancer resistance protein (BCRP), and minimally inhibits intestinal P-gp. EBR does not inhibit CYP3A (8, 9). Following oral administration, GZR has a Tmax of ∼2 h and undergoes rapid uptake into the liver via organic-anion-transporting polypeptide 1B (OATP1B) (8, 9). The mean t1/2 of GZR is ∼31 h (8, 9). GZR is eliminated predominantly into feces as the parent compound and as CYP3A oxidative metabolites. In addition to OATP1B and CYP3A, GZR is a substrate of P-gp, a weak CYP3A inhibitor, and a BCRP inhibitor (8, 9, 15). Based on their t1/2 values, EBR and GZR are expected to reach state steady state within 7 days following once-daily administration.
Several recommended antiretroviral treatment regimens for HIV infection include boosted protease inhibitors, such as atazanavir (ATV), darunavir (DRV), and lopinavir (LPV). One booster agent with which these HIV protease inhibitors are often coadministered is ritonavir (RTV) (100 mg), which inhibits CYP3A metabolism and intestinal P-gp transport, thereby increasing the exposure of the HIV protease inhibitors, which are predominantly cleared via CYP3A metabolism (4). Based on in vitro data and the associated R values, RTV is not predicted to be an inhibitor of OATP1B at the 100-mg twice-daily dose. In contrast, data suggest that ATV, DRV, and LPV, when not coadministered with RTV, inhibit OATP1B. Therefore, the HIV protease inhibitor-RTV combination regimens have the potential to inhibit CYP3A, P-gp, and OATP1B (16, 17).
Because treatment of HCV/HIV coinfection represents an important unmet medical need and because the overlapping and inhibitory metabolic pathways of CYP3A, P-gp, and OATP1B for elbasvir-grazoprevir (EBR/GZR) and HIV protease inhibitors suggest the potential for drug interactions, the effects of multiple doses of RTV, atazanavir-ritonavir (ATV/RTV), lopinavir-ritonavir (LPV/RTV), and darunavir-ritonavir (DRV/RTV) on GZR and EBR pharmacokinetics (PK) were evaluated in three separate open-label trials, one trial assessing the effect of RTV on GZR PK (trial 1; Merck trial no. MK-5172-PN006 [EudraCT identification no. 2011-001242-15]) and two trials assessing the potential two-way PK interactions of GZR (trial 2; Merck trial no. MK-5172-PN029) or EBR (trial 3; Merck trial no. MK-8742 PN017) when coadministered with the RTV-boosted HIV protease inhibitors (ATV, LPV, or DRV).
(Portions of these data were presented at the 64th Annual Meeting of the American Association for the Study of Liver Diseases, Washington, DC, 1 to 5 November 2013 [18], and at the 2014 Conference on Retroviruses and Opportunistic Infections, Boston, MA, 3 to 6 March 2014 [19].)
RESULTS
Trial populations.
In trial 1, 10 healthy male participants were enrolled and all participants completed the trial per protocol. In trial 2, 39 participants were enrolled (13 per each arm) and 35 completed the trial. Two participants discontinued in the ATV arm, 1 who discontinued secondary to an adverse event (AE) and 1 who was lost to follow-up monitoring. Two participants discontinued in the DRV arm, 1 secondary to an AE and 1 because of a trial violation. In trial 3, 30 participants were enrolled (10 per arm) and 23 completed the trial per protocol. Three participants discontinued due to AEs (1 from each arm), 2 were lost to follow-up monitoring (1 each in the ATV arm and the DRV arm), 1 was withdrawn by the investigator (ATV arm), and 1 withdrew consent (DRV arm). Participant characteristics for each trial are summarized in Table 1.
TABLE 1.
Participant characteristics
| Characteristic | GZR + RTV (n = 10) | GZR + ATV/RTV (n = 13) | GZR + LPV/RTV (n = 13) | GZR + DRV/RTV (n = 13) | EBR + ATV/RTV (n = 10) | EBR + LPV/RTV (n = 10) | EBR + DRV/RTV (n = 10) |
|---|---|---|---|---|---|---|---|
| Sex (no. [%]) | |||||||
| Male | 10 (100) | 9 (69) | 7 (54) | 9 (69) | 6 (60) | 6 (60) | 6 (60) |
| Female | 0 | 4 (31) | 6 (46) | 4 (31) | 4 (40) | 4 (40) | 4 (40) |
| Race (no. [%]) | |||||||
| White | 10 (100) | 11 (84) | 10 (100) | 12 (92) | 8 (80) | 9 (90) | 9 (90) |
| Black | 0 | 1 (8) | 0 | 1 (8) | 2 (20) | 1 (10) | 0 |
| Asian | 0 | 1 (8) | 0 | 0 | 0 | 1 (10) | |
| Ethnicity (no. [%]) | |||||||
| Hispanic/Latino | 0 | 10 (77) | 13 (100) | 12 (92) | 2 (20) | 1 (10) | 1 (10) |
| Non-Hispanic/non-Latino | 10 (100) | 3 (23) | 0 | 1 (8) | 8 (80) | 8 (80) | 8 (80) |
| Unknown | 0 | 0 | 0 | 0 | 0 | 1 (10) | 1 (10) |
| Age (mean [range]) (yr) | 30.7 (24–44) | 40 (25–49) | 37 (19–47) | 44 (28–55) | 31 (20–48) | 35 (21– 52) | 34 (23–49) |
| Weight (mean [range]) (kg) | 78.9 (71.0–94.2) | 75.0 (53.4–96.9) | 72.2 (51.7–85.5) | 74.8 (54.0–92.3) | 75.4 (58.6–90.9) | 78.5 (58.8–109.7) | 78.8 (53.9–101.9) |
| Body mass index (mean [range]) (kg/m2) | 25.1 (22.4– 29.9) | 25.8 (24.4– 29.5) | 27.3 (24.2– 29.7) | 26.6 (22.4–29.8) | 24.5 (19.0–30.5) | 26.0 (21.6–30.5) | 26.2 (20.0–31.9) |
Pharmacokinetics.
(i) Trial 1 (GZR/RTV). Coadministration of RTV with GZR increased the single-dose GZR area under the concentration-time curve from 0 to infinity (AUC0–∞) and the plasma concentration at 24 h (C24) by approximately 2-fold (Table 2 and Fig. 1). The median Tmax of GZR was unaffected by coadministration of GZR with RTV (Table 2).
TABLE 2.
Comparison of GZR plasma PK following the administration of a single oral dose of 200 mg GZR with or without the coadministration of multiple, twice-daily, oral doses of 100 mg RTV for 15 days to healthy adult participants (trial 1)
| PK parameter | GZRa (GM [95% CI]) (n = 10) | GZR + RTVb (GM [95% CI]) (n = 10) | GZR + RTV vs GZR (GMR [90% CI]) | rMSEc |
|---|---|---|---|---|
| AUC0–∞ (μM × h)d | 1.50 (2.03–2.19) | 3.05 (2.09–4.44) | 2.03 (1.60–2.56) | 0.286 |
| Cmax (μM)d | 0.202 (0.115–0.355) | 0.232 (0.132–0.407) | 1.15 (0.60–2.18) | 0.782 |
| C24 (nM)d | 10.7 (7.15–15.8) | 20.0 (13.4–29.8) | 1.88 (1.65–2.14) | 0.157 |
| Tmax (h)e | 4.0 (1.0–6.0) | 4.0 (1.5–6.0) |
A single oral dose of 200 mg GZR.
Doses of 100 mg RTV twice daily on days 1 to 21 coadministered with a single oral dose of 200 mg GZR on day 15.
The square root of mean squared error (rMSE) (residual error) from the linear mixed-effect model times 100% approximates the within-subject percent coefficient of variation (CV) on the raw scale.
Back-transformed least-squares mean (ratio) and CI from a linear mixed-effects model with natural-log-transformed values.
Median and range are reported for Tmax.
FIG 1.
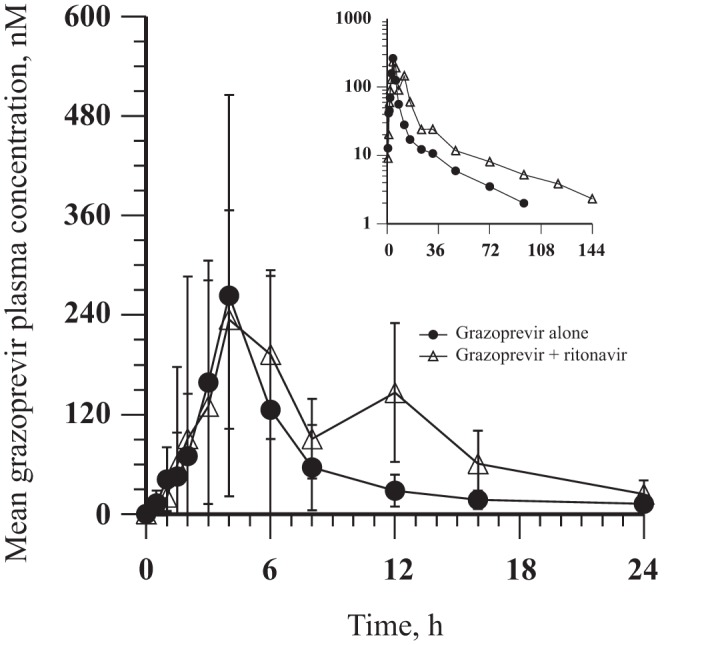
GZR arithmetic mean ± SD plasma concentration-time profiles following administration of a single oral dose of 200 mg GZR with and without the coadministration of multiple, twice-daily, oral doses of 100 mg RTV for 15 days to healthy adult participants (n = 10) (inset, semilog scale).
(ii) Trial 2 (GZR/HIV protease inhibitor/RTV). GZR exposure was increased when GZR was coadministered with each of the three HIV protease inhibitor-RTV combinations, with GZR area under the concentration-time curve from 0 to 24 h (AUC0–24) exposures being 8 to 13 times higher than when GZR was administered alone (Table 3 and Fig. 2). The median Tmax of GZR administered alone was generally comparable to that observed when GZR was coadministered with RTV-boosted HIV protease inhibitors.
TABLE 3.
Comparisons of GZR plasma PK following coadministration of 200 mg GZR once daily and 300 mg ATV/100 mg RTV once daily, 400 mg LPV/100 mg RTV twice daily, or 600 mg DRV/100 mg RTV twice daily for 7 days versus administration of 200 mg GZR once daily for 7 days to healthy adult participants (trial 2)
| PK parameter | GM (95% CI) | GM (95% CI) | GMR (90% CI) | Pseudo-within-subject CV (%)a |
|---|---|---|---|---|
| GZR/ATV/RTVb | GZR (n = 12) | GZR + ATV/RTV (n = 11)c | GZR + ATV/RTV vs GZR | |
| AUC0–24 (μM × h)d | 3.38 (2.26–5.05) | 35.7 (26.1–49.0) | 10.58 (7.78–14.39) | 40.5 |
| Cmax (μM)d | 0.952 (0.573–1.58) | 5.94 (4.48–7.87) | 6.24 (4.42–8.81) | 46.1 |
| C24 (nM)d | 14.7 (10.7–20.2) | 171 (104–280) | 11.64 (7.96–17.02) | 48.9 |
| Tmax (h)e | 2.50 (2.00–5.00) | 3.00 (2.00–4.00) | ||
| GZR/LPV/RTVf | GZR (n = 13) | GZR + LPV/RTV (n = 13) | GZR + LPV/RTV vs GZR | |
| AUC0–24 (μM × h)d | 3.63 (2.37–5.56) | 46.7 (30.1–72.5) | 12.86 (10.25–16.13) | 32.4 |
| Cmax (μM)d | 0.954 (0.568–1.60) | 6.97 (5.30–9.16) | 7.31 (5.65–9.45) | 36.8 |
| C24 (nM)d | 15.1 (11.7–19.5) | 327 (149–721) | 21.70 (12.99–36.25) | 73.4 |
| Tmax (h)e | 3.00 (1.00–6.03) | 3.02 (2.00–6.01) | ||
| GZR/DRV/RTVg | GZR (n = 13) | GZR + DRV/RTV (n = 11)h | GZR + DRV/RTV vs GZR | |
| AUC0–24 (μM × h)d | 3.31 (2.25–4.86) | 24.8 (18.7–32.9) | 7.50 (5.92–9.51) | 32.2 |
| Cmax (μM)d | 0.824 (0.502–1.35) | 4.34 (3.27–5.75) | 5.27 (4.04–6.86) | 36.8 |
| C24 (nM)d | 15.7 (12.2–20.1) | 126 (91.0–175) | 8.05 (6.33–10.24) | 30.9 |
| Tmax (h)e | 3.02 (1.00–5.03) | 4.00 (2.00–5.03) |
Pseudo-within-subject percent coefficient of variation (CV) = 100 × sqrt([σ2A + σ2B – 2σAB]/2), where σ2A and σ2B are the estimated variances on the log scale for the two treatments and σAB is the corresponding estimated covariance, each obtained from the linear mixed-effects model.
GZR plasma PK following GZR administration alone and coadministration with ATV/RTV.
One participant was discontinued by the investigator on day 3 of period 1, and one participant was discontinued by the investigator on day 13 of period 2.
Back-transformed least-squares mean (ratio) and CI from a linear mixed-effects model with natural-log-transformed values.
Median and range are reported for Tmax.
GZR plasma PK following GZR administration alone and coadministration with LPV/RTV.
GZR plasma PK following GZR administration alone and coadministration with DRV/RTV.
One participant discontinued on day 6 of period 3, and one participant discontinued on day 1 of period 2.
FIG 2.

GZR arithmetic mean ± SD plasma concentration-time profiles following administration of 200 mg GZR once daily alone for 7 days and coadministration with 300 mg ATV/100 mg RTV once daily for 7 days (GZR alone, n = 12; in combination with ATV/RTV, n = 11) (A), 400 mg LPV/100 mg RTV twice daily for 7 days (both arms, n = 13) (B), or 600 mg DRV/100 mg RTV twice daily for 7 days (GZR alone, n = 13; in combination with DRV/RTV, n = 11) (C) to healthy adult participants (insets, semilog scale).
GZR administered at 200 mg once daily increased ATV exposure (AUC0–24, maximum observed plasma concentration [Cmax], and C24) by 12% to 43% following coadministration of ATV/RTV once daily and GZR once daily (Table 4 and Fig. 3). LPV and DRV exposures were similar following coadministration of either RTV-boosted HIV protease inhibitor with GZR, compared with administration of LPV/RTV alone or DRV/RTV alone (Table 4 and Fig. 3). The median Tmax of the boosted HIV protease inhibitors administered alone was generally comparable to that observed when these agents were coadministered with GZR.
TABLE 4.
Comparison of ATV, LPV, and DRV plasma PK following coadministration of 200 mg GZR once daily and 300 mg ATV/100 mg RTV once daily, 400 mg LPV/100 mg RTV twice daily, or 600 mg DRV/100 mg RTV twice daily for 7 days versus administration of the boosted HIV protease inhibitor for 14 days to healthy adult participants (trial 2)
| PK parameter | GM (95% CI) | GM (95% CI) | GMR (90% CI) | Pseudo-within-subject CV (%)a |
|---|---|---|---|---|
| ATV PK parameters with GZR/ATV/RTVb | ATV/RTV (n = 11)c | GZR + ATV/RTV (n = 11)d | GZR + ATV/RTV vs ATV/RTV | |
| AUC0–24 (ng × h/ml)e | 42,400 (32,300–55,600) | 60,600 (45,800–80,300) | 1.43 (1.30–1.57) | 12.0 |
| Cmax (ng/ml)e | 4,560 (3,650–5,680) | 5,100 (4,330–6,000) | 1.12 (1.01–1.24) | 13.2 |
| C24 (ng/ml)e | 798 (544–1,170) | 983 (670–1,400) | 1.23 (1.13–1.34) | 11. 3 |
| Tmax (h)f | 4.00 (2.00–5.00) | 3.00 (3.00–4.02) | ||
| LPV PK parameters with GZR/LPV/RTVg | LPV/RTV (n = 13) | GZR + LPV/RTV (n = 13) | GZR + LPV/RTV vs LPV/RTV | |
| AUC0–12 (ng × h/ml)e | 103,000 (81,600–131,000) | 10,700 (93,800–121,000) | 1.03 (0.92–1.16) | 16.4 |
| Cmax (ng/ml)e | 12,600 (10,500–15,100) | 12,300 (11,200–13,400) | 0.97 (0.88–1.08) | 14.6 |
| C12 (ng/ml)e | 5,220 (3,520–7,740) | 5,040 (3,680–6,910) | 0.97 (0.81–1.15) | 25.2 |
| Tmax (h)f | 4.00 (2.00–5.05) | 4.01 (2.00–10.03) | ||
| DRV PK parameters with GZR/DRV/RTVh | DRV/RTV (n = 12) | GZR + DRV/RTV (n = 11)i | GZR + DRV/RTV vs DRV/RTV | |
| AUC0–12 (ng × h/ml)e | 68,900 (59,700–79,500) | 76,400 (67,700–86,300) | 1.11 (0.99–1.24) | 15.0 |
| Cmax (ng/ml)e | 8,660 (7,990–9,610) | 9,480 (8,430–10,700) | 1.10 (0.96–1.25) | 17.1 |
| C12 (ng/ml)e | 3,680 (2,950–4,600) | 3,690 (2,980–4,580) | 1.00 (0.85–1.18) | 21.5 |
| Tmax (h)f | 4.02 (2.02–5.00) | 3.01 (1.99–6.00) |
Pseudo-within-subject percent CV = 100 × sqrt([σ2A + σ2B – 2σAB]/2), where σ2A and σ2B are the estimated variances on the log scale for the two treatments and σAB is the corresponding estimated covariance, each obtained from the linear mixed-effects model.
ATV plasma PK following ATV/RTV administration alone and coadministration with GZR.
One participant was discontinued by the investigator on day 3 of period 1.
One participant was discontinued by the investigator on day 13 of period 2.
Back-transformed least-squares mean and CI from a linear mixed-effects model with natural-log-transformed values.
Median and range are reported for Tmax.
LPV plasma PK following LPV/RTV administration alone and coadministration with GZR.
DRV plasma PK following DRV/RTV administration alone and coadministration with GZR.
One participant discontinued on day 6 of period 3, and one participant discontinued on day 1 of period 2.
FIG 3.

ATV, LPV, and DRV arithmetic mean ± SD plasma concentration-time profiles following administration of boosted HIV protease inhibitor alone for 14 days and coadministration with 200 mg GZR once daily for 7 days to healthy adult participants: 300 mg ATV/100 mg RTV once daily (both arms, n = 11) (A), 400 mg LPV/100 mg RTV twice daily (both arms, n = 13) (B), or 600 mg DRV/100 mg RTV twice daily (DRV/RTV alone, n = 12; in combination with GZR, n = 11) (C) (insets, semilog scale).
(iii) Trial 3 (EBR/HIV protease inhibitor/RTV). EBR exposure was increased with coadministration of the three HIV protease inhibitor-RTV combinations, with EBR AUC0–24 exposures being 2- to 5-fold greater than when EBR was administered alone (Table 5 and Fig. 4). The median Tmax of EBR was unaffected by the coadministration of EBR with HIV protease inhibitors and RTV.
TABLE 5.
Comparisons of EBR plasma PK following coadministration of 50 mg EBR once daily and 300 mg ATV/100 mg RTV once daily, 400 mg LPV/100 mg RTV twice daily, or 600 mg DRV/100 mg RTV twice daily for 7 days versus administration of (200 mg) GZR once daily for 7 days to healthy adult participants (trial 3)
| PK parameter | GM (95% CI) | GM (95% CI) | GMR (90% CI) | Pseudo-within-subject CV (%)a |
|---|---|---|---|---|
| EBR/ATV/RTVb | EBR (n = 10) | EBR + ATV/RTV (n = 8)c | EBR + ATV/RTV vs EBR | |
| AUC0–24 (μM × h)d | 1.42 (1.04–1.96) | 6.77 (5.18–8.85) | 4.76 (4.07–5.56) | 16.9 |
| Cmax (nM)d | 97.5 (68.9–138) | 405 (317–516) | 4.15 (3.46–4.97) | 20.5 |
| C24 (nM)d | 37.9 (27.3–52.6) | 245 (181–330) | 6.45 (5.51–7.54) | 16.6 |
| Tmax (h)e | 4.09 (3.00–6.04) | 4.01 (3.01–8.01) | ||
| EBR/LPV/RTVf | EBR (n = 10) | EBR + LPV/RTV (n = 9)g | EBR + LPV/RTV vs EBR | |
| AUC0–24 (μM × h)d | 1.43 (1.11–1.83) | 5.29 (3.86–7.26) | 3.71 (3.05–4.53) | 22.4 |
| Cmax (nM)d | 109 (86.7–137) | 313 (225–434) | 2.87 (2.29–3.58) | 25.3 |
| C24 (nM)d | 40.6 (30.1–54.7) | 186 (136–254) | 4.58 (3.72–5.64) | 23.7 |
| Tmax (h)e | 5.00 (4.00–8.00) | 5.00 (4.00–6.00) | ||
| EBR/DRV/RTVh | EBR (n = 10) | EBR + DRV/RTV (n = 8)i | EBR + DRV/RTV vs EBR | |
| AUC0–24 (μM × h)d | 1.40 (0.972–2.00) | 2.32 (1.71–3.15) | 1.66 (1.35–2.05) | 22.4 |
| Cmax (nM)d | 96.4 (65.5–142) | 161 (114–228) | 1.67 (1.36–2.05) | 22.1 |
| C24 (nM)d | 38.4 (24.9–59.2) | 70.0 (47.8–102) | 1.82 (1.39–2.39) | 28.9 |
| Tmax (h)e | 4.50 (2.00–6.00) | 4.00 (2.01–5.00) |
Pseudo-within-subject percent CV = 100 × sqrt([σ2A + σ2B – 2σAB]/2), where σ2A and σ2B are the estimated variances on the log scale for the two treatments and σAB is the corresponding estimated covariance, each obtained from the linear mixed-effects model.
EBR plasma PK following EBR administration alone and coadministration with ATV/RTV.
One participant was discontinued by the investigator on day 13 of period 2, and one participant was discontinued by the investigator on day 7 of period 2.
Back-transformed least-squares mean (ratio) and CI from a linear mixed-effects model with natural-log-transformed values.
Median and range are reported for Tmax.
EBR plasma PK following EBR administration alone and coadministration with LPV/RTV.
One participant withdrew from the study on day 4 of period 2 (during the administration of LPV).
EBR plasma PK following EBR administration alone and coadministration with DRV/RTV.
One participant was discontinued from the study on day 11 of period 2, and one participant was discontinued from the study on day 13 of period 2.
FIG 4.

EBR arithmetic mean ± SD plasma concentration-time profiles following administration of 50 mg EBR once daily alone for 7 days and coadministration with 300 mg ATV/100 mg RTV once daily for 7 days (EBR alone, n = 10; in combination with ATV/RTV, n = 8) (A), 400 mg LPV/100 mg RTV twice daily for 7 days (EBR alone, n = 10; in combination with LPV/RTV, n = 9) (B), or 600 mg DRV/100 mg RTV twice daily for 7 days (EBR alone, n = 10; in combination with DRV/RTV, n = 8) (C) to healthy adult participants (insets, semilog scale).
Coadministration of EBR with RTV-boosted ATV, LPV, or DRV generally did not meaningfully affect the ATV, LPV, and DRV PK (Table 6 and Fig. 5). The median Tmax values for ATV, LPV, and DRV were unaffected by coadministration with EBR.
TABLE 6.
Comparison of ATV, LPV, and DRV plasma PK following coadministration of 50 mg EBR once daily and 300 mg ATV/100 mg RTV once daily, 400 mg LPV/100 mg RTV twice daily, or 600 mg DRV/100 mg RTV twice daily for 7 days versus administration of the boosted HIV protease inhibitor for 14 days to healthy adult participants (trial 3)
| PK parameter | GM (95% CI) | GM (95% CI) | GMR (90% CI) | Pseudo-within-subject CV (%)a |
|---|---|---|---|---|
| ATV PK parameters with EBR/ATV/RTVb | ATV/RTV, (n = 8)c | EBR + ATV/RTV (n = 8)c | EBR + ATV/RTV vs ATV/RTV | |
| AUC0–24 (ng × h/ml)d | 57,800 (46,000–72,500) | 61,700 (47,500–80,000) | 1.07 (0.98–1.17) | 9.4 |
| Cmax (ng/ml)d | 5,740 (4,720–6,970) | 5,840 (4,790–7,100) | 1.02 (0.96–1.08) | 6.3 |
| C24 (ng/ml)d | 1,230 (803–1,880) | 1,410 (899–2,220) | 1.15 (1.02–1.19) | 12.4 |
| Tmax (h)e | 3.00 (2.00–5.00) | 3.5 (2.00–5.00) | ||
| LPV PK parameters with EBR/LPV/RTVf | LPV/RTV (n = 9)g | EBR + LPV/RTV (n = 9)g | EBR + LPV/RTV vs LPV/RTV | |
| AUC0–12 (ng × h/ml)d | 101,000 (83,300–121,000) | 103,000 (84,000–126,000) | 1.02 (0.93–1.13) | 11.4 |
| Cmax (ng/ml)d | 11,600 (9,880–13,600) | 11,800 (10,200–13,800) | 1.02 (0.92–1.13) | 11.4 |
| C12 (ng/ml)d | 5,780 (4,210–7,930) | 6,170 (4,490–8,480) | 1.07 (0.97–1.18) | 10.9 |
| Tmax (h)e | 4.00 (3.00–6.00) | 4.01 (3.00–8.00) | ||
| DRV PK parameter with EBR/DRV/RTVh | DRV/RTV (n = 8)i | EBR + DRV/RTV (n = 8)i | EBR + DRV/RTV vs DRV/RTV | |
| AUC0–12 (ng × h/ml)d | 54,000 (48,700–60,000) | 51,400 (42,800–61,900) | 0.95 (0.86–1.06) | 10.9 |
| Cmax (ng/ml)d | 7,190 (6,650–7,900) | 6,800 (5,720–8,090) | 0.95 (0.85–1.05) | 10.8 |
| C12 (ng/ml)d | 2,870 (2,230–3,700) | 2,700 (2,030–3,600) | 0.94 (0.85–1.05) | 11.4 |
| Tmax (h)e | 3.00 (2.00–5.00) | 3.5 (2.00–5.00) |
Pseudo-within-subject percent CV = 100 × sqrt([σ2A + σ2B – 2σAB]/2), where σ2A and σ2B are the estimated variances on the log scale for the two treatments and σAB is the corresponding estimated covariance, each obtained from the linear mixed-effects model.
ATV plasma PK following ATV/RTV administration alone and coadministration with EBR.
One participant was discontinued by the investigator on day 13 of period 2, and one participant was discontinued by the investigator on day 7 of period 2.
Back-transformed least-squares mean and CI from a linear mixed-effects model with natural-log-transformed values.
Median and range are reported for Tmax.
LPV plasma PK following LPV/RTV administration alone and coadministration with EBR.
One participant withdrew from the study on day 4 of period 2 (during the administration of LPV).
DRV plasma PK following DRV/RTV administration alone and coadministration with EBR.
One participant was discontinued from the study on day 11 of period 2, and one participant was discontinued from the study on day 13 of period 2.
FIG 5.

ATV, LPV, and DRV arithmetic mean ± SD plasma concentration-time profiles following administration of boosted HIV protease inhibitor alone for 14 days and coadministration with 50 mg EBR once daily for 7 days to healthy adult participants. (A) 300 mg ATV/100 mg RTV once daily (both arms, n = 8). (B) 400 mg LPV/100 mg RTV twice daily (both arms, n = 9). (C) 600 mg DRV/100 mg RTV twice daily (both arms, n = 8) (insets, semilog scale).
Safety.
In trial 1, 8 of 10 participants reported 41 postdose AEs (see Table S1 in the supplemental material); of those, 34 were considered drug related (4 following GZR alone, 14 following RTV alone, and 16 following GZR plus RTV). Two participants reported 3 severe AEs (abdominal pain and diarrhea in 1 participant and syncope in 1 participant), which were considered drug related by the investigator. The remaining AEs were mild to moderate in intensity and generally resolved at the completion of the trial. The most common drug-related AEs (≥2 occurrences) were headache, fatigue, abdominal discomfort, diarrhea, and nausea. No serious AEs, discontinuations due to AEs, or deaths occurred.
In trial 2, 25 of 36 participants reported 74 AEs (Table S2), of which 55 were considered to be related to trial drug(s); 12 were considered to be related to GZR alone, 3 were related to GZR/ATV/RTV, 14 were related to ATV/RTV alone, 7 were related to GZR/LPV/RTV, 11 were related to LPV/RTV alone, 3 were related to GZR/DRV/RTV, and 5 were related to DRV/RTV alone. The most common drug-related AEs were headache and nausea. Most AEs were mild in intensity. No serious AEs or deaths occurred. Two participants discontinued treatment because of AEs; 1 participant discontinued treatment because of a drug-related maculopapular rash while receiving ATV/RTV alone, and 1 participant discontinued treatment because of an increased alanine aminotransferase (ALT) level while receiving GZR alone, which was considered by the investigator to be unrelated to the trial drug.
In trial 3, 20 of 30 participants reported 100 AEs (Table S3), of which 61 were considered to be related to trial drug(s); 2 were considered to be related to EBR alone, 3 were related to ATV/RTV alone, 47 were related to LPV/RTV alone, and 9 were related to DRV/RTV alone. The most common drug-related AEs were diarrhea, abdominal pain, rash, and pruritus. All AEs were mild in intensity. No serious AEs or deaths occurred. Five participants discontinued treatment because of AEs, 2 while receiving ATV/RTV (1 with a maculopapular rash and 1 a bilirubin level increase), 1 with multiple gastrointestinal AEs while receiving LPV/RTV, and 2 with mild papular/macropapular rashes while receiving DRV/RTV. The 3 cases of rash were each considered drug related, and the participant with gastrointestinal AEs withdrew from the trial. The participant with an elevated bilirubin level was discontinued from the trial by the investigator.
DISCUSSION
The combination of EBR and GZR has proved to be a potent direct-acting antiviral regimen for people with chronic HCV genotype 1 and 4 infections, in both clinical trials (10–14, 20–23) and real-world experience (24). Data from the present trials inform the use of EBR/GZR in HCV/HIV-coinfected people who are treated with HIV protease inhibitors. In the current trials, GZR was administered at a dose of 200 mg/day because it has ∼2-fold greater exposure in HCV-infected people than in healthy people at steady state. Therefore, the 200-mg dose in healthy participants was selected to match the exposure achieved when administering a 100-mg dose, which is the approved dose for the treatment of HCV infection (8, 9). In trial 3, EBR was administered at a dose of 50 mg/day, since this is the indicated dose for HCV-infected individuals (8, 9) and EBR PK are similar for HCV-infected and healthy people. RTV-boosted ATV, LPV, or DRV was administered at the clinically indicated doses.
The GZR/RTV interaction trial (trial 1) was designed as a one-way interaction trial investigating the effect of RTV on GZR, because it was not anticipated that GZR would perpetrate interactions with RTV based on the known metabolic and transporter properties of the two drugs. In the GZR/RTV trial, the coadministration of multiple, twice-daily, oral doses of 100 mg RTV with a single oral dose of 200 mg GZR increased the AUC0–∞ of GZR 2-fold, while the Cmax was relatively unchanged. This increase is likely attributable to CYP3A/P-gp inhibition by RTV (4), since a similar increase was observed for GZR when it was administered in combination with the strong CYP3A4/P-gp inhibitor ketoconazole (8, 9). This magnitude of increase is not considered clinically relevant for GZR, but it is also noted that twice-daily administration of 100 mg of RTV is not a clinically relevant dose when RTV is administered alone with other HIV protease inhibitors (25). The potential for higher doses of RTV to inhibit OATP1B (16) and thereby further increase GZR exposure cannot be excluded and has not been evaluated clinically.
In the trials of RTV-boosted ATV, LPV, or DRV administered in combination with GZR, the potential for drug interactions was assessed after repeated GZR administration, owing to the nonlinear and time-dependent PK of GZR (8, 9). GZR was expected to have reached steady state after 7 days of dosing, based on the t1/2 of 30 h. The trials of RTV-boosted ATV, LPV, or DRV administered with EBR were also designed as multiple-dose trials in order to parallel the trial design for the trials of RTV-boosted ATV, LPV, or DRV combined with GZR. Steady-state PK of ATV, LPV, and DRV were not meaningfully altered by the coadministration of GZR or EBR. The lack of an effect of EBR or GZR on ATV, LPV, and DRV PK profiles is consistent with the known major elimination mechanism involving CYP3A for HIV protease inhibitors (4) and the weak inhibitory potency of GZR toward CYP3A. In contrast, GZR and EBR exposures increased with coadministration of HIV protease inhibitors, with AUC0–24 geometric mean ratios (GMRs) ranging from 7.5- to 13-fold for GZR and from 2- to 5-fold for EBR. GZR is a substrate of CYP3A/P-gp and OATP1B (8, 9). The increase in the exposure of GZR when it is coadministered with ATV/RTV, LPV/RTV, and DRV/RTV cannot be explained solely on the basis of CYP3A/P-gp-mediated interactions, since the effects of ATV/RTV, LPV/RTV, and DRV/RTV on GZR were substantially larger than that of RTV alone. Because, based on in vitro and clinical data, GZR is also a known OATP1B substrate (8, 9), the greater magnitude of GZR exposure when RTV is used in combination with ATV, LPV, or DRV might be due to OATP1B inhibition. In vitro and clinical data suggest that the HIV protease inhibitors have the potential to inhibit OATP1B (4). Additionally, based on in vitro data and the calculated Ki values at the clinically relevant doses, the rank order of OATP1B1 inhibition potential of the HIV protease inhibitors at the clinically relevant doses is as follows: LPV > ATV > DRV (16). This rank order is consistent with the trend observed with the magnitude of the effect on GZR exposures in the clinical trials. Furthermore, the magnitude of the increase in GZR exposure with RTV-boosted HIV protease inhibitors is greater than that with RTV alone (CYP3A/P-gp inhibition) and is comparable to that with intravenous rifampin (primarily OATP1B inhibition) alone (8, 9, 26) and with cyclosporine alone (8, 9). These results suggest that OATP1B inhibition is an important component of the interaction between RTV-boosted HIV protease inhibitors and GZR, that GZR is a sensitive OATP1B substrate, and that the pathway of OATP1B-mediated hepatic uptake of GZR is a probable rate-limiting step in GZR disposition, compared with CYP3A-mediated metabolism (27). Nevertheless, CYP3A inhibition may also contribute, as ATV, LPV, and DRV are also strong CYP3A inhibitors.
Increased GZR exposure is associated with late ALT/aspartate aminotransferase (AST) elevation events (8, 9, 28), which are defined as increases in ALT and/or AST levels of >5-fold above the upper limits of normal after treatment week 4 in a person with at least 1 ALT and/or AST value in the normal range between treatment week 2 and treatment week 4. These events were initially observed in a phase 2 dose-ranging trial of GZR in combination with pegylated interferon and ribavirin for the treatment of HCV genotype 1 and 3 infection in participants who received high doses of GZR (up to 800 mg/day) (29). PK/pharmacodynamic analyses indicated that an 8- to 13-fold increase in GZR exposure may considerably increase the risk of transaminase elevations and could consequently lead to further liver injury in individuals with already impaired liver function. Therefore, the concomitant use of RTV-boosted HIV protease inhibitors was excluded in phase 2 and 3 trials, and the coadministration of EBR/GZR with HIV protease inhibitors is contraindicated, owing to the potential for increased risk of late transaminase elevations due to high GZR exposure (8, 9).
The increase in EBR exposure when EBR is coadministered with RTV-boosted HIV protease inhibitors is likely due in part to CYP3A inhibition. The effect of RTV alone on EBR PK was not evaluated, but it is expected that RTV would increase EBR exposure by about 2-fold, based on clinical data on drug-drug interactions with ketoconazole (a strong CYP3A/P-gp inhibitor) (8, 9). The minor increase in EBR exposure is not considered clinically relevant, based on the EBR exposure distribution among participants in the phase 3 trials, which demonstrated favorable efficacy and safety profiles.
ATV alone, saquinavir/RTV, and tipranavir/RTV were not directly assessed in a clinical drug-drug interaction trial with GZR and/or EBR, but they are known inhibitors of CYP3A (4) and several drug transporters (30). In addition, in vitro data and the associated R values calculated at the clinically relevant doses suggest that ATV alone, saquinavir, and tipranavir would likely demonstrate clinically relevant OATP1B inhibition (4, 16). Based on the similarity of enzyme/transporter inhibition profiles to those of the RTV-boosted protease inhibitors included in this clinical trial, it is predicted that ATV alone, saquinavir/RTV, and tipranavir/RTV would also considerably increase GZR concentrations. Therefore, the concomitant use of HIV protease inhibitors, including ATV, saquinavir/RTV, and tipranavir/RTV, is contraindicated in individuals taking GZR/EBR (8, 9). Cobicistat is an inhibitor of CYP3A, CYP2D6, P-gp, and OATP1B (4, 31). Cobicistat is metabolized by CYP3A and, to a minor extent, by CYP2D6 (31). A drug-drug interaction trial with EBR/GZR and elvitegravir/cobicistat/tenofovir disoproxil fumarate/emtricitabine demonstrated a >5-fold increase in GZR exposure, which can be attributed to a combination of the inhibition of CYP3A and OATP1B by cobicistat (31, 32). Based on these data and findings described in the current publication, it is predicted that HIV protease inhibitors boosted by cobicistat would result in considerably higher GZR exposures. For this reason, many HIV protease inhibitors boosted with cobicistat are contraindicated or not recommended for use with EBR/GZR (8, 9).
Alternative HIV medications such as nucleoside reverse transcriptase inhibitors, the non-nucleoside reverse transcriptase inhibitor rilpivirine, or the integrase inhibitors dolutegravir and raltegravir can be coadministered with EBR/GZR without dose adjustment (4, 8, 9, 33). In a phase 3 trial of EBR/GZR in 218 participants coinfected with HIV and HCV genotype 1, 4, or 6, sustained virologic responses 12 weeks after the end of treatment were achieved by 210 participants (96%) (14). Approximately 52% and 27% of the participants in that study were receiving raltegravir and dolutegravir, respectively. The drug-drug interaction potential for bictegravir and EBR/GZR has not been evaluated clinically.
While coadministration of either GZR or EBR with HIV protease inhibitors boosted with RTV did not have an appreciable effect on the PK of ATV, LPV, or DRV, significant increases in GZR exposure were observed and are attributable to CYP3A and OATP1B inhibition. HCV protease inhibitors are substrates of CYP3A and OATP1B, and HIV protease inhibitors are inhibitors of these pathways; therefore, the drug-drug interactions between these two classes of HCV and HIV therapies, as described here, have been observed with many of the currently available HCV protease inhibitors, such as simeprevir, paritaprevir, glecaprevir, and voxilaprevir (34–38). Because increased GZR exposure is associated with late ALT/AST elevation events, coadministration of the EBR/GZR fixed-dose combination with ATV, LPV, or DRV is contraindicated, and HIV antiretroviral therapy regimens that do not include HIV protease inhibitors should be considered for HCV/HIV-coinfected individuals treated with EBR/GZR.
MATERIALS AND METHODS
Ethics approval and consent.
The protocols and informed consent forms were reviewed and approved by the Medical Ethics Review Committee of University Hospitals Leuven (Leuven, Belgium) (trial 1) and Chesapeake Research Review Inc. (Columbia, MD) (trials 2 and 3). All participants provided written informed consent. The trials were performed under the Declaration of Helsinki, ICH good clinical practice guidelines, and the code of conduct for clinical trials of Merck Sharp & Dohme Corp., a subsidiary of Merck & Co., Inc. (Kenilworth, NJ).
Participants.
All three trials enrolled healthy male or female adult participants, 18 to 45 years of age (trial 1) or 18 to 55 years of age (trials 2 and 3). All participants were required to have normal body mass index and no clinically significant abnormalities in laboratory profiles, vital signs, or electrocardiograms. Individuals with a history or presence of significant illness were excluded from the trials. People who had a positive urine screen for drugs or who had used inhibitors of CYP or P-gp/OATP or inducers of CYP within 14 and 28 days of the first dose, respectively, were also excluded.
Trial design.
Trial 1 (GZR/RTV) was a two-period, fixed-sequence trial. In period 1, all participants received a single oral dose of GZR (200 mg) on day 1, followed by an 8-day washout. In period 2, participants received 100 mg RTV twice daily for 21 days. On day 15, participants received the morning RTV dose with a single oral dose of 200 mg GZR. Participants fasted from all food and drink (except water) for 8 h prior to receiving GZR. In period 2, RTV was taken with food except on the morning of day 15, when RTV was coadministered with GZR. Blood samples were collected in vials with K2EDTA before the dose and up to 96 h after the day 1 dose and up to 168 h after the day 15 dose for GZR PK analyses. Immediately after collection, the samples were centrifuged at 1,000 to 1,300 relative centrifugal force (RCF) (× g) at 4°C to 10°C for 10 min, the resulting plasma was transferred to cryotubes, and samples were stored at −20°C until analysis.
Trials 2 and 3 both were open-label, fixed-sequence, three-period trials, one with GZR (trial 2; GZR/HIV protease inhibitors/RTV) and the other with EBR (trial 3; EBR/HIV protease inhibitors/RTV). In period 1 of trial 2, all participants received 200 mg GZR once daily for 7 days, followed by a 7-day washout. In period 2, participants received 300 mg ATV/100 mg RTV once daily, 400 mg LPV/100 mg RTV twice daily, or 600 mg DRV/100 mg RTV twice daily for 14 days, with no subsequent washout. In period 3, participants received the same combination of RTV-boosted HIV protease inhibitors as administered in period 2 in combination with 200 mg GZR once daily for 7 days. A moderate-fat breakfast was administered prior to all doses. A similar treatment regimen was followed for the EBR trial (trial 3), with 50 mg EBR once daily for 7 days administered in periods 1 and 3. In trials 2 and 3, blood samples were collected before the dose and up to 96 h after the day 7 dose of period 1 and period 3 for GZR and EBR. Blood samples for the determination of plasma concentrations of LPV and DRV were collected before the dose and up to 24 h after the dose on day 14 of period 2 and on day 7 of period 3. Blood samples for ATV were collected before the dose and up to 24 h after the dose on day 14 of period 2 and up to 96 h after the dose on day 7 of period 3. Blood samples for GZR and EBR analyses were collected in K2EDTA-containing tubes, and samples for HIV protease inhibitor analyses were collected in K2EDTA-containing tubes (trial 2) or K3EDTA-containing tubes (trial 3). Immediately after collection, the samples were centrifuged at 1,000 to 1,300 RCF (× g) (for EBR and GZR) or 650 to 1,450 RCF (× g) (for HIV protease inhibitors) at 4°C to 10°C for 10 to 15 min. The resulting plasma was transferred to cryotubes, and samples were stored at −20°C until analysis.
Pharmacokinetic evaluations.
(i) Analytical assessments. Plasma samples for GZR were analyzed using a validated liquid chromatography-tandem mass spectrometry (LC-MS/MS) method, with a lower limit of quantification of 1.3 nM (1.0 ng/ml) (range, 1.3 to 1,300 nM [1.0 to 1,000.0 ng/ml]), by PPD Laboratories (Richmond, VA). Plasma samples for EBR were analyzed using a validated high-performance liquid chromatography (HPLC)-MS/MS method, with a lower limit of quantification of 0.283 nM (0.25 ng/ml) (range, 0.283 to 566 nM [0.25 to 500.0 ng/ml]), by Merck Research Laboratories (Oss, The Netherlands). Plasma ATV, LPV, and DRV concentrations were determined using validated methods employing either protein precipitation or LC-MS/MS, by PPD Laboratories. The lower limits of quantification for ATV, LPV, and DRV were all 10.0 ng/ml. The analytical ranges of quantitation for all assays were 10.0 to 10,000 ng/ml.
(ii) Pharmacokinetic methods. PK parameters of interest (as appropriate for each analyte) were the following: AUC0–∞, AUC0–24, Cmax, plasma concentration at 12 h (C12), C24, and Tmax. Cmax, C24, and C12 values were determined directly from the observed plasma concentration-time data. AUC values were calculated using noncompartmental analysis with the linear trapezoidal method for ascending concentrations and the log trapezoidal method for descending concentrations. C24 and C12 values were determined using SAS (version 9.1); all other PK parameters were calculated using Phoenix WinNonlin software (version 6.3).
Safety.
In all three trials, safety was assessed by AE monitoring, physical examinations, monitoring of vital signs, electrocardiograms, and laboratory safety assessments.
Statistical analysis and sample sizes.
Individual AUC values were natural log transformed and evaluated with a linear mixed-effects model with a fixed effect for treatment. The covariance structure for the repeated observations was assumed to be compound symmetry (trial 1) or unstructured (trials 2 and 3). The Kenward-Roger method was used to calculate the denominator degrees of freedom for the fixed effects. A two-sided 90% confidence interval (CI) for the true mean difference (coadministration minus administration alone) in ln AUC was obtained from the model. These confidence limits were then exponentiated to obtain a CI for the true geometric mean (GM) AUC ratio (coadministration/administration alone). Cmax and C24 (or C12 for LPV and DRV) for GZR, EBR, and the HIV protease inhibitor were analyzed in a similar fashion.
With a sample size of 10 participants in trial 1, the half-width of the 90% CI for the GZR AUC0–∞ GMR on the natural log scale would be 0.22 assuming a within-participant standard deviation (SD) of 0.27 on the natural log scale. With a sample size of 10 participants in trial 2, the half-width of the 90% CI for the GMR on the natural log scale would be 0.21 assuming a within-participant SD of 0.26 on the natural log scale (GZR AUC0–24), 0.15 assuming a within-participant SD of 0.18 on the natural log scale (ATV AUC0–24), 0.11 assuming a within-participant SD of 0.14 on the natural log scale (LPV area under the concentration-time curve from 0 to 12 h [AUC0–12]), and 0.16 assuming a within-participant SD of 0.19 on the natural log scale (DRV AUC0–12). With a sample size of 8 participants in trial 3, the half-width of the 90% CI for the GMR on the natural log scale would be 0.11 assuming a within-participant SD of 0.12 on the natural log scale (EBR AUC0–24), 0.15 assuming a within-participant SD of 0.18 on the natural log scale (ATV AUC0–24), 0.11 assuming a within-participant SD of 0.14 on the natural log scale (LPV AUC0–12), and 0.16 assuming a within-participant SD of 0.19 on the natural log scale (DRV AUC0–12).
Supplementary Material
ACKNOWLEDGMENTS
We thank the participants and clinical research unit staff who participated in these trials. Special thanks go to Lingling Han, formerly of Merck & Co., Inc. (Kenilworth, NJ, USA).
This work was supported by Merck Sharp & Dohme Corp., a subsidiary of Merck & Co., Inc. (MSD). Professional medical writing and editorial assistance were provided by Jennifer M. Kulak of ApotheCom (Yardley, PA, USA) and were funded by MSD.
H.-P.F., J.T., and M.M. are employees of MSD. L.C., C.F., X.C., Z.G., D.P., L.D., P.J., R.V., J.R.B., M.I., and W.W.Y. are employees of MSD and shareholders in Merck & Co., Inc., Kenilworth, NJ, USA. K.D. is an employee of Celerion, Inc. (Lincoln, NE, USA). W.D.H., I.P.F., W.L.M., and X.H. were employees of MSD at the time that the trial was conducted. I.P.F. and X.H. are shareholders in Merck & Co., Inc., Kenilworth, NJ, USA. A.M. and J.-F.D. have no conflicts of interest to disclose. I.D.L. is an employee of MSD Europe (Brussels, Belgium). J.N.D.H. reports that his institute received grants from MSD during the conduct of the study. C.V. has received grants from MSD.
H.-P.F. contributed to the analysis of the data, interpretation of the results, drafting the manuscript, and reviewing/revising the manuscript. L.C. contributed to the study design, analysis of the data, interpretation of the results, and reviewing/revising the manuscript. C.F. contributed to the interpretation of the results and reviewing/revising the manuscript. X.C. contributed to the study design, interpretation of the results, and reviewing/revising the manuscript. Z.G. contributed to the study design, acquisition/analysis of the data, interpretation of the results, drafting the manuscript, and reviewing/revising the manuscript. J.T. contributed to the study design, interpretation of the results, and reviewing/revising the manuscript. D.P. contributed to the study design, interpretation of the results, and reviewing/revising the manuscript. K.D. contributed to the analysis of the data and reviewing/revising the manuscript. L.D. contributed to the analysis of the data and reviewing/revising the manuscript. W.D.H. contributed to the study design and reviewing/revising the manuscript. I.P.F. contributed to the study design, interpretation of the results, and reviewing/revising the manuscript. A.M. contributed to the study design, acquisition/analysis of data, interpretation of the results, and reviewing/revising the manuscript. J.-F.D. contributed to the study design, drafting the manuscript, and reviewing/revising the manuscript. I.D.L. contributed to the study design, interpretation of the results, and reviewing/revising the manuscript. J.N.D.H. contributed to the study design, acquisition of the data, and reviewing/revising the manuscript. C.V. contributed to the study design, acquisition of the data, and reviewing/revising the manuscript. W.L.M. contributed to the study design, acquisition/analysis of the data, interpretation of the results, drafting the manuscript, and reviewing/revising the manuscript. P.J. contributed to the study design, acquisition of data, and reviewing/revising the manuscript. X.H. contributed to the analysis of the data, interpretation of the results, and reviewing/revising the manuscript. M.M. contributed to the analysis of the data and reviewing/revising the manuscript. R.V. contributed to the acquisition of the data and drafting the manuscript. J.R.B. contributed to the study design, interpretation of the results, and reviewing/revising the manuscript. M.I. contributed to the interpretation of the results and reviewing/revising the manuscript. W.W.Y. contributed to the study design, analysis of the data, interpretation of the results, drafting the manuscript, and reviewing/revising the manuscript. All authors meet the criteria for authorship set forth by the International Committee of Medical Journal Editors. All authors approved the final version of the manuscript for submission.
Footnotes
Supplemental material for this article may be found at https://doi.org/10.1128/AAC.02142-18.
REFERENCES
- 1.World Health Organization. 2017. Global hepatitis report, 2017. World Health Organization, Geneva, Switzerland: https://afro.who.int/sites/default/files/2017-06/9789241565455-eng.pdf. [Google Scholar]
- 2.Stafford KA, Rikhtegaran Tehrani Z, Saadat S, Ebadi M, Redfield RR, Sajadi MM. 2017. Long-term follow-up of elite controllers: higher risk of complications with HCV coinfection, no association with HIV disease progression. Medicine (Baltimore) 96:e7348. doi: 10.1097/MD.0000000000007348. [DOI] [PMC free article] [PubMed] [Google Scholar]
- 3.Graham CS, Baden LR, Yu E, Mrus JM, Carnie J, Heeren T, Koziel MJ. 2001. Influence of human immunodeficiency virus infection on the course of hepatitis C virus infection: a meta-analysis. Clin Infect Dis 33:562–569. doi: 10.1086/321909. [DOI] [PubMed] [Google Scholar]
- 4.Department of Health and Human Services. 2016. Guidelines for the use of antiretroviral agents in HIV-1-infected adults and adolescents, updated 30 May 2018 Department of Health and Human Services, Washington, DC: https://aidsinfo.nih.gov/contentfiles/lvguidelines/adultandadolescentgl.pdf. [Google Scholar]
- 5.Taylor LE, Swan T, Mayer KH. 2012. HIV coinfection with hepatitis C virus: evolving epidemiology and treatment paradigms. Clin Infect Dis 55(Suppl 1):S33–S42. doi: 10.1093/cid/cis367. [DOI] [PMC free article] [PubMed] [Google Scholar]
- 6.Coburn CA, Meinke PT, Chang W, Fandozzi CM, Graham DJ, Hu B, Huang Q, Kargman S, Kozlowski J, Liu R, McCauley JA, Nomeir AA, Soll RM, Vacca JP, Wang D, Wu H, Zhong B, Olsen DB, Ludmerer SW. 2013. Discovery of MK-8742: an HCV NS5A inhibitor with broad genotype activity. ChemMedChem 8:1930–1940. doi: 10.1002/cmdc.201300343. [DOI] [PubMed] [Google Scholar]
- 7.Summa V, Ludmerer SW, McCauley JA, Fandozzi C, Burlein C, Claudio G, Coleman PJ, DiMuzio JM, Ferrara M, Di Filippo M, Gates AT, Graham DJ, Harper S, Hazuda DJ, McHale C, Monteagudo E, Pucci V, Rowley M, Rudd MT, Soriano A, Stahlhut MW, Vacca JP, Olsen DB, Liverton NJ, Carroll SS. 2012. MK-5172, a selective inhibitor of hepatitis C virus NS3/4a protease with broad activity across genotypes and resistant variants. Antimicrob Agents Chemother 56:4161–4167. doi: 10.1128/AAC.00324-12. [DOI] [PMC free article] [PubMed] [Google Scholar]
- 8.Merck Sharp & Dohme. 2018. Zepatier. Annex I. Summary of product characteristics. Merck Sharp & Dohme Ltd., Hoddesdon, Hertfordshire, UK: http://ec.europa.eu/health/documents/community-register/2017/20171130139565/anx_139565_en.pdf. [Google Scholar]
- 9.Merck & Co. 2018. Zepatier [prescribing information]. Merck & Co., Inc, Kenilworth, NJ: https://www.merck.com/product/usa/pi_circulars/z/zepatier/zepatier_pi.pdf. [Google Scholar]
- 10.Dore GJ, Altice F, Litwin AH, Dalgard O, Gane EJ, Shibolet O, Luetkemeyer A, Nahass R, Peng CY, Conway B, Grebely J, Howe AY, Gendrano IN, Chen E, Huang HC, Dutko FJ, Nickle DC, Nguyen BY, Wahl J, Barr E, Robertson MN, Platt HL. 2016. Elbasvir-grazoprevir to treat hepatitis C virus infection in persons receiving opioid agonist therapy: a randomized trial. Ann Intern Med 165:625–634. doi: 10.7326/M16-0816. [DOI] [PubMed] [Google Scholar]
- 11.Kwo P, Gane E, Peng CY, Pearlman B, Vierling JM, Serfaty L, Buti M, Shafran S, Stryszak P, Lin L, Gress J, Black S, Dutko FJ, Robertson M, Wahl J, Lupinacci L, Barr E, Haber B. 2017. Effectiveness of elbasvir and grazoprevir combination, with or without ribavirin, for treatment-experienced patients with chronic hepatitis C infection. Gastroenterology 152:164–175. doi: 10.1053/j.gastro.2016.09.045. [DOI] [PubMed] [Google Scholar]
- 12.Roth D, Nelson DR, Bruchfeld A, Liapakis A, Silva M, Monsour H Jr, Martin P, Pol S, Londono MC, Hassanein T, Zamor PJ, Zuckerman E, Wan S, Jackson B, Nguyen BY, Robertson M, Barr E, Wahl J, Greaves W. 2015. Grazoprevir plus elbasvir in treatment-naive and treatment-experienced patients with hepatitis C virus genotype 1 infection and stage 4-5 chronic kidney disease (the C-SURFER study): a combination phase 3 study. Lancet 386:1537–1545. doi: 10.1016/S0140-6736(15)00349-9. [DOI] [PubMed] [Google Scholar]
- 13.Zeuzem S, Ghalib R, Reddy KR, Pockros PJ, Ben AZ, Zhao Y, Brown DD, Wan S, DiNubile MJ, Nguyen BY, Robertson MN, Wahl J, Barr E, Butterton JR. 2015. Grazoprevir-elbasvir combination therapy for treatment-naive cirrhotic and noncirrhotic patients with chronic HCV genotype 1, 4, or 6 infection: a randomized trial. Ann Intern Med 163:1–13. doi: 10.7326/M15-0785. [DOI] [PubMed] [Google Scholar]
- 14.Rockstroh JK, Nelson M, Katlama C, Lalezari J, Mallolas J, Bloch M, Matthews GV, Saag MS, Zamor PJ, Orkin C, Gress J, Klopfer S, Shaughnessy M, Wahl J, Nguyen BY, Barr E, Platt HL, Robertson MN, Sulkowski M. 2015. Efficacy and safety of grazoprevir (MK-5172) and elbasvir (MK-8742) in patients with hepatitis C virus and HIV co-infection (C-EDGE CO-INFECTION): a non-randomised, open-label trial. Lancet HIV 2:e319–e327. doi: 10.1016/S2352-3018(15)00114-9. [DOI] [PubMed] [Google Scholar]
- 15.Caro L, Talaty JE, Guo Z, Reitmann C, Fraser IP, Evers R, Swearingen D, Yeh WW, Butterton JR. 2013. Pharmacokinetic interaction between the HCV protease inhibitor MK-5172 and midazolam, pitavastatin, and atorvastatin in healthy volunteers, abstr 477 Hepatology 58(Suppl 1):437A https://aasldpubs.onlinelibrary.wiley.com/doi/epdf/10.1002/hep.26727. [Google Scholar]
- 16.Annaert P, Ye ZW, Stieger B, Augustijns P. 2010. Interaction of HIV protease inhibitors with OATP1B1, 1B3, and 2B1. Xenobiotica 40:163–176. doi: 10.3109/00498250903509375. [DOI] [PubMed] [Google Scholar]
- 17.AbbVie. 2017. Kaletra (lopinavir and ritonavir) tablet for oral use and Kaletra (lopinavir and ritonavir) oral solution [prescribing information]. AbbVie, Inc, North Chicago, IL: https://www.accessdata.fda.gov/drugsatfda_docs/label/2016/021251s052_021906s046lbl.pdf. [Google Scholar]
- 18.Caro L, Talaty JE, Guo Z, Fraser IP, Davis HU, O’Reilly T, Yeh WW, Butterton JR. 2013. Pharmacokinetic interactions between the HCV protease inhibitor MK-5172 and ritonavir-boosted HIV protease inhibitors (atazanavir, lopinavir, darunavir) in healthy volunteers, abstr 487 Hepatology 58(Suppl 1):442a https://aasldpubs.onlinelibrary.wiley.com/doi/epdf/10.1002/hep.26727.23686865 [Google Scholar]
- 19.Yeh WY, Marshall W, Ma J, Mangin E, Huang X, Jumes P, Youngberg S, Butterton J. 2014. Ritonavir-boosted atazanavir, lopinavir, and darunavir increase HCV NS5A inhibitor MK-8742 levels, abstr 638 Top Antiviral Med 22:315 https://www.iasusa.org/wp-content/uploads/2014/04/apr_2014.pdf. [Google Scholar]
- 20.Lawitz E, Gane E, Pearlman B, Tam E, Ghesquiere W, Guyader D, Alric L, Bronowicki JP, Lester L, Sievert W, Ghalib R, Balart L, Sund F, Lagging M, Dutko F, Shaughnessy M, Hwang P, Howe AY, Wahl J, Robertson M, Barr E, Haber B. 2015. Efficacy and safety of 12 weeks versus 18 weeks of treatment with grazoprevir (MK-5172) and elbasvir (MK-8742) with or without ribavirin for hepatitis C virus genotype 1 infection in previously untreated patients with cirrhosis and patients with previous null response with or without cirrhosis (C-WORTHY): a randomised, open-label phase 2 trial. Lancet 385:1075–1086. doi: 10.1016/S0140-6736(14)61795-5. [DOI] [PubMed] [Google Scholar]
- 21.Lawitz E, Poordad F, Gutierrez JA, Wells JT, Landaverde CE, Evans B, Howe A, Huang HC, Li JJ, Hwang P, Dutko FJ, Robertson M, Wahl J, Barr E, Haber B. 2017. Short-duration treatment with elbasvir/grazoprevir and sofosbuvir for hepatitis C: a randomized trial. Hepatology 65:439–450. doi: 10.1002/hep.28877. [DOI] [PubMed] [Google Scholar]
- 22.Sperl J, Horvath G, Halota W, Ruiz-Tapiador JA, Streinu-Cercel A, Jancoriene L, Werling K, Kileng H, Koklu S, Gerstoft J, Urbanek P, Flisiak R, Leiva R, Kazenaite E, Prinzing R, Patel S, Qiu J, Asante-Appiah E, Wahl J, Nguyen BY, Barr E, Platt HL. 2016. Efficacy and safety of elbasvir/grazoprevir and sofosbuvir/pegylated interferon/ribavirin: a phase III randomized controlled trial. J Hepatol 65:1112–1119. doi: 10.1016/j.jhep.2016.07.050. [DOI] [PubMed] [Google Scholar]
- 23.Sulkowski M, Mallolas J, Bourliere M, Gerstoft J, Shibolet O, Nahass R, DeJesus E, Shaughnessy M, Hwang P, Haber B. 2014. On-treatment viral response to MK-5172/MK-8742 ± RBV for 12 weeks in HCV/HIV-coinfected patients, abstr 654LB Top Antiviral Med 22:324–325. https://www.iasusa.org/wp-content/uploads/2014/04/apr_2014.pdf. [Google Scholar]
- 24.Kramer JR, Puenpatom A, Erickson K, Cao Y, El-Serag H, Kanwal F. 2017. PS-095: real world experience with elbasvir/grazoprevir in the Veterans Affairs Healthcare System. J Hepatol 66(Suppl):S54–S55. doi: 10.1016/S0168-8278(17)30371-9. [DOI] [Google Scholar]
- 25.AbbVie. 2017. Norvir (ritonavir) tablet, for oral use, Norvir (ritonavir) oral solution, and Norvir (ritonavir) oral powder [prescribing information]. AbbVie, Inc, North Chicago, IL: https://www.accessdata.fda.gov/drugsatfda_docs/label/2017/209512lbl.pdf. [Google Scholar]
- 26.Lau YY, Huang Y, Frassetto L, Benet LZ. 2007. Effect of OATP1B transporter inhibition on the pharmacokinetics of atorvastatin in healthy volunteers. Clin Pharmacol Ther 81:194–204. doi: 10.1038/sj.clpt.6100038. [DOI] [PubMed] [Google Scholar]
- 27.Maeda K, Ikeda Y, Fujita T, Yoshida K, Azuma Y, Haruyama Y, Yamane N, Kumagai Y, Sugiyama Y. 2011. Identification of the rate‐determining process in the hepatic clearance of atorvastatin in a clinical cassette microdosing study. Clin Pharmacol Ther 90:575–581. doi: 10.1038/clpt.2011.142. [DOI] [PubMed] [Google Scholar]
- 28.Caro L, Du L, Huang S, Wenning L, Su J, Hwang PMT, Valesky R, Gilbert C, Gress J, Klaassen F, Gendrano IN, Brunhofer J, Cooreman M, Huisman J, Mobashery N. 2013. Relationship between transaminase levels and plasma pharmacokinetics following administration of MK-5172 with pegylated interferon alfa-2b and ribavirin to HCV genotype G1 treatment-naive patients, abstr 803 J Hepatol 58(Suppl 1):S328. doi: 10.1016/S0168-8278(13)60805-3. [DOI] [Google Scholar]
- 29.Manns MP, Vierling JM, Bacon BR, Bruno S, Shibolet O, Baruch Y, Marcellin P, Caro L, Howe AY, Fandozzi C, Gress J, Gilbert CL, Shaw PM, Cooreman MP, Robertson MN, Hwang P, Dutko FJ, Wahl J, Mobashery N. 2014. The combination of MK-5172, peginterferon, and ribavirin is effective in treatment-naive patients with hepatitis C virus genotype 1 infection without cirrhosis. Gastroenterology 147:366–376. doi: 10.1053/j.gastro.2014.04.006. [DOI] [PubMed] [Google Scholar]
- 30.Griffin L, Annaert P, Brouwer KL. 2011. Influence of drug transport proteins on the pharmacokinetics and drug interactions of HIV protease inhibitors. J Pharm Sci 100:3636–3654. doi: 10.1002/jps.22655. [DOI] [PMC free article] [PubMed] [Google Scholar]
- 31.Gilead Sciences. 2017. Tybost [prescribing information]. Gilead Sciences Inc, Foster City, CA: https://www.accessdata.fda.gov/drugsatfda_docs/label/2017/203094s008lbl.pdf. [Google Scholar]
- 32.Feng HP, Caro L, Guo Z, Wolford D, Iwamoto M, Yeh W, Dunnington K, Marricco N, Sterling L, Mirzac A, Moore T. 2016. A clinically meaningful drug-drug interaction observed between Zepatier (grazoprevir/elbasvir) and Stribild HIV fixed-dose combination in healthy subjects. Rev Antiviral Ther Infect Dis 6:24 http://regist2.virology-education.com/Abstractbook/2016_6.pdf. [Google Scholar]
- 33.Feng HP, Guo Z, Ross LL, Fraser I, Panebianco D, Jumes P, Fandozzi C, Caro L, Talaty J, Ma J, Mangin E, Huang X, Marshall WL, Butterton JR, Iwamoto M, Yeh WW. 2018. Assessment of drug interaction potential between the HCV direct-acting antiviral agents elbasvir/grazoprevir and the HIV integrase inhibitors raltegravir and dolutegravir. J Antimicrob Chemother 73:dky465. doi: 10.1093/jac/dky465. [DOI] [PubMed] [Google Scholar]
- 34.AbbVie. 2017. Mavyret [prescribing information]. AbbVie Inc, North Chicago, IL: https://www.accessdata.fda.gov/drugsatfda_docs/label/2017/209394s003lbl.pdf. [Google Scholar]
- 35.Soriano V, Benítez-Gutiérrez L, Arias A, Carrasco I, Barreiro P, Peña JM, de Mendoza C. 2017. Evaluation of sofosbuvir, velpatasvir plus voxilaprevir as fixed-dose co-formulation for treating hepatitis C. Exp Opin Drug Metab Toxicol 13:1015–1022. doi: 10.1080/17425255.2017.1359254. [DOI] [PubMed] [Google Scholar]
- 36.Menon RM, Klein CE, Podsadecki TJ, Chiu YL, Dutta S, Awni WM. 2016. Pharmacokinetics and tolerability of paritaprevir, a direct acting antiviral agent for hepatitis C virus treatment, with and without ritonavir in healthy volunteers. Br J Clin Pharmacol 81:929–940. doi: 10.1111/bcp.12873. [DOI] [PMC free article] [PubMed] [Google Scholar]
- 37.Khatri A, Dutta S, Wang H, Podsadecki T, Trinh R, Awni W, Menon R. 2016. Evaluation of drug-drug interactions between hepatitis C antiviral agents ombitasvir, paritaprevir/ritonavir, and dasabuvir and HIV-1 protease inhibitors. Clin Infect Dis 62:972–979. doi: 10.1093/cid/civ1213. [DOI] [PubMed] [Google Scholar]
- 38.Gilead Sciences. 2017. Vosevi [prescribing information]. Gilead Sciences, Foster City, CA: https://www.accessdata.fda.gov/drugsatfda_docs/label/2017/209195s000lbl.pdf. [Google Scholar]
Associated Data
This section collects any data citations, data availability statements, or supplementary materials included in this article.