

Abstract
Over recent decades, many studies have reported that hypocrellin A (HA) can eliminate cancer cells with proper irradiation in several cancer cell lines. However, the precise molecular mechanism underlying its anticancer effect has not been fully defined. HA-mediated cytotoxicity and apoptosis in human lung adenocarcinoma A549 cells were evaluated after photodynamic therapy (PDT). A temporal quantitative proteomics approach by isobaric tag for relative and absolute quantitation (iTRAQ) 2D liquid chromatography with tandem mass spectrometric (LC–MS/MS) was introduced to help clarify molecular cytotoxic mechanisms and identify candidate targets of HA-induced apoptotic cell death. Specific caspase inhibitors were used to further elucidate the molecular pathway underlying apoptosis in PDT-treated A549 cells. Finally, down-stream apoptosis-related protein was evaluated. Apoptosis induced by HA was associated with cell shrinkage, externalization of cell membrane phosphatidylserine, DNA fragmentation, and mitochondrial disruption, which were preceded by increased intracellular reactive oxygen species (ROS) generations. Further studies showed that PDT treatment with 0.08 µmol/L HA resulted in mitochondrial disruption, pronounced release of cytochrome c, and activation of caspase-3, -9, and -7. Together, HA may be a possible therapeutic agent directed toward mitochondria and a promising photodynamic anticancer candidate for further evaluation.
Abbreviations: ACN, acetonitrile; CLSM, confocal laser scanning confocal microscopy; DCFH-DA, 2′,7′-dichlorofuorescin diacetate; DMEM, Dulbecco׳s modified Eagle׳s medium; Dox, doxorubicin; ECL, enhanced chemiluminescence; FCCP, carbonyl cyanide 4-(trifluoromethoxy)phenylhydrazone; FDR, false discovery rate; GO, gene ontology; HA, hypocrellin A; HRP, horseradish peroxidase; IAA, iodoacetamide; IKK, IκB kinase complex; iTRAQ, isobaric tag for relative and absolute quantitation; JC-1, 5,5′,6,6′-tetrachloro-1,1′,3,3′-tetraethyl-benzimidazolcarbocyanine iodide; MPT, mitochondrial permeability transition; MMP, mitochondrial membrane potential; NAC, N-acetyl-l-cysteine; ROS, reactive oxygen species; OCR, oxygen consumption rate; PDT, photodynamic therapy; PI, propidium iodide; PS, photosensitizer; SCX, strong cation exchange; TCM, traditional Chinese medicinal; TEM, transmission electron microscope; TFA, trifluoroacetic acid; UA, urea; z-LEHD-fmk, z-Leu-Glu(OMe)-His-Asp(OMe)-fluoromethylketone; z-VAD-fmk, z-Val-Ala-Asp-fluoromethylketone; z-IETD-fmk, z-Ile-Glu-Asp-fluoromethylketone
KEY WORDS: Hypocrellin A, Photodynamic therapy, Reactive oxygen species, Proteomic, LC–MS/MS, iTRAQ
Graphical abstract
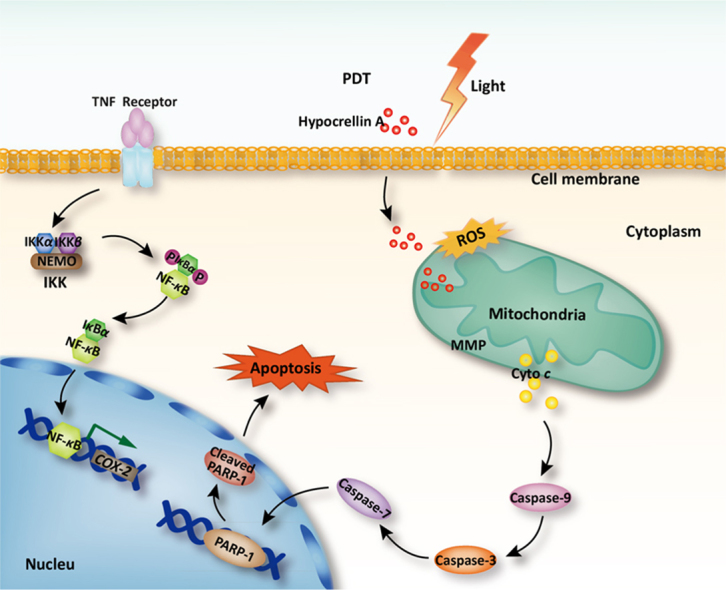
Hypocrellin A-mediated oxidative injury induced by light emitting diode irradiation triggers mitochondrial membrane potential changes and dysfunction, then mitochondrial cytochrome c release and caspase activation, which consequently lead to apoptosis. The study demonstrated hypocrellin A may be a possible therapeutic anticancer agent directed toward mitochondria.
1. Introduction
Cancer is a leading cause of mortality in economically developed countries and the second most frequent cause of death in developing countries1. Current standard treatments, such as surgery, chemotherapy and radiotherapy, are limited by undesirable toxic and side effects, patient intolerance, and poor long-term survival rates2. With the shortcomings of these conventional cancer treatment modalities and the magnitude of lung cancer incidence, alternative therapies with better tumor selectivity and fewer side effects have been developed.
Since the first use of hematoporphyrin derivative together with red light irradiation to kill tumor cells in 1975, photodynamic therapy (PDT) has attracted extensive attention as a prospective strategy for cancer treatment3. PDT is consists of two-step process including the accumulation in the tumor tissue and then activation of photosensitizer (PS) after illumination with proper light. PDT involves three important elements: sensitizing agent, light energy, and oxygen, among which PS plays a vital role in effective PDT4. Ever since the discovery of PDT, continuous efforts have been made to identify ideal photosensitizer drugs.
HA is a type of perylenequinoid isolated from a traditional Chinese medicinal (TCM) fungus Shiraia bambusicola5. HA is widely accepted and utilized in clinic for lichen amyloidosis, tinea capitis, white lesions of the vulva, vitiligo, psoriasis, and keloid. Currently, due to its high singlet oxygen quantum yield and strong red-absorption property, HA has aroused extensive interest as a potent anti-cancer drug for PDT6. Many reports revealed that HA exerted an anticancer effect via triggering apoptotic cell death. In a study by Zhang and co-workers7, HA evoked photodynamic toxicity via apoptosis in HeLa, MGC-803 and HIC malignant human cell lines. Fei et al.8 also reported that the apoptosis induced by HA in human cervical carcinoma cells might relate to the equilibrium state between BAX and BCL-2 gene expression in mitochondria. However, the biological molecular mechanism of apoptosis-inducing effect in response to HA-mediated PDT has not been systematically investigated at the protein level.
Therefore, a better understanding of the biochemical changes caused by HA during apoptosis is desirable to improve future PDT strategies. In this work, we first assessed anticancer and apoptosis inducing effects of HA under illumination and verified that ROS actively participated in PDT in A549 cells. Moreover, protein abundance changes were quantified and promising targets and signaling pathways involved in HA-induced apoptotic cell death were identified. Additionally, applying functional assessment and mitochondrial morphology investigation, as well as down-stream apoptosis-related protein evaluation, we provide detailed insights into mechanism of successive events evoked by HA that eventually led to apoptosis.
2. Materials and methods
2.1. Materials
HA was separated by chromatography from fruiting bodies of Shiraia bambusicola collected from wild fields according to Kishi׳s method9. HA was crystallized three times from acetone and characterized as reported in our previous work before use10. A 10 mmol/L stock solution of HA dissolved in DMSO was prepared and stored at −20 °C in the dark. Doxorubicin (Dox) was purchased from Selleck Chemicals (Houston, TX, USA). CCK-8 was purchased from Dojindo Laboratories (Kumamoto, Japan). 2′,7′-Dichlorofuorescin diacetate (DCFH-DA) and Dulbecco׳s modified Eagle medium (DMEM) were purchased from Sigma–Aldrich Co. (St. Louis, MO, USA). z-Val-Ala-Asp-fluoromethylketone (Z-VAD-fmk), z-Ile-Glu-Asp-fluoromethylketone (z-IETD-fmk)andz-Leu-Glu(OMe)-His-Asp(OMe)-fluoromethylketone (z-LEHD-fmk) were purchased from Santa Cruz Biotechnology (Santa Cruz, CA, USA). Annexin V apoptosis detection kit was purchased from BioVision, Inc. (Mountain View, CA, USA). MitoTracker green and the Mito Probe 5,5′,6,6′-tetrachloro-1,1′,3,3′-tetraethyl-benzimidazolcarbocyanine iodide (JC-1) assay kit were from Thermo Fisher Scientific (San Jose, CA, USA). XF cell Mito-stress test kit was obtained from Seahorse Bioscience, Inc. (North Billerica, MA, USA). Apoptosis antibody sampler kit, Western blotting application solutions kit, anti-cytochrome c, and anti-COX IV were acquired from Cell Signaling Technology, Inc. (Beverly, MA, USA). All other chemicals were of analytical grade.
2.2. UV Spectral analysis of HA
Spectral analysis of HA was performed on a Shimadzu UV-2450 spectrophotometer (Japan) using phosphate buffered solution (PBS) as solvent and methanol (< 0.5%) as co-solvent.
2.3. Cell culture
A549 human lung adenocarcinoma cell line (A549 cells) was purchased from the Cell Bank of Type Culture Collection of Chinese Academy of Sciences (Shanghai, China). A549 cells were grown in DMEM medium supplemented with 10% (v/v) heat-inactivated fetal bovine serum (FBS), and antibiotics (100 IU/mL penicillin and 100 μg/mL streptomycin) in a humidified atmosphere with 5% CO2 and kept at 37 °C.
2.4. Cellular uptake
To study intracellular photosensitizer accumulation, cellular uptake of HA by A549 cells was visualized with an Olympus IX71 fluorescent microscope (Tokyo, Japan). ImageJ (V1.44; http://rsb.info.nih.gov/ij/) was used to analyze the changes of the fluorescent signal intensity.
2.5. Photodynamic treatment of in vitro cells
Photodynamic treatment was conducted as described in our previous work10. The A549 cells were rinsed with PBS to remove the serum and subsequently incubated with or without HA for 4 h in serum-free medium in the dark, allowing cellular uptake of PS. For control group, cells were incubated with is FBS free DMEM with correspondent amount of DMSO with HA treatment solution. The cells in each treatment group were then rinsed with PBS and exposed to a light emitting diode (LED) light source at proper wavelength for 15 min, except for Sham and Dox groups. After illumination, the cells were immediately removed into the dark and incubated for rest hours for future testing.
2.6. Cytotoxicity assays
Briefly, the cells were seeded at a density of 1×10⁴ cells/mL onto a 96-well plate (Corning, NY, USA) overnight for attachment. Dox was chosen as a positive control drug owing to it widely applied in clinical anticancer therapy11. For the PDT assay, the cells were exposed to different concentrations of HA and Dox according to the method described above. After PDT, cell viability was then assessed with a cell counting kit 8 (CCK-8) according to the manufacturer׳s instructions. In parallel, for the dark cytotoxicity testing, cells were processed as described above except for the light treatment.
2.7. Nuclear morphology analysis
Nuclear condensation was detected by labeling cells with the nuclear stain 4′,6-diamidino-2-phenylindole (DAPI) and observing cells under a fluorescence microscope. Briefly, the A549 cells were grown at 2×10⁴ cells/mL on cover glasses in 6-well plates. At certain times after the photodynamic treatment was finished, washed cells were fixed with formaldehyde (4%, w/v) for 10 min and then permeabilized with Triton X-100 (0.01%, v/v, in PBS) for 5 min at room temperature. Finally, after the cells were stained with DAPI (1 μg/mL), nuclear morphology was visualized using a fluorescence microscope at 460 nm.
2.8. Cell membrane phosphatidylserine externalization analysis
Percentage of apoptotic cells after light irradiation was evaluated employing an annexin V apoptosis detection kit. A549 cells were grown in 6-well plates at 2 × 10⁴ cells/mL and permitted to attach overnight. Next, light irradiation was conducted as described above. Then, the cells were harvested and rinsed twice with pre-cooled PBS.
2.9. Cell cycle assay
To evaluate cell cycle changes after PDT, propidium iodide (PI)-stained A549 cells were examined with flow cytometry at wavelength (λex) 488 nm excitation and detected wavelength (λex) at 565–610 nm emission. Later, Cell Quest Pro 4.0.2 software (Becton Dickinson, San Jose, CA, USA) was used to analyze the data. The sub-G1 percentage was reported as the apoptosis levels. Immediately, the cells were stained with annexin V labeled with fluorescein isothiocyanate (FITC) at 37 °C for 15 min in the dark and examined under a FACS Calibur flow cytometer (San Jose, CA, USA).
2.10. Western blot analysis
After exposure to different treatment, cell extracts were prepared and rinsed in modified radio immunoprecipitation assay (RIPA) lysis buffer on ice. After 20 min centrifugation at 10,000×g at 4 °C, supernatants were collected and then subjected to protein concentration estimation using the Bradford method. Subsequently, equal amounts of each protein sample was separated on sodium dodecyl sulphate-polyacrylamide gel electrophoresis (SDS-PAGE) and transferred onto polyvinylidene fluoride (PVDF) membranes (Millipore, Bedford, MA, USA) using Bio-Rad wet transfer system. After blocking, the membranes were incubated overnight with primary antibodies at 1/2000 or 1/1000 dilution with agitation at 4 °C. Thereafter, blots were washed and exposed to horseradish peroxidase (HRP)-conjugated secondary antibody for 1 h. Finally, proteins were washed again, visualized using an electrogenerated chemiluminescence (ECL) kit, and examined with a Fluor Chem E system image analyzer (Cell Biosciences, Santa Clara, CA, USA).
2.11. DNA fragmentation determination
In brief, treated A549 cells were rinsed and suspended in 40 μL of lysis buffer (20 mmol/L ethylenediaminetetraacetic acid (EDTA), 100 mmol/L Tris–HCl, and 0.8% SDS, pH 8.0). Immediately, the cell suspension was incubated with 20 units RNaseA/T1 for 1 h at 37 °C. Then, cellular DNA was extracted following incubation with 20 µL proteinase K (20 mg/mL) overnight at 50 °C in a water bath. Before loading on the gel, these DNA samples were diluted with TE buffer (0.2 mmol/L EDTA, 10 mmol/L Tris–HCl, pH 7.5) and mixed with DNA loading buffer (6×). Total DNA was analyzed by electrophoresis on 1.5% agarose gels at 60 V for 6 h. The DNA cleavage pattern was examined and digitized using a GIS-2 500 gel documentation system (Tanon, Shanghai, China).
2.12. Intracellular ROS detection
The specific superoxide radical anion (O2·−) indicator DCFH-DA was introduced to determine intracellular peroxides. The cells were seeded onto fluorescent 96-well plates at 2×10⁴ cells/mL and permitted to adhere overnight. At different times after light irradiation, the cells were stained with DCFH-DA (10 μmol/L) for 20 min in the dark. The superoxide generation was determined by immediately detecting the rinsed cells using a multi-detection microplate reader at λex 500 nm and λem 485 nm, respectively.
2.13. ROS dependency determination
To verify the involvement of ROS formation during apoptosis induction in HA-mediated PDT, the cell-permeable reactive oxygen species dismutase N-acetyl-l-cysteine (NAC; 2 mmol/L) was applied to inhibit ROS generation in response to light irradiation. After the A549 cells were pretreated with NAC for 12 h, light irradiation was performed. At 12 h after irradiation, apoptosis was assessed via poly(ADP-ribose) polymerase-1 (PARP-1) Western blot detection.
2.14. Protein digestion and iTRAQ labeling
First, protein was isolated from control or treated the A549 cells by applying lysis buffer and purified via centrifugation at 18,000×g. Each protein aliquot sample isolated was acetone-precipitated and was dehydrated in 200 μL of 8 mol Urea (UA buffer; in 150 mmol/L Tris–HCl, pH 8.0), alkylated with 100 mmol/L of iodoacetamide (IAA, in UA) and NH4HCO3 buffer (40 mmol/L), and dehydrated again as described above. Afterwards, the digestion was prepared by adding 96 μL trypsin buffer (7 μg trypsin in 480 μL NH4HCO3 buffer) and 10% acetonitrile (ACN) for 20 h at 37 °C. After that, the hydrolysates were lyophilized, re-dissolved in 0.1% trifluoroacetic acid (TFA), desalinated with C18-SD Extraction Disk Cartridge desalination and quantified at 280 nm.
Proteins (100 μg) from each treatment were labeled using the iTRAQ Reagent-8plex Multiplex Kit (Applied Biosystems, Foster City, USA). A total of six samples were individually labeled with the iTRAQ tags (group A = iTRAQ 113; group B = iTRAQ 114; group C = iTRAQ 115; group D = iTRAQ 116; group E = iTRAQ 117; group F = iTRAQ 118). The labeled peptides were then lyophilized for further chromatography analysis.
2.15. Strong cation exchange (SCX) fractionation
The samples were then re-dissolved with SCX buffer A (10 mmol/L KH2PO4, in 25% ACN, pH 3.0) and introduced into the high performance liquid chromatograph (HPLC) system AKTA Purifier 100 (GE Healthcare) connected to the polysulfoethyl 100 mm× 4.6 mm column (5 µm, 200 Å) (PolyLC Inc., Columbia, USA). SCX buffer A and SCX buffer B (10 mmol/L KH2PO4 and 500 mmol/L KCl in 25% ACN, pH 3.0) were used in the mobile phases. The gradient run on the column ranged from 25%–100% SCX buffer B over 75 min at a flow rate of 1 mL/min. Then, the peptides were eluted with 100% buffer A for 1–25 min, buffer B (concentration increased from 10% to 45%) from 32 min to 47 min, 100% buffer B for 47–60 min, and 100% buffer A for the last 15 min. Fractions were collected every 60 s starting from 32 min. In total, 33 eluted fractions were pooled into 15 fractions, desalted with a C18 Cartridge (66872-U Sigma), and lyophilized.
2.16. LC-MS/MS analysis
Lyophilized peptide samples were re-dissolved in buffer A (10 mmol/L KH2PO4, 2% ACN, 0.1% TFA). The fractions were then loaded onto a Nano-RPLC analysis system. Buffer A (1% formic acid) and buffer B (1% formic acid, in ACN) were used in the chromatography analysis in the mobile phases. Before further separation, aliquots of each fraction (10 μL) were concentrated on a Thermo Scientific EASY pre-column (2 cm × 100 μm, 5 μm-C18, San Jose, CA, USA). Then, each peptide sample was separated on the EASY column (75 μm × 100 mm, 3 μm-C18; Thermo Scientific) eluted with a gradient elution buffer B for 60 min at a flow rate of 300 nL/min. After equilibration with 100% buffer A, the gradient started at 0% buffer B, followed by a 55 min elution with 50% buffer B, increased from 50% buffer B to 100% buffer B over 2 min, and maintained at 100% for another 3 min.
MS/MS was performed with a Thermo Finnigan Q-Exactive mass spectrometry. During the full MS scan, the system was set in the positive ion mode. MS data were acquired by a mass range of m/z 300 to m/z 1800 for precursor ions and the resolution set to 70,000 at m/z 200. The normalized sweeping collision energy at 30 ± 5 eV was used for all precursor ions. Dynamic exclusion was set for half of the peak width (40 s). Activation time was set at 60 ms. The 10 most abundant peptides were collected for tandem mass (MS/MS) analysis with a resolution of 17,500 at m/z 200 for each cycle of data-dependent analysis.
2.17. Data processing and bioinformatics
Relative quantification and identification of raw MS spectra of 15 SCX fractions were performed with the Proteome Discoverer software (Version 1.4, Thermo Scientific, Matrix Science Ltd., London, UK) workflow. Database searches were conducted using Mascot 2.2 with search parameters as follows: trypsin as specific enzyme, oxidation of methionine as variable modification, precursor mass tolerance of 20 ppm and 0.1 Da for fragment tolerance. iTRAQ8plex (N-term), iTRAQ8plex (K) and carbamidomethyl (C) were considered variable modifications. A false discovery rate (FDR) threshold was set to 1% in this study. All reported proteins determined using Proteome Discoverer software were identified with a 95% or greater confidence filter. Furthermore, for protein quantification measured with iTRAQ, we set a fold change of ±1.2 of the abundance ratio as the threshold with a P-value < 0.05 to identify significantly different expression. DAVID Functional Annotation Tools (http://david.abcc.ncifcrf.gov/) were introduced to study the molecular functional classification and pathway annotation of the differential proteins12. The functional network interaction was analyzed applying String (http://string-db.org/)13. To investigate the differentially expressed protein involvement in biological pathways, further analysis was performed using the KEGG database (http://www.genome.jp/kegg/)14. In addition, the gene ontology (GO) biological processes involving these proteins were determined using Panther (http://www.pantherdb.org/).
2.18. Caspase dependency determination
To determine the involvement of caspases in apoptosis, caspase inhibitors were employed. First, the cells were pretreated with pan-caspase inhibitor Z-VAD-fmk (20 μmol/L, in FBS-free medium) for 12 h before PDT and maintained at 20 μmol/L. Control cells were incubated with no-serum cell culture medium with or without the pan-caspase inhibitor. Furthermore, to elucidate the pathway involved in the PDT-induced apoptosis process, caspase 8 inhibitor z-IETD-fmk and caspase 9 inhibitor z-LEHD-fmk were applied, followed by PARP-1 Western blot examination. The pretreatment and protein isolation was conducted as described above.
2.19. Subcellular localization
To determine the subcellular localization of HA, the mitochondrial dye MitoTracker® green was introduced. The A549 cells were seeded at 2 × 10⁴ cells/mL onto coverslips. After attachment, rinsed the A549 cells were then incubated with HA (1 μmol/L) at 37 °C for 4 h, allowing uptake in the dark. Then, mitochondria in the A549 cells were labeled with MitoTracker® green for 30 min. Finally, confocal laser scanning microscopy (CLSM) images of subcellular localization were photographed using a Flowview FV1000 laser scanning confocal microscope (Olympus, Japan). HA was excited by the 543 nm and subsequently detected at 565–615 nm, while MitoTracker® green was excited at 490 nm and detected at 516 nm.
2.20. Mitochondrial morphology study
Briefly, the harvested A549 cells were first fixed in phosphate buffered glutaraldehyde and post-fixed in 1% osmium tetroxide. Thereafter, the fixed cells were immediately dehydrated in ice-cold graded ethanol (50%, 70%, 80%, 90% and 100%). Immediately, samples were incubated in Epon 812/acetone (2:1) overnight and then with pure Epon 812 for 3 h. Next, each sample was allowed to polymerize at different temperatures (30, 45, or 60 °C) for 3 days each. Ultrathin sections (approximately 100 nm) were prepared on an ultra-microtome (Ultracut R, Leica, Heidelberg, Germany). After staining with uranyl acetate and lead citrate, each sample was photographed under a Hitachi transmission electron microscope (TEM, H7650, Tokyo, Japan).
2.21. Mitochondrial stress assay
To assess mitochondrial toxicity induced by HA after irradiation, the oxygen consumption rate (OCR) was measured on a Seahorse Bioscience XF96 Extracellular Flux Analyzer (Billerica, MA, USA) using Wang׳s method.15 Before the mitochondrial stress test, the A549 cells were seeded at 5 × 10³ cells per well onto a 96-well microplate. Two hours after PDT or Dox treatment, 1 µg/mL oligomycin, 0.3 µmol/L carbonyl cyanide 4-(trifluoromethoxy) phenylhydrazone (FCCP) and 0.5 µmol/L of a mixture of antimycin A and rotenone were sequentially injected into the cellular media. The oxygen consumption rate was measured using a phosphorescent oxygen- and hydrogen-sensitive probe. Further analysis of fluorescence intensity time profiles in each well was performed using Seahorse Bioscience XFe Wave software (Billerica, MA, USA).
2.22. Mitochondrial membrane potential (MMP) analysis
JC-1 was applied to investigate the MMP changes after PDT, according to previous studies16. Normally, in healthy cells, JC-1 can selectively enter mitochondria as aggregates and emits red-orange fluorescence. When MMP is lost, JC-1 dissipates into cytoplasm and forms monomers which emitting green fluorescence. After treatment with or without PDT, the cells were stained with JC-1 (10 µg/mL) for 10 min in the dark. The fluorescence intensities of different treatments were detected with a fluorescence microscope. In addition, MMP changes in cells at various times were also observed via flow cytometry analysis for a longer time. The red-orange fluorescence of JC-1 aggregates (λex = 488 nm, λem = 590 nm) was detected in the fluorescence channel FL2 at 585 nm, which can easily be separated from the green JC-1 monomer fluorescence (λex = 488 nm, λem = 527 nm) detected at 530 nm.
2.23. Subcellular fractionation isolation
Mitochondrial protein and cytosol were isolated as follows. The cells were harvested and re-suspended in mitochondrial isolation reagent A with protease inhibitor cocktail. Cell lysate was incubated with 10 μL mitochondrial isolation reagent B for another 5 min. After mitochondrial isolation reagent C was added, the cell fragments and un-lysed cells were removed by 10 min centrifugation at 700×g at 4 °C. Then, mitochondria were harvested by centrifuging the lysate for another 5 min at 12,000×g. The supernatant was saved as the cytoplasmic fraction, and the pellet was saved as the heavy membrane fraction containing mitochondria. Mitochondrial protein extraction was performed by incubating cells with mitochondrial isolation reagent C supplemented with protease inhibitors. The prepared protein samples were further subjected to Western blot analysis.
2.24. Statistical analysis
Prism 6.0 software (GraphPad Software, San Diego, CA, USA) was used for statistical analysis. All results were expressed as the mean±SD. One-way analysis of variance (ANOVA) was used for comparisons of the means. P values less than 0.05 were considered statistically significant.
3. Results
3.1. HA-mediated PDT inhibits the A549 cells proliferation
As illustrated in Fig. 1A, the absorbance spectrum suggested that HA has a strong absorption peak, with three characteristic absorbance bands at 465, 534 and 586 nm. Because the absorption peak approximately 465 nm was the strongest, 470 nm was chosen for the irradiation wavelength for PDT. According to Gao and colleagues17, HA can emit red fluorescence after excitation by light at a wavelength of 543 nm. As depicted in the fluorescence images (Fig. 1B), HA was actively internalized by A549 cells and accumulated in the cytoplasm.
Figure 1.

HA-mediated PDT inhibits of A549 cells proliferation. (A) The structure and UV–Vis absorption spectrum of HA. (B) Cellular uptake of HA in A549 cells determined by fluorescence microscopy, scale bar: 10 μm. A549 cell nuclei were labeled with DAPI. (C) Cytotoxicity of HA with or without 470 nm LED lamp irradiation for 15 min. A549 cells were incubated with various concentrations of HA for 4 h and then treated with or without irradiation for 15 min. Cell viability was measured using CCK-8, 12 or 24 h after irradiation. There was a significant decrease in cell viability in cells treated with HA compared with control or corresponding groups without irradiation. (D) Cell viability of A549 cells exposed to Dox. A549 cells were treated with various concentrations of Dox for 24 h, and cell viability was measured using CCK-8. (E) IC50 values determined from the cytotoxicity results in C and D, which showed that HA exhibited greater cytotoxicity on A549 cells than Dox. All experiments were conducted in triplicate and the results were analyzed for statistical significance. (Data are mean±SD, *P < 0.05, **P < 0.01 when compared with corresponding controls).
The cell viability of HA-mediated photodynamic action and Dox treatment on A549 cells is respectively illustrated in Fig. 1C and D. Dox was chosen as a positive control drug because it is a traditional chemotherapy drug and widely used clinically. HA treatment without LED light irradiation did not cause any significant cytotoxicity in the A549 cells at the tested concentration range. However, when 470 nm LED illumination was employed, HA evoked significantly higher cytotoxicity at relatively low concentrations in the A549 cells than the positive control drug Dox, indicating that HA-mediated PDT remarkably eradicated the A549 cells. Therefore, as summarized in Fig. 1E, the IC50 obtained for HA with irradiation at 12 and 24 h were significantly lower than for Dox at 24 h.
3.2. HA-induced photo-cytotoxicity is mediated by apoptosis, and ROS generation is an important event in HA-induced apoptosis
To obtain proof for the induction of apoptotic death by HA in the A549 cells, characteristic cellular events of apoptosis were examined. As illustrated by DAPI staining results in Fig. 2A, light irradiation with HA at its 2×IC50 concentration remarkably induced apoptosis with condensed cell nuclei in a time-dependent manner. The annexin V-FITC assay by flow cytometry in Fig. 2B showed that HA-mediated PDT significantly increased the apoptotic population of A549 cells. Significant apoptotic population of A549 cells was detected in the HA 24 h treatment group Dox treatment group. The proteolytic cleavage of PARP-1 between Asp216 and Gly217 may also serve as an indicator of apoptosis18. This action cleaves the 116 kDa native enzyme into 36 and 89 kDa fragments. As depicted in Fig. 2C and D, PARP cleavage started to occur at 3 h after HA PDT and was not detected at 24 h. With increased time after PDT, a slight increase in the 89 kDa cleaved band was detected. Moreover, apoptotic DNA is an iconic event of apoptosis because it labels a late point of no return. As shown in Fig. 2E, fragmented DNA was detected in the A549 cells extracts after treatment with both HA and Dox in a time-dependent manner, which is in accordance with DAPI staining results19. In addition, HA-mediated PDT respectively increased the fraction of cells in S phase and in G2-M phases, while decreasing the cells proportion in G0-G1 (Fig. 2F). Similar decrease which is not as dramatic as HA can be found in G0-G1 phases in Dox group, but S phase was increased.
Figure 2.

HA induced ROS-dependent apoptosis after irradiation. (A) Fluorescence microscopy images of DAPI-stained A549 cells showing chromatin condensation after HA-mediated PDT or Dox treatment. (B) Cell membrane phosphatidylserine externalization effects of HA-mediated PDT on A549 cells. A549 cells were collected 12 or 24 h after 0.08 μmol/L HA-PDT or after 26 μmol/L Dox׳s 24 h-treatment and then assayed for apoptosis. The graphs depict the apoptotic populations of cells stained with FITC-labeled annexin V. The results are expressed as percentage of total cells. (C) A549 cells were collected 0–24 h after 0.08 μmol/L HA-PDT, or 24 h after Dox treatment. Aliquots of cell lysates were separated by SDS-PAGE and analyzed for cleaved PARP-1 levels by Western blotting. GAPDH was used as an internal control to monitor for equal loading. (D) Quantitative analysis of relative protein expression in (C). (E) DNA ladder was formed after HA or Dox treatment in a time-dependent manner in A549 cells. (F) Cells were then collected with 0–24 h after 0.08 μmol/L HA PDT or after 26 μmol/L Dox 24 h treatment and assayed for cell cycle phase. (G) Intracellular ROS generation was detected in A549 cells treated with HA under 470 nm LED irradiation. The level of intracellular ROS was measured by a multi-detection microplate reader using the peroxide-sensitive fluorescent probe DCFH-DA. (H) A549 cells were pre-incubated with or without 2 mmol/L NAC for 2 h before exposure to 0.08 μmol/L HA or Dox. Aliquots of cell lysates were separated by SDS-PAGE and analyzed for PARP-1 cleavage. GAPDH was used as a loading control. (I) Quantitative analysis of relative protein expression in (H). All experiments were conducted in triplicate and the results were analyzed for statistical significance (Data are mean±SD, *P < 0.05, **P < 0.01 when compared with corresponding controls).
ROS are free radicals or non-radical species derived from oxygen and plays an important role in PDT. ROS can react with a lot of biomolecules, such as proteins, nucleic acids, and lipids to irreversible damage tumor cells20. The detection of intracellular ROS after cells were exposed to LED light was performed by applying the sensitive ROS probe DCFH-DA21. In our experiment, ROS levels significantly increased (Fig. 2G). After light irradiation with 0.08 μmol/L HA, the cell ROS peaked at 30 min compared to the sham treatment group and then gradually decreased over 150 min. Consistent with Tian and colleagues22, our data suggested HA-mediated PDT caused significant ROS increase within 1 h, confirming that the production of ROS is an early event in HA-mediated PDT. To verify the involvement of ROS in apoptosis induced by HA-mediated PDT, the reactive species scavenger NAC was applied along with PARP-1 detection23. As depicted in Fig. 2H and I, PARP-1 expression levels significantly decreased in A549 cells incubated with NAC.
Together, these findings demonstrated that the photodynamic action of HA induced apoptotic death in A549 cells in a ROS-dependent way.
3.3. HA-induced apoptosis pathways shown by proteomic iTRAQ analysis
Applying iTRAQ combined with nano-LC–MS/MS and software analysis (Mascot 2.2 and Proteome Discoverer 1.4), more than 4000 proteins were identified. Of these, 97 protein spots exhibited statistically significant changes of at least 1.2-fold (down-regulated or up-regulated). Of these altered proteins, 45 were down-regulated and 52 were up-regulated in the PDT-treated group compared with the control group (Supporting Information 1–3). The protein–protein association analysis of the identified proteins shown in (Fig. 3A), was performed using STRING with the following analysis parameters: species—Homo sapiens, confidence level—0.400, and active prediction methods.
Figure 3.

HA-induced apoptosis pathway study via proteomic iTRAQ analysis. (A) The STRING network associations of up-regulated proteins. The 97 differentially expressed proteins were mapped to their network associations using STRING with the following analysis parameters: species—Homo sapiens, confidence level—0.400, active prediction methods. (B) Gene-annotation enrichment analysis of differentially expressed proteins on biological process as identified by DAVID Bioinformatics Resources 6.7. (C) Comparison of biological processes determined by KEGG database in three replicate experiments.
The percentage of many proteins participating in essential biological process identified in this study is shown in Fig. 3B. Due to the presence of highly abundant proteins, the identification of apoptosis-related proteins could be hampered. Even though the apoptosis process proteins only accounted for 1.8% of all identified proteins, they still led cells to the fate of programmed death. As shown in Fig. 3C, the TNF signaling pathway members were the most enriched (P < 0.001). Five proteins involved in apoptosis regulation were enriched: BAG-4, COX-2, NEMO, JunB, and KS6A4 (Table 1), among which JunB and BAG-4 are known as mitochondria related proteins.
Table 1.
The details of key up-regulated proteins (average ratio ≥ 1.2) in protein–protein network in A549 cells after HA-mediated PDT compared to control.
| Protein ID | Protein name | Unique peptides (95%) | MW (kDa) | % Coverage (95%) | Average HA/control ratio | SD | P valuea |
|---|---|---|---|---|---|---|---|
| O75676 | Ribosomal protein S6 kinase a-4 (KS6A4) | 1 | 85.55 | 2.07 | 1.23 | 0.07 | 0.468 |
| A0A087WV30 | NF-kappa-B essential modulator (NEMO) | 2 | 12.97 | 26.96 | 1.29 | 0.07 | 0.031 |
| B2RA34 | BAG family molecular chaperone regulator 4 (BAG-4) | 1 | 49.57 | 3.94 | 1.28 | 0.06 | 0.022 |
| P35354 | Prostaglandin G/H synthase 2 (COX-2) | 3 | 68.95 | 6.79 | 1.47 | 0.09 | 0.019 |
| P17275 | Transcription factor jun-B (Jun-B) | 1 | 35.86 | 4.03 | 1.32 | 0.02 | 0.003 |
P < 0.05 is considered as statistically significant when compared with control.
3.4. Mitochondrial involvement in apoptosis after HA-mediated PDT
To further elucidate whether the apoptosis observed in this study occurred via the mitochondrial intrinsic pathway or whether TNF pathway also contributes to PDT-induced apoptosis, pan-caspase inhibitor and specific caspase inhibitors were used along with the cytotoxicity assay and PARP-1 cleavage detection to further investigate caspase dependency. As revealed in Fig. 4A–F, the caspase-8 inhibitor did not remarkably inhibit apoptotic death. However, apoptosis was significantly blocked by the pan-caspase and caspase-9 inhibitors.
Figure 4.

HA induced apoptosis through a mitochondrial pathway. (A), (C), and (E) A549 cells were pre-incubated with or without 20 μmol/L z-VAD-fmk, z-IETD-fmk or z-LEHD-fmk overnight before exposure to 0.08 μmol/L HA for 6 h. Aliquots of cell lysates were separated by SDS–PAGE and analyzed for PARP-1 cleavage. GAPDH was used as a loading control. (B), (D) and (F) Quantitative analysis of relative protein expression in (A), (B), and (C). (G) Subcellular localization of HA with confocal laser scanning microscopy (CLSM) (magnification, 100 ×; scale bar 10 μm). (H) Mitochondrial membrane potential changes were recorded by fluorescence microscopy (scale bar: 50 μm). (I) Quantitative analysis of red/green fluorescence intensity ratio of JC-1 in (H). (J) The ultrastructural morphological changes of mitochondria in A549 cells under a transmission electron microscopy 1–2 h after photodynamic action of 0.08 μmol/L HA (scale bar: 2 μm). (K) Time-dependent effects of HA-mediated PDT on the mitochondrial respiration of A549 cells. (L) Cell basal respiration, maximal respiration and ATP production the mitochondrial OCR data analysis in (K). All experiments were conducted in triplicate and the results were analyzed for statistical significance (Data are mean±SD, *P < 0.05, **P < 0.01 when compared with corresponding controls).
Subcellular localization of PS is a crucial factor in determining the type of cell death due to the generated ROS responsible for the oxidatively generated damage. In this work, HA readily passed through cell membranes, accumulated the most within cells, and exhibited red fluorescence mainly in the cytoplasmic mitochondrial region (Fig. 4G). Little evidence was provided for HA penetration into the nucleus from the culture. Furthermore, short-term changes of MMP were observed with a fluorescence microscope using probe JC-1. At 1 and 2 h after PDT, the red/green fluorescent ratio was decreased suggesting a decreasing MMP in A549 induced by PDT (Fig. 4H and I). Meanwhile, the positive control group achieved similar results after 2 h of Dox treatment. To further investigate the influence caused by photodynamic action of HA on the ultrafter PDT under TEM. The mitochondria of A549 cells in the control group exhibited complete double membrane structures with a perfect inner membrane and a smooth outer membrane. However, in PDT groups, the ultra-structural evidence of mitochondria presented swelling and distorted cristae, and the morphologically structure of mitochondrial outer membrane was disordered and incomplete for 1 and 2 h with HA-treatment (Fig. 4J). Moreover, the double membrane structure of mitochondria was injured. These results suggested that HA directly caused a rapid damage to the mitochondrial morphology after HA-mediated PDT.
Measuring mitochondrial respiration kinetics with the Seahorse analyzer allowed us to determine mitochondrial oxygen consumption rates and stress levels over time following HA and irradiation exposure by studying the effect of toxic agents on three critical stages of respiration. After exposing the A549 cells to different concentrations of HA (0.04 and 0.08 μmol/L) and Dox and running the bioenergetics stages, we calculated ATP-linked respiration and respiratory capacity. As depicted in the Seahorse bioenergetics map (Fig. 4K), PDT-treated cells exhibited dramatic changes in all three stages of mitochondrial respiration, in contrast to control cells. Quantitative analysis showed a dose-dependent decrease in basal respiration, maximal respiration and ATP-linked respiration produced by HA. At the doses of 0.04 and 0.08 μmol/L HA, mitochondrial oxygen consumption did not recover following FCCP treatment, indicating that these dose ranges irreversibly damage mitochondrial function (Fig. 4L). Similarly, Dox exposure (26 μmol/L) also decreased the three stages which were all exceedingly low in less than 2 h. However, a relatively low concentration of HA (0.005 μmol/L) significantly decreased basal and maximal respiration as well as ATP generation, which may be related to the mitochondrial membrane enzyme damage caused by HA-induced ROS. Collectively, comparing the bioenergetics data of HA and Dox, HA had more potent dysfunction ability on mitochondria than Dox and profoundly impaired mitochondrial respiration in A549 cells.
3.5. Involvement of MMP in mitochondrial cytochrome c release
As revealed by JC-1 staining, without any treatment, the MMP dependent formation of JC-1 aggregates in the mitochondria of the A549 cells remained relatively high ratio. 1.5 h after HA-mediated PDT, these JC-1 aggregates were significantly decreased, implying a very quick depletion of mitochondrial membrane potential after of treatment (Fig. 5A and B). After a slight recover at 3 h, the fluorescence of JC-1 aggregates experienced a sharp increase and finally decreased to 67.8% at 24 h. To further study the relation between MMP depletion and cytochrome release, subcellular fractionation isolation and Western blot of cytochrome c was conducted. As depicted in Fig. 5C–E, cytochrome c release started at 1.5 h and was peaked at 3 h. And then after a gradual decrease at 9 h, cytochrome c increased again at 12 h and finally decreased at 24 h, which was consistent with the MMP results determined by JC-1.
Figure 5.

Mitochondrial morphology changes and dysfunction during apoptosis. (A) Flow cytometry analysis of mitochondrial membrane potential of A549 cells stained with JC-1. JC-1 fluorescence histograms show the overlay of control and cells. (B) Quantitative analysis of JC-1 fluorescence intensity. (C) Expression of cytochrome c protein by Western blotting analysis expressed in heavy membrane-containing mitochondria and cytosolic fractions after 15 min irradiation; GAPDH was used as a loading control. (D) and (E) Quantitative analysis of the relative protein expression in (C). All experiments were conducted in triplicate and the results were analyzed for statistical significance (Data are mean±SD, *P < 0.05, **P < 0.01 when compared with corresponding controls).
3.6. Downstream caspase activation partially contributes to HA-mediated PDT-induced apoptosis
Most functional activities of these proteins modulate apoptosis through the caspase-dependent pathway24. Caspases are major mediators of apoptosis that are synthesized as zymogens or pro-caspases with negligible activity and their activation depends on proteolytic cleavage of the procaspase into a smaller, enzymatically active form. Then, the enzymatically active caspases in turn regulate apoptosis and coordinate the process of cellular demolition. In this work, after 1.5 h, the significant initial enzyme activities of caspase-9 were detected, reaching maximum values at 3 h. For caspase-3 and caspase-7, remarkable cleavage was observed at 9 h after illumination, which then decreased after 24 h of treatment (Fig. 6).
Figure 6.

Caspase involvement in apoptosis process after HA-mediated PDT. (A) Western Blot results of caspase activation at 0–24 h after HA-mediated PDT. GAPDH was used as a loading control. (B), (C), and (D) Quantitative analysis of relative protein expression in (A). All experiments were conducted in triplicate and the results were analyzed for statistical significance (Data are mean±SD, *P < 0.05, **P < 0.01 when compared with corresponding controls).
4. Discussion
The precise photo-induced cytotoxicity mechanism in response to HA-mediated photodynamic treatment is controversial in recent studies. The purpose of this study was to develop HA as a potential photodynamic drug by elucidating the molecular mechanism of its anti-cancer action.
In present work, we demonstrated that HA can evoke a remarkable cytotoxicity effect in A549 cells under 470 nm LED irradiation. Dox, a first-line chemotherapeutic, was chosen as a positive control, because it is well-studied and reported with apoptosis inducing mechanism by interfering with mitochondria25. By comparing with Dox, which is severely cardiotoxic and induced multidrug resistance easily, we verified that HA has a comparatively lower side effect but a significantly higher cytotoxicity.
Apoptosis, a process of gene-mediated programmed cell death, was widely found as a cellular signing pathway in PDT. To further investigate the death mechanism that A549 cells undergo after exposure to HA and LED light, characteristic cellular hallmarks of apoptotic cell death were examined. Externalized phosphotidylserine, elevated PARP-1 expression, condensed chromatin and fragmented DNA suggested that HA kills cancer cells via inducing apoptotic cell death. Additionally, we discovered that free radical quencher NAC remarkably inhibited the apoptosis, indicating that this apoptosis was ROS-dependent. To shed more light on the detailed action of the apoptosis mechanism of HA during PDT, we performed functional proteomic analysis in conjunction with other biochemical techniques.
The iTRAQ approaches, among the proteomic technological advances, have allowed new assessments of drug molecular mechanisms at a protein scale in many studies, providing new insights into the associated molecular pathways of anticancer drugs26., 27.. In the five up-regulated apoptosis-involved proteins in KEGG pathway analysis of iTRAQ data (Fig. 3B and Supporting Information 4 and 5), JunB and BAG-4 were associated with mitochondria28. It is reported that JunB mediates the survival response in cell exposed to H2O2 by reducing mitochondria stress or BCL-2 reduction29. Moreover, JunB can induce apoptosis through activation of caspase-3, -8, and members of the HSP70 family and HSP60. Meanwhile, BAG-4 is a mitochondria survival protein that protect against apoptosis by binding or simulating BCL-2 or BCL-XL30, which are both anti-apoptotic proteins and proved undergo directly photochemical damage after PDT31. These findings implied that mitochondria may undergo stress and contribute to apoptotic cell death after PDT in the A549 cells and caspase might act as a downstream event in apoptotic process. On the other hand, the other three up-regulated proteins (KS6A4, NEMO and COX-2), are often found in NF-κB pathway, which is closely associated with the extrinsic TNF pathway. NEMO, along with IκB kinase 1 and 2, participate in IκB kinase complex (IKK) formation which plays a vital role in NF-κB pathway via phosphorylating the inhibitory IκBα protein32. Up-regulated KS6A4 is reported that it can directly phosphorylate IκB. The phosphorylation of IκBα protein by IKK in turn allows NF-κB to translocate to the nucleus, bind DNA, and initiate transcription of mostly specific anti-apoptotic pro-survival genes, such as COX-233. Growing evidence show that NF-κB can be activated by ROS to cope with intracellular redox homeostasis changes34. Therefore, judging by up-regulation of these three proteins, we assumed that NF-κB could be activated by HA-induced ROS after irradiation and may act as a stress response reaction toward the ROS stimuli. In addition, up-regulated COX-2 expression is a general response of tumor cells to photodynamic damage35. Because COX-2 inhibition directly potentiated tumor response to PDT36, pharmacological inhibition of COX-2 should enhance anti-cancer efficiency or reduce tumor resistance to the HA-based PDT.
No matter the extrinsic or intrinsic apoptosis pathway, signaling pathways often involved and eventually converge upon the activation of the family of cysteine proteases, which is called the caspase cascade37. Different pathways are often characterized with different caspases involved in the upstream apoptosis process. The intrinsic pathway is characterized by caspase-9 and caspase-3 activation and cytochrome c release from mitochondria to cytoplasm, while the extrinsic pathway is initiated the intracellular formation of a death induced signaling complex (DISC) and recruitment and activation of proximal pro-caspase-8 and pro-caspase-10 molecules. As revealed in our caspase dependency evaluation with different inhibitors, the caspase 8 inhibitor failed to remarkably block apoptotic cell death, while the pan-caspase or caspase-9 inhibitor significantly blocked the apoptosis, indicating NF-κB could be involved in the anti-apoptosis response. Similar conclusion can be found in Matroule and colleagues׳ study38 on aminopyropheophorbide-mediated photosensitization in HCT-116 cells. Therefore, our hypothesis that the intrinsic mitochondria pathway might participate more actively in the apoptosis process was confirmed.
Encouraging results demonstrated that mitochondria-involved apoptosis plays an irreplaceable role in PDT mediated by hypocrellin and its derivatives39. Fu et al.40 first demonstrated that the photodynamic effect of HA could inhibit the mitochondrial ATPase of hepatoma cells in vitro after irradiation by high-voltage sodium light. Moreover, Jiang et al.41 found that hypocrellin B damaged the mitochondrial structure of ovarian cancer HO-8910 cells after PDT. Recently, Zhao׳s group demonstrated that 17-(3-amino-1-pentanesulfonic acid)-substituted hypocrellin B Schiff-base (PENSHB)-mediated PDT decreased the mitochondrial inner membrane potential, subsequently releasing cytochrome c and inducing apoptotic death42. In the present study, we systematically studied mitochondrial involvement in the photo-induced apoptosis due to HA-mediated photodynamic action.
Subcellular localization revealed that HA was actively taken up into the cytoplasm and localized to mitochondria. Similar mitochondrial subcellular localization results can be found in El-Sikhry and co-workers׳ study with hypocrellin derivative SL01738. Mitochondria are the main source of energy metabolism, ATP generation required for cellular homeostasis43., 44.. Otto Warburg first observed that cancer cells consume more glucose and produce more lactate than many nonmalignant cells. Therefore, mitochondrial of cancer cells are under intrinsically increased oxidative stress and vulnerable to ROS-induced apoptosis45. Selectively targeting cancer cell mitochondria represent an enticing option for future anticancer therapy46. Furthermore, numerous studies reported that interaction of light leads to excitation of HA in a triplet state which is able to react directly with substrate from cell to form radical. Those radicals subsequently transfer energy to molecule oxygen to produce ROS7., 47., which explained our ROS formation and dependency results. Considering the mitochondrial characteristics and our results, we can safely conclude that the subcellular location of HA is beneficial for light-sensitive anti-cancer treatment. Additionally, this selective mitochondrial targeting might explain the remarkably higher photo-cytotoxicity compared to Dox.
To investigate the downstream events after ROS generation that cells undergo, we investigated the mitochondrial ultrastructural damage, functional injury, and membrane potential depolarization in response to ROS formation. Intact mitochondria of cancer cells generally maintain a high membrane potential. One explanation for mitochondrial depolarization in our study might be the onset of the mitochondrial permeability transition (MPT), which is a consequence of the opening of permeability transition pores in the mitochondrial inner membrane48. Growing evidence shows that among the numerous factors regulating the permeability transition (PT) pore, ROS can induce the PT pore opening49. Thus, the mitochondrial depolarization detected in this study may be related to PT pore opening caused by HA-induced ROS generation. As a consequence of PT pore opening, mitochondria uncouple and undergo large amplitude swelling and respiration functional injury. The outer membrane ruptures during of mitochondria swelling easily cause the release of mitochondrial intermembrane factors, including some apoptosis-inducing proteins, to the cytosol which in turn induces cell apoptosis via provoking the caspase cascade.
The most widely studied of these released mitochondria polypeptides is cytochrome c, a component of the electron transport chain that is loosely bound to the outer leaflet of the inner mitochondrial membrane. According to previous studies, once cytochrome c appears in the cytoplasm, it binds to cytoplasmic scaffolding molecule apoptosis activating factor-1 (APAF-1) to form the “apoptosome” complex and initiate activation of the cascade of caspases that carry out the final stages of apoptosis50. It is also known that the activation of initiator pro-caspases requires the intracellular formation of a molecular platform in which adaptor proteins and pro-caspase molecules are recruited, leading to dimerization and autocatalytic activation of the proteases. After procaspase-9 binds to this Apaf-1 and cytochrome c complex, caspase-9 can be released. Then, proteolytically activated caspase-3 and caspase-7 further initiate cellular disassembly. Consistent with these reports, we found that cytochrome c was released from the mitochondria to the cytoplasm after the MMP depletion upon HA-mediated Light irradiated (Fig. 5A and C–E). The loss of MMP could preceded the release of cytochrome c and further activated downstream effectors as depicted in Fig. 6A. Subsequent activation of the caspase cascade results in the expression of the characteristic features of apoptosis such as DNA fragmentation and chromatin condensation, as we discovered above.
5. Conclusions
In summary, HA was investigated as a potential photosensitizer for antitumor effects on A549 cells in vitro. HA-mediated oxidative injury acts as an early upstream change in the cell death cascade to antagonize the cyto-protective NF-κB signaling, triggering mitochondrial dysfunction, MMP changes, mitochondrial cytochrome c release, caspase activation, and consequent apoptosis (Fig. 7). The understanding of the molecular basis of drug mechanisms can lead to translational impacts and provide valuable information for future therapeutic applications of hypocrellin or its derivatives. Additionally, iTRAQ analysis on HA-evoked apoptosis may shed light on combination therapies of future PDT for higher efficiency or fewer side effects. It deserves to fully study the photo-sensitive cytotoxicity of HA with in vivo evaluations in future study.
Figure 7.

Schematic illustration of the mechanism on apoptosis inducing effected of HA-based PDT.
Acknowledgments
This study was supported by the National Natural Science Foundation of China (Project No. 81673214). The National Key Technology Research and National Key Technology Research and Development Program of the Ministry of Science and Technology of the People׳s Republic of China (Project No. 2012BAD36B0502) and the Priority Academic Program Development of Jiangsu Higher Educational Institutions (China).
Footnotes
Peer review under responsibility of Institute of Materia Medica, Chinese Academy of Medical Sciences and Chinese Pharmaceutical Association.
Supplementary data associated with this article can be found in the online version at https://doi.org/10.1016/j.apsb.2018.12.004.
Contributor Information
Shuqin Yu, Email: yushuqin@njnu.edu.cn.
Shuanglin Chen, Email: chenshuanglin@njnu.edu.cn.
Appendix A. Supplementary material
Supplementary material
.
Supplementary material
.
Supplementary material
.
Supplementary material
.
Supplementary material
.
References
- 1.Jemal A., Bray F., Center M.M., Ferlay J., Ward E., Forman D. Global cancer statistics. Cancer J Clin. 2011;61:69–90. doi: 10.3322/caac.20107. [DOI] [PubMed] [Google Scholar]
- 2.Monsuez J.J., Charniot J.C., Vignat N., Artigou J.Y. Cardiac side-effects of cancer chemotherapy. Int J Cardiol. 2010;144:3–15. doi: 10.1016/j.ijcard.2010.03.003. [DOI] [PubMed] [Google Scholar]
- 3.Dougherty T.J., Grindey G.B., Fiel R., Weishaupt K.R., Boyle D.G. Photoradiation therapy. II. Cure of animal tumors with hematoporphyrin and light. J Natl Cancer Inst. 1975;55:115–121. doi: 10.1093/jnci/55.1.115. [DOI] [PubMed] [Google Scholar]
- 4.Allison R.R., Sibata C.H. Oncologic photodynamic therapy photosensitizers: a clinical review. Photodiagn Photodyn Ther. 2010;7:61–75. doi: 10.1016/j.pdpdt.2010.02.001. [DOI] [PubMed] [Google Scholar]
- 5.Wu H.M., Lao X.F., Wang Q.W., Lu R.R., Shen C.Y., Zhang F.X. The Shiraiachromes: novel fungal perylenequinone pigments from Shiraia bambusicola. J Nat Prod. 1989;52:948–951. [Google Scholar]
- 6.Diwu Z. Novel therapeutic and diagnostic applications of hypocrellins and hypericins. Photochem Photobiol. 1995;61:529–539. doi: 10.1111/j.1751-1097.1995.tb09903.x. [DOI] [PubMed] [Google Scholar]
- 7.Zhang J., Cao E.H., Li J.F., Zhang T.C., Ma W.J. Photodynamic effects of hypocrellin A on three human malignant cell lines by inducing apoptotic cell death. J Photochem Photobiol, B. 1998;43:106–111. doi: 10.1016/S1011-1344(98)00092-X. [DOI] [PubMed] [Google Scholar]
- 8.Fei X.F., Jie C., Zheng K.Y., Wei W., Sun S.J., Li W. Apoptotic effects of hypocrellin A on HeLa cells. Chem Res Chin Univ. 2006;22:772–775. [Google Scholar]
- 9.Kishi T., Tahara S., Taniguchi N., Tsuda M., Tanaka C., Takahashi S. New perylenequinones from Shiraia bambusicola. Planta Med. 1991;57:376–379. doi: 10.1055/s-2006-960121. [DOI] [PubMed] [Google Scholar]
- 10.Qi S.S., Lin X., Zhang M.M., Yan S.Z., Yu S.Q., Chen S.L. Preparation and evaluation of hypocrellin A loaded poly(lactic-co-glycolic acid) nanoparticles for photodynamic therapy. RSC Adv. 2014;4:40085–40094. [Google Scholar]
- 11.Rohlena J., Dong L.F., Ralph S.J., Neuzil J. Anticancer drugs targeting the mitochondrial electron transport chain. Antioxid Redox Sign. 2011;15:2951–2974. doi: 10.1089/ars.2011.3990. [DOI] [PubMed] [Google Scholar]
- 12.Dennis G., Sherman B.T., Hosack D.A., Yang J., Gao W., Lane H.C. DAVID: database for annotation, visualization, and integrated discovery. Genome Biol. 2003;4(R60):1–11. [PubMed] [Google Scholar]
- 13.Szklarczyk D., Franceschini A., Kuhn M., Simonovic M., Roth A., Minguez P. The STRING database in 2011: functional interaction networks of proteins, globally integrated and scored. Nucleic Acids Res. 2011;39:561–568. doi: 10.1093/nar/gkq973. [DOI] [PMC free article] [PubMed] [Google Scholar]
- 14.Ogata H., Goto S., Sato K., Fujibuchi W., Bono H., Kanehisa M. KEGG: kyoto encyclopedia of genes and genomes. Nucleic Acids Res. 1999;27:29–34. doi: 10.1093/nar/27.1.29. [DOI] [PMC free article] [PubMed] [Google Scholar]
- 15.Wang D.F., Rong W.T., Lu Y., Hou J., Qi S.S., Xiao Q. TPGS2k/PLGA nanoparticles for overcoming multidrug resistance by interfering mitochondria of human alveolar adenocarcinoma cells. ACS Appl Mater Interfaces. 2015;7:3888–3901. doi: 10.1021/am508340m. [DOI] [PubMed] [Google Scholar]
- 16.Lu Y., Wang Y.Y., Yang N., Zhang D., Zhang F.Y., Gao H.T. Food emulsifier polysorbate 80 increases intestinal absorption of di-(2-ethylhexyl) phthalate in rats. Toxicol Sci. 2014;139:317–327. doi: 10.1093/toxsci/kfu055. [DOI] [PubMed] [Google Scholar]
- 17.Gao L., Fei J., Zhao J., Li H., Cui Y., Li J. Hypocrellin-loaded gold nanocages with high two-photon efficiency for photothermal/photodynamic cancer therapy in vitro. ACS Nano. 2012;6:8030–8040. doi: 10.1021/nn302634m. [DOI] [PubMed] [Google Scholar]
- 18.Soldani C., Scovassi A.I. Poly(ADP-ribose) polymerase-1 cleavage during apoptosis: an update. Apoptosis. 2002;7:321–328. doi: 10.1023/a:1016119328968. [DOI] [PubMed] [Google Scholar]
- 19.Gong J.P., Traganos F., Darzynkiewicz Z. A selective procedure for DNA extraction from apoptotic cells applicable for gel electrophoresis and flow cytometry. Anal Biochem. 1994;218:314–319. doi: 10.1006/abio.1994.1184. [DOI] [PubMed] [Google Scholar]
- 20.Zhang J., Jiang C.S., Longob J.P., Azevedo R.B., Zhang H., Muehlmann L.A. An updated overview on the development of new photosensitizers for anticancer photodynamic therapy. Acta Pharm Sin B. 2018;8:137–146. doi: 10.1016/j.apsb.2017.09.003. [DOI] [PMC free article] [PubMed] [Google Scholar]
- 21.Crow J.P. Dichlorodihydrofluorescein and dihydrorhodamine 123 are sensitive indicators of peroxynitrite in vitro: implications for intracellular measurement of reactive nitrogen and oxygen species. Nitric Oxide. 1997;1:145–157. doi: 10.1006/niox.1996.0113. [DOI] [PubMed] [Google Scholar]
- 22.Tian Y., Leung W., Yue K., Mak N. Cell death induced by MPPa-PDT in prostate carcinoma in vitro and in vivo. Biochem Biophys Res Commun. 2006;348:413–420. doi: 10.1016/j.bbrc.2006.07.071. [DOI] [PubMed] [Google Scholar]
- 23.Dhanda S., Kaur S., Sandhir R. Preventive effect of N-acetyl-l-cysteine on oxidative stress and cognitive impairment in hepatic encephalopathy following bile duct ligation. Free Radic Biol Med. 2013;56:204–215. doi: 10.1016/j.freeradbiomed.2012.09.017. [DOI] [PubMed] [Google Scholar]
- 24.Cohen G.M. Caspases: the executioners of apoptosis. Biochem J. 1997;326:1–16. doi: 10.1042/bj3260001. [DOI] [PMC free article] [PubMed] [Google Scholar]
- 25.Rohlena J., Dong L.F., Ralph S.J., Neuzil J. Anticancer drugs targeting the mitochondrial electron transport chain. Antioxid redox Sign. 2011;15:2951–2974. doi: 10.1089/ars.2011.3990. [DOI] [PubMed] [Google Scholar]
- 26.Lai S.L., Wong P.F., Lim T.K., Lin Q., Mustafa M.R. Cytotoxic mechanisms of panduratin A on A375 melanoma cells: a quantitative and temporal proteomics analysis. Proteomics. 2015;15:1608–1621. doi: 10.1002/pmic.201400039. [DOI] [PubMed] [Google Scholar]
- 27.Mo Y., Hou H., Li D., Liang Y., Chen D., Zhou Y. Mitochondrial protein targets of radiosensitisation by 1,8-dihydroxy-3-acetyl-6-methyl-9,10 anthraquinone on nasopharyngeal carcinoma cells. Eur J Pharmacol. 2014;738:133–141. doi: 10.1016/j.ejphar.2014.05.027. [DOI] [PubMed] [Google Scholar]
- 28.Son Y.O., Heo J.S., Kim T.G., Jeon Y.M., Kim J.G., Lee J.C. Over-expression of JunB inhibits mitochondrial stress and cytotoxicity in human lymphoma cells exposed to chronic oxidative stress. BMB Rep. 2010;43:57–61. doi: 10.5483/bmbrep.2010.43.1.057. [DOI] [PubMed] [Google Scholar]
- 29.Kabbage M., Dickman M.B. The BAG proteins: a ubiquitous family of chaperone regulators. Cell Mol Life Sci. 2008;65:1390–1402. doi: 10.1007/s00018-008-7535-2. [DOI] [PMC free article] [PubMed] [Google Scholar]
- 30.Deng J. How to unleash mitochondrial apoptotic blockades to kill cancers? Acta Pharm Sin B. 2017;7:18–26. doi: 10.1016/j.apsb.2016.08.005. [DOI] [PMC free article] [PubMed] [Google Scholar]
- 31.Xue L., Chiu S., Fiebig A., Andrews D.W., Oleinick N.L. Photodamage to multiple Bcl-xL isoforms by photodynamic therapy with the phthalocyanine photosensitizer Pc 4. Oncogene. 2003;22:9197–9204. doi: 10.1038/sj.onc.1207019. [DOI] [PubMed] [Google Scholar]
- 32.Gilmore T.D. Introduction to NF-κB: players, pathways, perspectives. Oncogene. 2006;25:6680–6684. doi: 10.1038/sj.onc.1209954. [DOI] [PubMed] [Google Scholar]
- 33.Grosch S., Tegeder I., Niederberger E., Brautigam L., Geisslinger G. COX-2 independent induction of cell cycle arrest and apoptosis in colon cancer cells by the selective COX-2 inhibitor celecoxib. FASEB J. 2001;15:2742–2744. doi: 10.1096/fj.01-0299fje. [DOI] [PubMed] [Google Scholar]
- 34.Volanti C., Matroule J.Y., Piette J. Involvement of oxidative stress in NF-κB activation in endothelial cells treated by photodynamic therapy. Photochem Photobiol. 2002;75:36–45. doi: 10.1562/0031-8655(2002)075<0036:ioosin>2.0.co;2. [DOI] [PubMed] [Google Scholar]
- 35.Agostinis P., Buytaert E., Breyssens H., Hendrickx N. Regulatory pathways in photodynamic therapy induced apoptosis. Photochem Photobiol Sci. 2004;3:721–729. doi: 10.1039/b315237e. [DOI] [PubMed] [Google Scholar]
- 36.Ferrario A., Von T.K., Wong S., Luna M., Gomer C.J. Cyclooxygenase-2 inhibitor treatment enhances photodynamic therapy-mediated tumor response. Cancer Res. 2002;62:3956–3961. [PubMed] [Google Scholar]
- 37.Denicourt C., Dowdy S.F. Medicine. Targeting apoptotic pathways in cancer cells. Science. 2004;305:1411–1413. doi: 10.1126/science.1102974. [DOI] [PubMed] [Google Scholar]
- 38.Matroule J.Y., Hellin A.C., Morliere P., Fabiano A.S., Santus R., Merville M.P. Role of nuclear factor-κB in colon cancer cell apoptosis mediated by aminopyropheophorbide photosensitization. Photochem Photobiol. 1999;70:540–548. [PubMed] [Google Scholar]
- 39.El-Sikhry H.E., Miller G.G., Madiyalakan M.R., Seubert J.M. Sonodynamic and photodynamic mechanisms of action of the novel hypocrellin sonosensitizer, SL017: mitochondrial cell death is attenuated by 11,12-epoxyeicosatrienoic acid. Investig New Drugs. 2011;29:1328–1336. doi: 10.1007/s10637-010-9495-2. [DOI] [PubMed] [Google Scholar]
- 40.Fu N.W., Chu Y.X. Photodynamic action of hypocrellin A on hepatoma cell mitochondria and microsomes. Acta Pharmacol Sin. 1989;10:371–373. [PubMed] [Google Scholar]
- 41.Jiang Y., Leung A.W., Xiang J., Xu C. LED light-activated hypocrellin B induces mitochondrial damage of ovarian cancer cells. Int J Photoenergy. 2012;2012:1–5. [Google Scholar]
- 42.Zhao H., Yin R., Chen D., Ren J., Wang Y., Zhang J. In vitro and in vivo antitumor activity of a novel hypocrellin B derivative for photodynamic therapy. Photodiagnosis Photodyn Ther. 2014;11:204–212. doi: 10.1016/j.pdpdt.2014.01.003. [DOI] [PubMed] [Google Scholar]
- 43.Kowaltowski A.J., Souza-Pinto N.C.D., Castilho R.F., Vercesi A.E. Mitochondria and reactive oxygen species. Free Radic Bio Med. 2009;47:333–343. doi: 10.1016/j.freeradbiomed.2009.05.004. [DOI] [PubMed] [Google Scholar]
- 44.Vaghy P.L. Role of mitochondrial oxidative phosphorylation in the maintenance of intracellular pH. J Mol Cell Cardiol. 1979;11:933–940. doi: 10.1016/0022-2828(79)90385-7. [DOI] [PubMed] [Google Scholar]
- 45.Koppenol W.H., Bounds P.L., Dang C.V. Otto Warburg׳s contributions to current concepts of cancer metabolism. Nat Rev Cancer. 2011;11:325–327. doi: 10.1038/nrc3038. [DOI] [PubMed] [Google Scholar]
- 46.Cheng G., Zielonka J., Dranka B.P., McAllister D., Mackinnon A.C. Jr, Joseph J. Mitochondria-targeted drugs synergize with 2-deoxyglucose to trigger breast cancer cell death. Cancer Res. 2012;72:2634–2644. doi: 10.1158/0008-5472.CAN-11-3928. [DOI] [PMC free article] [PubMed] [Google Scholar]
- 47.Lu Z., Tao Y., Zhou Z., Zhang J., Li C., Ou L.C. Mitochondrial reactive oxygen species and nitric oxide-mediated cancer cell apoptosis in 2-butylamino-2-demethoxyhypocrellin B photodynamic treatment. Free Radic Biol Med. 2006;41:1590–1605. doi: 10.1016/j.freeradbiomed.2006.08.021. [DOI] [PubMed] [Google Scholar]
- 48.Lam M., Oleinick N.L., Nieminen A.L. Photodynamic therapy-induced apoptosis in epidermoid carcinoma cells. Reactive oxygen species and mitochondrial inner membrane permeabilization. J Biol Chem. 2001;276:47379–47386. doi: 10.1074/jbc.M107678200. [DOI] [PubMed] [Google Scholar]
- 49.Kim J.S., Wang J.H., Lemasters J.J. Mitochondrial permeability transition in rat hepatocytes after anoxia/reoxygenation: role of Ca2+-dependent mitochondrial formation of reactive oxygen species. Am J Physiol: Gastrointest Liver Physiol. 2012;302:G723–G731. doi: 10.1152/ajpgi.00082.2011. [DOI] [PMC free article] [PubMed] [Google Scholar]
- 50.Zou H., Li Y.C., Liu H.S., Wang X.D. An APAF-1 center dot cytochrome c multimeric complex is a functional apoptosome that activates procaspase-9. J Biol Chem. 1999;274:11549–11556. doi: 10.1074/jbc.274.17.11549. [DOI] [PubMed] [Google Scholar]
Associated Data
This section collects any data citations, data availability statements, or supplementary materials included in this article.
Supplementary Materials
Supplementary material
Supplementary material
Supplementary material
Supplementary material
Supplementary material