Abstract
Fluorescent nanodiamonds (fNDs) represent an emerging class of nanomaterials offering great opportunities for ultrahigh resolution imaging, sensing and drug delivery applications. Their biocompatibility, exceptional chemical and consistent photostability renders them particularly attractive for correlative light-electron microscopy studies providing unique insights into nanoparticle-cell interactions. Herein, we demonstrate a stringent procedure to image and quantify fNDs with a high contrast down to the single particle level in cells. Individual fNDs were directly visualized by energy-filtered transmission electron microscopy, that is, inside newly forming, early endosomal vesicles during their cellular uptake processes as well as inside cellular organelles such as a mitochondrion. Furthermore, we demonstrate the unequivocal identification, localization, and quantification of individual fNDs in larger fND clusters inside intracellular vesicles. Our studies are of great relevance to obtain quantitative information on nanoparticle trafficking and their various interactions with cells, membranes, and organelles, which will be crucial to design-improved sensors, imaging probes, and nanotherapeutics based on quantitative data.
Keywords: Correlative light-electron microscopy, energy-filtered transmission electron microscopy, nanoparticle quantification, nanodiamond, particle-cell interactions
During the past decades, nanoparticles have transformed biomedicine as traceable drug carriers and sensitive probes for therapy and diagnostics.1 They have provided important insights into diseases and serve as a valuable platform for imaging and therapy of, for example, cancer cells and tissue in (pre)clinical studies.2 To further advance nanomedicine approaches and to avoid risks of nanoparticle-induced toxicity, a deeper understanding of nanoparticle-cell interactions3,4 during their cellular uptake processes,5,6 intracellular release, and trafficking7 is crucial. Light microscopy (LM) and transmission electron microscopy (TEM) have been applied to visualize nanoparticle–cell interactions. However, classical LM is limited by the wavelength of light and does not provide resolution beyond the diffraction limit (∼200 nm).8 Super-resolution techniques such as stimulated emission depletion (STED), stochastic optical reconstruction microscopy (STORM), photoactivated localization microscopy (PALM), or super-resolution optical fluctuation imaging (SOFI) enabled resolutions down to the nanometer scale9,10 but these optical imaging techniques require very photostable fluorescent markers. Super-resolution microscopy techniques like STED provide spatial resolution of 40 nm in HeLa cells, which is still about 100 times lower compared to the resolution of TEM (below 1 nm) and surrounding structures could not be imaged.11,12 In contrast, electron microscopy provides morphological visualization at unmatched resolution without the need to apply specific marker molecules. Recently, correlative light-electron microscopy (CLEM) has emerged as the method of choice to gain unique insights into exo- and endogenous cellular structures and to precisely localize endogenous proteins11,13,14 or nanoparticles with high resolution providing important information on, for example, transporter trafficking15 and membrane uptake.16,17 Quantum dots (QDs) and gold nanoparticles have been applied as imaging probes for CLEM but they are limited by their weak fluorescence,18 blinking problems of QDs,19 and their inherent cytotoxicity, raising various concerns for long-term in vitro and in vivo studies.20,21
Fluorescent nanodiamonds (fNDs) have emerged as promising and biocompatible22 imaging probes in LM, and they have been used for traceable drug delivery as well as nanoscale-sensing applications.22 These carbon-based nanoparticles with nitrogen vacancy (NV–) defect color centers23−26 provide stable fluorescence without blinking, which represents an ideal prerequisite for single-particle tracking23,27 and super-resolution studies28 in cells. In addition, the unique magneto-optical properties of NV– centers in diamond allow sensing of local magnetic fields,29 temperature,30−32 electric potentials,33 and pH value30 with high sensitivity in living cells.
We have established a straightforward imaging approach using high-precision CLEM and dark-field energy filtered transmission electron microscopy (EFTEM) to localize fNDs in cells down to the single particle level. Until now, single fND tracking remained challenging34−36 and only information on their approximate location and tracking paths was resolved. In previous work, image quality of NDs in CLEM studies was limited due to the weak contrast of the all-carbon composition of the diamond lattice, which has a similar chemical composition as the resin matrix used in EM preventing imaging of individual fNDs37,38 due to their low contrast within cells.38−40 Attempts to increase contrast and detectability in EM and/or LM focused on labeling of the fNDs by gold nanoparticles37 or by coating with a silica shell.38
Herein, dark-field contrast enhancement provided high image quality with greatly enhanced contrast suitable for resolving unlabeled single fNDs during their cellular uptake process and within cellular organelles for the first time. In a first demonstration experiment, the number of fNDs inside an endosomal vesicle was quantified. We envision that the technique developed herein will provide quantitative understanding of the various interactions of nanoparticles with cells and ultimately pave the way to a rational design of nanoscale markers, sensors, and reliable and reproducible nanotherapeutics.
After synthesis, fNDs strongly aggregate in aqueous buffer due to their high number of negatively charged surface groups. Therefore, uncoated fNDs could not be used as single particle probes for cellular studies, and fND surface coating is essential to stabilize them in cellular environments. Herein, fNDs with 35 nm mean-diameter have been used whose surface was oxidized under harsh conditions in oxidizing acids (Figure S1d) and their dispersibility was enhanced in Milli-Q water at low concentrations (0.1 mg/mL) by ultrasonification. We have developed previously a copolymer derived from the blood plasma protein human serum albumin (dcHSA-PEG(2000)18), termed dcHSA-PEG, containing multiple positively charged primary amino groups and grafted poly(ethylene oxide) side chains (for further details see SI, Figure S1c; the synthesis of this polymer was reported before41,42) that readily adsorbed to the surface of fNDs. Coated fNDs were purified by centrifugation (18 000×g) and separated from the unbound biopolymer. After coating with dcHSA-PEG, the surface charges changed from a negative to a positive value (Figure S1d) and their hydrodynamic radius Rh increased from 44.5 to 61.7 nm (dynamic light scattering, DLS, Figures S2 and 3). This relatively large increase of about 17 nm was also due to the loss of small fNDs during purification by ultracentrifugation. For the in vitro studies, narrowly dispersed fNDs of high colloidal stability in Dulbecco’s phosphate-buffered saline (DPBS) were required. A monomodal distribution of coated fNDs was detected in the dynamic light scattering (DLS) recorded at different angles indicating no fND aggregate formation (Figures S2 and 3). Subsequently, the fNDs dissolved in DPBS were visualized by TEM revealing well-dispersed single nanoparticles distributed over the TEM grid (Figure S1b), whereas uncoated fNDs appeared mostly aggregated in DPBS on the TEM grid (Figure S1a). The negatively charged nitrogen vacancy (NV–) centers in fNDs emit light at a wavelength of 680 nm after excitation with a 561 nm laser. Their emission intensity depends on the number, size, and shape of the fNDs. Herein, about 15 NV– on average were present statistically distributed within the fNDs and their optical properties were not affected by the biopolymer coating (Figure S1e). These coated fNDs were then used to study their cellular uptake and trafficking by confocal laser scanning microscopy (CLSM) and TEM in HeLa cells.
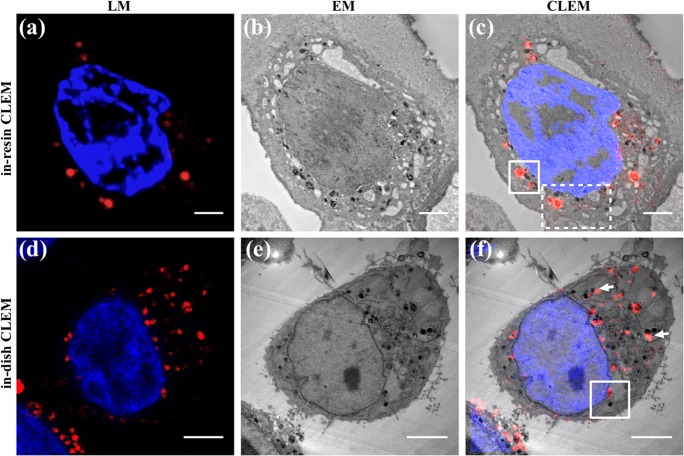
First, the coated fNDs were vitrified and embedded prior to LM and EM acquisition providing images from the same cellular location (“in-resin CLEM”). Then, fNDs were examined by LM followed by EM acquisition (“in-dish CLEM”). The correlative imaging method provided localization of fNDs in fluorescence microscopy and high-resolution EM micrographs from the same cellular region of interest (ROI). Because of their stable emission intensity, fNDs could be identified in CLSM as well as in EM despite their all-carbon composition. Figure 1a,b reveals LM and EM images from the in-resin CLEM imaging of the same section, where fND fluorescence was retained after the harsh resin and polymerization treatment. The cellular structures appeared well preserved even after staining with low amounts (0.1%) of uranyl acetate (UA). Noteworthy, our imaging procedure did not rely on osmium tetroxide (OsO4) as contrast enhancer. Compared to previously reported epoxy resins for embedding,38 the Lowicryl matrix applied herein allowed efficient nucleus staining with Hoechst dye (blue) on the section facilitating the selection of the cells of interest in LM. Figure 1c shows fNDs clusters of different sizes, whose emission was precisely colocalized with CLEM with high contrast.38,39
Figure 1.
Correlative light-electron microscopy (CLEM) of fNDs in HeLa cells showing the results of the in-resin (top) and in-dish (bottom) preparation. (a) Confocal laser scanning microscopy (CLSM) of fNDs (red) and nucleus (blue, Hoechst) on ultrathin section (120 nm nominal thickness). (b) Transmission electron microscopy (TEM) of the same section as in (a). (c) Overlay of (a,b). (d) A selected image (of LM stack) with fNDs (red) and nucleus (blue, Hoechst) of a paraformaldehyde (PFA) fixed HeLa cell. (e) Corresponding epoxy resin section of the same cell as shown in (d) and the resulting CLEM overlay (f). Scale bar: (a–c) 2 μm, (d–f) 5 μm. The white boxes denoted in (c) refer to the areas displayed in Figure 3, and the box denoted in (f) refers to the area shown in Figure 2.
The structural information (in-resin CLEM) was obtained within one thin cell slice. In addition, we performed in-dish CLEM aiming for three-dimensional (3D) tomography. Since z-stack images of the sample were recorded with CLSM first (Figure 1d), spatial information on the sample as well as the fluorescence signals of the fNDs were obtained before the EM preparation. Cellular structures such as mitochondria remained well preserved, and they could be imaged with high resolution and contrast. Pronounced vesicle membranes around the fNDs clusters were detected (Figures S4 and S5). Background fluorescence was largely suppressed for an improved colocalization and the CLSM and EM images appeared only slightly shifted (white arrows, Figure 1f), which was mainly due to small changes in the position or shape changes of the living cells before fixation.
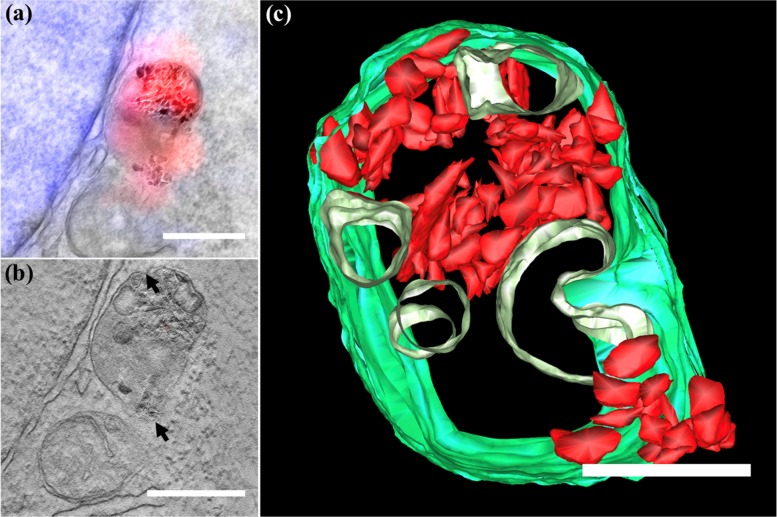
The coated fNDs showed pronounced cellular uptake due to attractive electrostatic interactions with the negatively charged cellular membrane as reported previously.41 They mainly localized in spherical clusters inside intracellular vesicles such as endosomes, lysosomes, or autophagosomes (Figure 1). EM provided the required nanoscale resolution required to precisely quantify fNDs inside these intracellular vesicles and to image their endosomal escape. Figure 2 is an enlargement of the area indicated in Figure 1f and clearly reveals a vesicle in close proximity to the cell nucleus (blue staining) and a mitochondrion located below. In total, three clusters of fNDs were found inside the vesicle: two at the top and a third smaller cluster at the bottom right close to the membrane of the vesicle. Tomography of this vesicle was performed to study the vesicle integrity. Figure 2b shows a cross section matching the LM overlay of Figure 2a. Despite the high resolution, some parts (black arrows) of the membrane appeared disrupted, especially at positions where the upper left and lower right fNDs clusters were localized. This effect appeared even more pronounced when analyzing the entire tomogram (see SI Movie 1). Obviously, fNDs induced disruption of the vesicular membrane, which likely allowed their escape from vesicles as suggested also by previous studies with labeled nanoparticles.37,43 Segmentation of the vesicle together with fNDs is shown in Figure 2c and as a result of the high-resolution TEM tomography; even single fNDs in the cluster were identified. In Figure 2c, a total number of 101 fNDs (in red) and the outer membrane of the endosome were segmented (in green) now allowing a quantification of the fNDs per cluster. The fND clusters in the endosomal vesicles were divided into three subvolumes: (1) the cluster located close to the vesicle membrane at the upper left part contained 27 fNDs in total (reconstructed in red), (2) the cluster located in the mid of the endosome was formed by 61 fNDs, whereas (3) the clusters located at the bottom right consisted of 13 fNDs. In addition, five small vesicles were identified and segmented (in light green) within the endosome.
Figure 2.
(a) CLEM micrograph constructed from the overlay of LM and TEM micrograph showing the area denoted by the box in Figure 1f. The localization of the fNDs by LM is shown in red, whereas the nucleus appears in blue. (b) Tomogram section of the same region; black arrows indicate the disappearance of the vesicle membrane. (c) The 3D model of fNDs clusters inside the endosomal vesicle; fNDs appear in red and the cellular membrane is shown in green; five vesicles are given in light green. Scale bar: (a,b) 500 nm, (c) 250 nm.
TEM micrographs did not provide sufficient contrast for the detection of single fNDs within the embedding resin as both materials mainly consist of carbon-based structures. In addition, their detection by LM was limited by low fND concentrations within the thin sections (in-resin CLEM) as well as the varying fluorescence quantum yields among individual NDs, which resulted in fNDs occasionally not emitting and therefore remaining invisible. Although previous CLEM studies demonstrated an improvement for the visualization of intracellular NDs with STED,38 the discrimination of individual ND in larger clusters still remains challenging if not impossible. In order to compare and optimize fND imaging at the nanoscale, we evaluated additional EM imaging methods summarized in Table 1 highlighting the specificity and resolution of the different techniques for detecting fNDs in clusters as well as single fNDs.
Table 1. Comparison of Different Methods to Image Single Intracellular fNDs Including a Qualitative Assessment on Their Performance.
| technique | specificity for fND clusters | specificity for single NDs | resolution | fluorescence (FL) |
|---|---|---|---|---|
| CLEM | high specificity depending on the fND emission | low specificity | high resolution (EM grade) | FL information from both fNDs and labeled organelles |
| EFTEM | high specificity depending on the fND unique energy absorption | high specificity depending on the unique energy adsorption of fNDs | high resolution (EM grade) | no FL information |
| HAADF STEM | medium specificity depending on the fND orientation | medium specificity depending on the fND orientation | high resolution (EM grade) | no FL information |
| TEM (overfocus) | medium specificity depending on the fND Fresnel contrast fringes | medium specificity depending on the fND Fresnel contrast fringes | high resolution (EM grade) | no FL information |
HAADF STEM
Dark-field imaging (DF) using a high-angular annular dark-field detector with scanning TEM (HAADF STEM, Figures S6 and 7) could in principle visualize single fNDs. However, diffraction-based identification techniques like HAADF STEM and conventional DF imaging rely on the correct orientation of the crystal with regard to the incident electron beam and therefore, only few individual nanodiamond crystals were detected, as demonstrated in Figure S7.
EFTEM
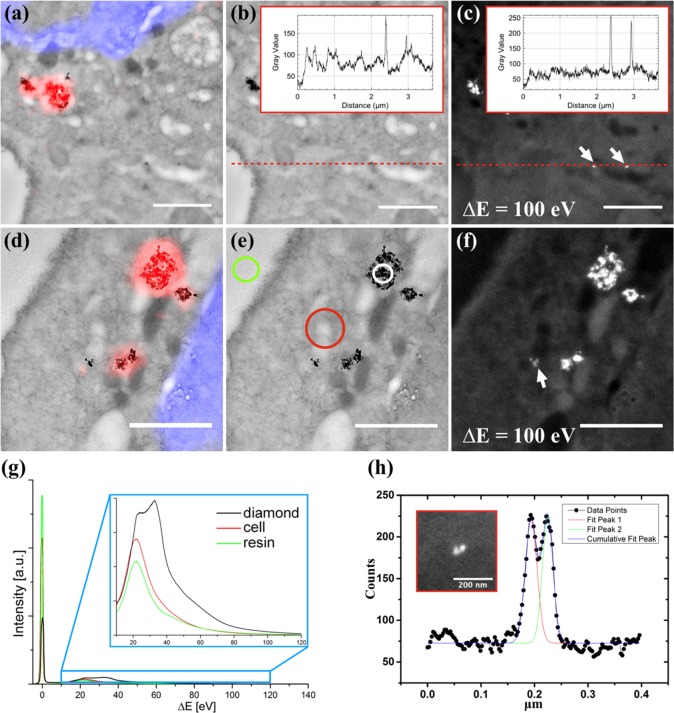
EFTEM allows the identification and localization of individual fNDs in the in-resin and in-dish preparations as this technique depends on the electron density but not on the orientations of the fNDs. EFTEM has been applied previously to image gold particles and QDs in HEp-2 cells for correlative microscopy studies44 but it has not yet been used to identify intracellular fNDs. Figure 3 shows the corresponding CLEM micrographs, TEM bright-field micrographs and EFTEM micrographs of fNDs in HeLa cells. Three fNDs clusters (Figure 3a,b) were detected in the TEM micrograph, which was confirmed by the fluorescence signal in the LM image. The EFTEM micrograph in Figure 3c reveals the presence of two single fNDs (arrows), which were barely visible in the bright field micrographs and could not be detected by fluorescence imaging. After inverting Figure 3b, we calculated the line value (red dotted line) crossing two single fNDs (Figure 3b,c). A Gaussian fit was used to calculate the signal-to-noise ratio (Figure S10 and 11) in the EFTEM image (Figure 3c), which was significantly improved (4.0 and 3.3) compared to the signal-to-noise ratio (2.3 and 1.5) of the TEM bright field image. In addition, we estimated the resolution using the line profile crossing two fNDs (Figure 3h). The distance between the two peaks was 30 nm as calculated by a Gaussian function (Figure S12) and the Gaussian fitting result highly matched the line value (R2 = 0.974). The detection limit of fluorescence imaging becomes apparent in Figure 3d,e. The cluster in the left corner of Figure 3d consists of three fNDs, whose fluorescence signal could still be resolved (the slight mismatch was due to the time gap of the in-dish preparation), whereas EFTEM (Figure 3f) clearly shows the presence of three individual fNDs. The remarkable contrast of fNDs in EFTEM imaging was attributed to the higher density of NDs compared to the surrounding resin. The mean free path λ (the average distance an electron propagates through the specimen before being scattered) was lower in diamond compared to the surrounding material and hence, the inelastic scattering intensity was increased, which was experimentally confirmed by the electron energy loss (EEL) spectra in Figure 3g. Accordingly, fNDs appeared with bright contrast when imaged with an energy loss ΔE ranging from 50 eV up to 190 eV (Figure S8). This assumption was further corroborated by the observation, that fNDs could be detected easily in bright field imaging at large overfocus (Figure S9).
Figure 3.
Single fND and fND clusters imaged by energy-filtered transmission electron microscopy (EFTEM). (a,d) CLEM overlay; (b,e) the corresponding TEM bright-field micrograph. (c,f) EFTEM micrograph acquired at an energy loss of 100 eV with 10 eV slit width. The white arrows indicate the detection of individual fNDs. The insets in (b,c) represent line profile values of respective selected line (red dots line). (g) EEL spectra of embedded fNDs (black), the embedded cell (red) and a resin-only area (green), corresponding to the positions indicated in (e) (the inset of (g) shows a zoom into the energy loss range from 10 to 120 eV). The spectra were acquired by focusing the electron beam on the respective area. (h) The line profile value of the inset (EFTEM micrograph of two closely located fNDs, Gaussian function fit of the data. (a,c) The magnification of the region marked by the dashed box in Figure 2c; (d–f)Magnification of the area marked by the solid box in Figure 2c. Scale bar: 1 μm.
TEM (Overfocus)
The bright Fresnel contrast fringes, which were formed around the individual fNDs in TEM bright-field imaging, indicated that the fNDs were phase objects attributed to their higher electron density, which also offers potential for detecting individual fNDs without the need for EFTEM or CLEM. The Fresnel fringes in the TEM micrograph appeared due to the discontinuous potential change at the edge of the fND. In overfocus conditions, this yielded a bright fringe around the object in the TEM micrograph.45 However, also other phase objects presented in the specimen could be misinterpreted as fND by this method.
Our results clearly indicate that the EFTEM approach represents the method of choice for detecting single fNDs with high contrast and great spatial resolution within cells. EFTEM even allowed an autonomous TEM screening of the entire sample and subsequent qualitative data analysis was accomplished conveniently, which offers the great potential to accelerate the precise identification and quantification of intracellular fNDs.
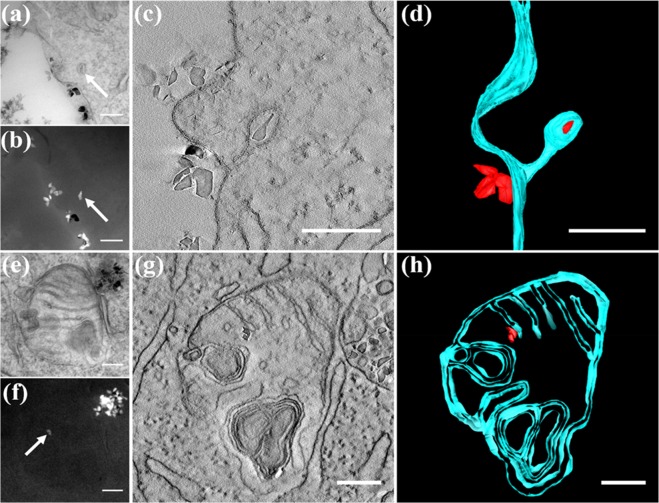
Figure 4a reveals a TEM image of fNDs close to the extracellular matrix of the cellular membrane. The presence of the single fND was clearly confirmed by EFTEM (Figure 4b), which was not detectable by CLEM and standard TEM. It seemed that several fNDs formed clusters close to the extracellular matrix, and a single fND was located already inside the cell, presumably inside an early endosomal vesicle. Electron tomography was performed on this site and Figure 4c shows a virtual slice of the tomogram (see SI Movie 2). Obviously, the formation of the early endosome was still in process, and the membrane of the endosome appeared still connected to the membrane of the cell. In order to gain deeper insights into this process, the tomogram of this site was segmented yielding a 3D model (Figure 4d) in which four fNDs were localized close to the cellular membrane (in green), and a single fND appeared inside the newly formed endosomal vesicle, highlighted in red. This 3D tomography captured for the first time the process of cellular uptake of a single fND as well as the presence of a membrane tunnel connecting the endosome with the cellular membrane.
Figure 4.
Interactions of single fNDs with cellular substructures. (a,b) Bright-field TEM and dark-field EFTEM of single fND uptake; (e,f) Bright-field TEM and dark-field EFTEM of fNDs inside a mitochondrion. (c,g) Virtual slices from the tomogram, whereas (d,h) give the segmentation of the tomograms of single fND uptake and localization inside a mitochondrion, respectively. Scale bar: 200 nm.
Inside the cell, we screened for single fNDs that were taken up into organelles, which is of great interest for sensing,22 drug delivery,46 as well as understanding nanoparticle-related toxicity.22 Single fNDs localized in cellular organelles are particularly challenging to detect. Figure 4e shows the TEM image of a cluster of fNDs in direct proximity to a mitochondrion. The fND cluster with dimensions of around 200 nm in diameter was detected in the upper right corner in close vicinity to the mitochondrion, which was probably too bulky to enter the cell organelle. EFTEM clearly showed the presence of individual fNDs inside this mitochondrion (Figure 4f). The virtual section from the tomogram (Figure 4g; see SI Movie 3) reveals two fNDs inside the mitochondrion and the segmentation (Figure 4h) of the tomogram clearly supported that the fNDs were located close to the inner membrane. Interestingly, there was no membrane formed around the fNDs suggesting that during their uptake process into the mitochondrion, the endosomal membrane surrounding the two fNDs most likely coalesced with the mitochondrial membrane. One could speculate that the two fNDs might originate from the larger fND cluster located close to the mitochondrion. However, additional studies are necessary to unravel the intracellular transport processes of nanoparticles into mitochondria.
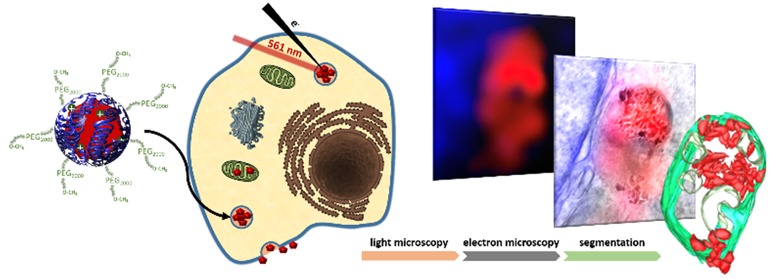
In summary, we have demonstrated a stringent procedure to image and quantify coated fNDs as clusters as well as down to the single particle level inside cells. A bioinspired protein coating was used to stabilize the fNDs inside cells, which has similarities to the natural protein corona, formed when nanoparticles are subjected to blood serum providing high colloidal stability and biocompatibility. fNDs were detected at different stages during their cellular uptake and intracellular trafficking highlighting that many cellular barriers have to be crossed inside cells (Figure 5a). fND clusters appeared outside the cellular membrane as well as in endosomal vesicles as detected by CLEM with a high contrast by colocalization of LM and EM signals (Figure 5b). EM images of fND clusters were obtained with the highest resolution reported yet, which even allowed quantification of individual fNDs in the larger fND clusters inside intracellular vesicles. Moreover, individual fNDs were detected for the first time by EFTEM. In this way, the cellular uptake process of a single fND inside a newly forming, early endosomal vesicle was imaged (Figure 5d), and the presence of single fNDs inside a mitochondrion (Figure 5c) was demonstrated. The localization and quantification of fNDs inside mitochondria is of particular interest because drug delivery into these organelles represents an emerging strategy in cancer cell treatment.46 Conventional LM studies could not unambiguously differentiate whether nanoparticles were taken up into mitochondria or if they only colocalized with their outer membranes. Applying dark-field EFTEM, we were able to resolve the presence of individual fNDs inside the mitochondrion, whereas a larger fND cluster remained outside this organelle in close vicinity to its outer membrane.
Figure 5.
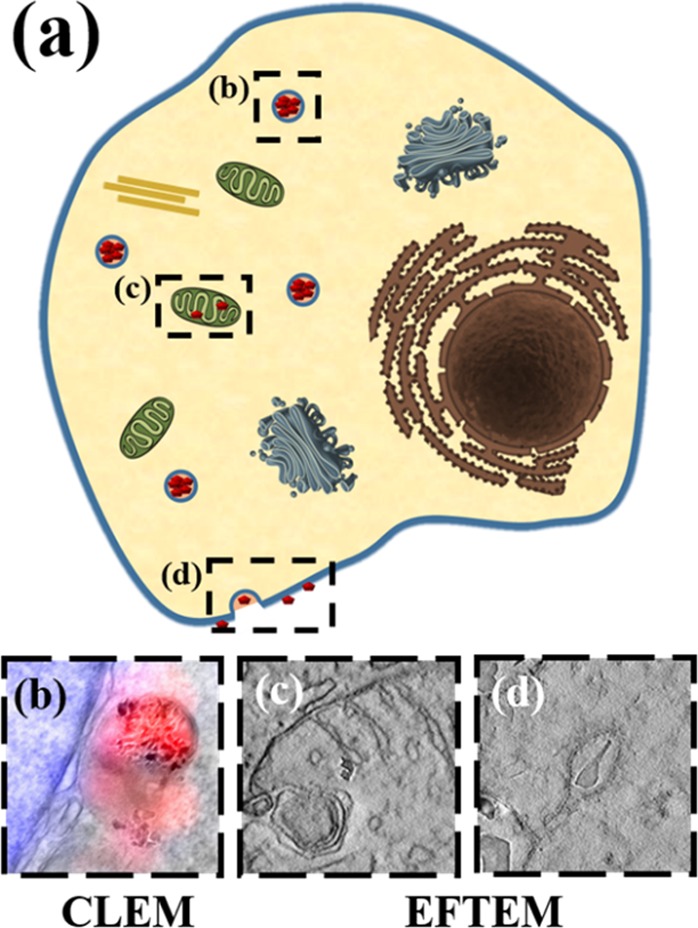
(a) Visualization of fNDs in different cellular environments. (b) Identification and quantification of fNDs in intracellular vesicles using CLEM. In addition, single fND detection was achieved by EFTEM (c) inside a mitochondrion as well as (d) in the cellular membrane during fND uptake.
We believe that our approach offers the great potential to resolve fNDs within clusters as well as single fNDs and to allow the quantification of their exact number and image their locations within the various cellular compartments. In this way, one could gain fundamental insights into intracellular transport processes of fNDs and how these pathways are interconnected, which provides great opportunities to ultimately correlate bioactivities and potential toxic effects of nanomaterials based on quantitative data. We believe that such studies will be of great relevance to obtain reliable and reproducible information on nanotherapeutics that ultimately facilitate rational design of efficient and safe drug transporter and imaging probes.
Acknowledgments
This project has been funded by the Max-Planck-Institute for Polymer Research; ERC Synergy Grant 319130-BioQ; the European Union’s Horizon 2020 project “Hyperdiamond” under the Grant Agreement 667192 as well the Deutsche Forschungsgemeinschaft (DFG, German Research Foundation) within the priority program SPP 1923 and SFB1066.
Supporting Information Available
The Supporting Information is available free of charge on the ACS Publications website at DOI: 10.1021/acs.nanolett.9b00752.
Author Contributions
S.H. and M.R. contributed equally.
The authors declare no competing financial interest.
Supplementary Material
References
- Pelaz B.; Alexiou C. H.; Alvarez -Puebla R. A.; Alves F.; Andrews A. M.; Ashraf S.; Balogh L. P.; Ballerini L.; Bestetti A.; Brendel C.; Bosi S.; Carril M.; Chan W. C. W.; Chen C. Y.; Chen X. D.; Chen X. Y.; Cheng Z.; Cui D. X.; Du J. Z.; Dullin C.; Escudero A.; Feliu N.; Gao M. Y.; George M.; Gogotsi Y.; Grunweller A.; Gu Z. W.; Halas N. J.; Hampp N.; Hartmann R. K.; Hersam M. C.; Hunziker P.; Jian J.; Jiang X. Y.; Jungebluth P.; Kadhiresan P.; Kataoka K.; Khademhosseini A.; Kopecek J.; Kotov N. A.; Krug H. F.; Lee D. S.; Lehr C. M.; Leong K. W.; Liang X. J.; Lim M. L.; Liz-Marzan L. M.; Ma X. M.; Macchiarini P.; Meng H.; Mohwald H.; Mulvaney P.; Nel A. E.; Nie S. M.; Nordlander P.; Okano T.; Oliveira J.; Park T. H.; Penner R. M.; Prato M.; Puntes V.; Rotello V. M.; Samarakoon A.; Schaak R. E.; Shen Y. Q.; Sjoqvist S.; Skirtach A. G.; Soliman M. G.; Stevens M. M.; Sung H. W.; Tang B. Z.; Tietze R.; Udugama B. N.; VanEpps J. S.; Weil T.; Weiss P. S.; Willner I.; Wu Y. Z.; Yang L. L.; Yue Z.; Zhang Q.; Zhang Q.; Zhang X. E.; Zhao Y. L.; Zhou X.; Parak W. J. ACS Nano 2017, 11, 2313–2381. 10.1021/acsnano.6b06040. [DOI] [PMC free article] [PubMed] [Google Scholar]
- Velasco-Aguirre C.; Morales F.; Gallardo-Toledo E.; Guerrero S.; Giralt E.; Araya E.; Kogan M. J. Int. J. Nanomed. 2015, 10, 4919–36. 10.2147/IJN.S82310. [DOI] [PMC free article] [PubMed] [Google Scholar]
- Mailänder V.; Landfester K. Biomacromolecules 2009, 10, 2379–400. 10.1021/bm900266r. [DOI] [PubMed] [Google Scholar]
- Baier G.; Baumann D.; Siebert J. M.; Musyanovych A.; Mailänder V.; Landfester K. Biomacromolecules 2012, 13, 2704–2715. 10.1021/bm300653v. [DOI] [PubMed] [Google Scholar]
- Ritz S.; Schottler S.; Kotman N.; Baier G.; Musyanovych A.; Kuharev J.; Landfester K.; Schild H.; Jahn O.; Tenzer S.; Mailänder V. Biomacromolecules 2015, 16, 1311–1321. 10.1021/acs.biomac.5b00108. [DOI] [PubMed] [Google Scholar]
- Kokkinopoulou M.; Simon J.; Landfester K.; Mailänder V.; Lieberwirth I. Nanoscale 2017, 9, 8858–8870. 10.1039/C7NR02977B. [DOI] [PubMed] [Google Scholar]
- Salvati A.; Pitek A. S.; Monopoli M. P.; Prapainop K.; Bombelli F. B.; Hristov D. R.; Kelly P. M.; Aberg C.; Mahon E.; Dawson K. A. Nat. Nanotechnol. 2013, 8, 137–43. 10.1038/nnano.2012.237. [DOI] [PubMed] [Google Scholar]
- Schermelleh L.; Heintzmann R.; Leonhardt H. J. J. Cell Biol. 2010, 190, 165–75. 10.1083/jcb.201002018. [DOI] [PMC free article] [PubMed] [Google Scholar]
- Vandenberg W.; Leutenegger M.; Lasser T.; Hofkens J.; Dedecker P. Cell Tissue Res. 2015, 360, 151–78. 10.1007/s00441-014-2109-0. [DOI] [PubMed] [Google Scholar]
- Sahl S. J.; Hell S. W.; Jakobs S. Nat. Rev. Mol. Cell Biol. 2017, 18, 685–701. 10.1038/nrm.2017.71. [DOI] [PubMed] [Google Scholar]
- Giepmans B. N. G.; Deerinck T. J.; Smarr B. L.; Jones Y. Z.; Ellisman M. H. Nat. Methods 2005, 2, 743–749. 10.1038/nmeth791. [DOI] [PubMed] [Google Scholar]
- Tzeng Y. K.; Faklaris O.; Chang B. M.; Kuo Y.; Hsu J. H.; Chang H. C. Angew. Chem., Int. Ed. 2011, 50, 2262–2265. 10.1002/anie.201007215. [DOI] [PubMed] [Google Scholar]
- Mari M.; Geerts W. J.; Reggiori F. Traffic 2014, 15, 1164–78. 10.1111/tra.12192. [DOI] [PubMed] [Google Scholar]
- Mateos J. M.; Barmettler G.; Doehner J.; Ojeda Naharros I.; Guhl B.; Neuhauss S. C. F.; Kaech A.; Bachmann-Gagescu R.; Ziegler U. J. Visualized Exp. 2017, 129, 56113. 10.3791/56113. [DOI] [PMC free article] [PubMed] [Google Scholar]
- Hodgson L.; Tavare J.; Verkade P. Protoplasma 2014, 251, 403–16. 10.1007/s00709-013-0597-5. [DOI] [PMC free article] [PubMed] [Google Scholar]
- van Weering J. R. T.; Brown E.; Sharp T. H.; Mantell J.; Cullen P. J.; Verkade P. Methods Cell Biol. 2010, 96, 619–648. 10.1016/S0091-679X(10)96026-3. [DOI] [PMC free article] [PubMed] [Google Scholar]
- Olmos Y.; Hodgson L.; Mantell J.; Verkade P.; Carlton J. G. Nature 2015, 522, 236–9. 10.1038/nature14503. [DOI] [PMC free article] [PubMed] [Google Scholar]
- He H.; Xie C.; Ren J. Anal. Chem. 2008, 80, 5951–7. 10.1021/ac8005796. [DOI] [PubMed] [Google Scholar]
- Bianco S.; Grigolini P.; Paradisi P. J. Chem. Phys. 2005, 123, 174704. 10.1063/1.2102903. [DOI] [PubMed] [Google Scholar]
- Derfus A. M.; Chan W. C. W.; Bhatia S. N. Nano Lett. 2004, 4, 11–18. 10.1021/nl0347334. [DOI] [PMC free article] [PubMed] [Google Scholar]
- Butterworth K. T.; Coulter J. A.; Jain S.; Forker J.; McMahon S. J.; Schettino G.; Prise K. M.; Currell F. J.; Hirst D. G. Nanotechnology 2010, 21, 295101. 10.1088/0957-4484/21/29/295101. [DOI] [PMC free article] [PubMed] [Google Scholar]
- Chipaux M.; van der Laan K. J.; Hemelaar S. R.; Hasani M.; Zheng T.; Schirhagl R. Small 2018, 14, 1704263 10.1002/smll.201704263. [DOI] [PubMed] [Google Scholar]
- Fu C. C.; Lee H. Y.; Chen K.; Lim T. S.; Wu H. Y.; Lin P. K.; Wei P. K.; Tsao P. H.; Chang H. C.; Fann W. P. Proc. Natl. Acad. Sci. U. S. A. 2007, 104, 727–732. 10.1073/pnas.0605409104. [DOI] [PMC free article] [PubMed] [Google Scholar]
- Mohan N.; Tzeng Y. K.; Yang L.; Chen Y. Y.; Hui Y. Y.; Fang C. Y.; Chang H. C. Adv. Mater. 2010, 22, 843–847. 10.1002/adma.200901596. [DOI] [PubMed] [Google Scholar]
- Prabhakar N.; Nareoja T.; von Haartman E.; Sen Karaman D.; Jiang H.; Koho S.; Dolenko T. A.; Hanninen P. E.; Vlasov D. I.; Ralchenko V. G.; Hosomi S.; Vlasov I. I.; Sahlgren C.; Rosenholm J. M. Nanoscale 2013, 5, 3713–3722. 10.1039/c3nr33926b. [DOI] [PubMed] [Google Scholar]
- Wu Y. Z.; Jelezko F.; Plenio M. B.; Weil T. Angew. Chem., Int. Ed. 2016, 55, 6586–6598. 10.1002/anie.201506556. [DOI] [PubMed] [Google Scholar]
- Hsiao W. W. W.; Hui Y. Y.; Tsai P. C.; Chang H. C. Acc. Chem. Res. 2016, 49, 400–407. 10.1021/acs.accounts.5b00484. [DOI] [PubMed] [Google Scholar]
- Arroyo-Camejo S.; Adam M. P.; Besbes M.; Hugonin J. P.; Jacques V.; Greffet J. J.; Roch J. F.; Hell S. W.; Treussart F. ACS Nano 2013, 7, 10912–10919. 10.1021/nn404421b. [DOI] [PubMed] [Google Scholar]
- Glenn D. R.; Lee K.; Park H.; Weissleder R.; Yacoby A.; Lukin M. D.; Lee H.; Walsworth R. L.; Connolly C. B. Nat. Methods 2015, 12, 736–738. 10.1038/nmeth.3449. [DOI] [PMC free article] [PubMed] [Google Scholar]
- Tsai P.-C.; Chen O. Y.; Tzeng Y.-K.; Hui Y. Y.; Guo J. Y.; Wu C.-C.; Chang M.-S.; Chang H.-C. EPJ. Quantum Technology 2015, 2, 19. 10.1140/epjqt/s40507-015-0031-3. [DOI] [Google Scholar]
- Simpson D. A.; Morrisroe E.; McCoey J. M.; Lombard A. H.; Mendis D. C.; Treussart F.; Hall L. T.; Petrou S.; Hollenberg L. C. L. ACS Nano 2017, 11, 12077–12086. 10.1021/acsnano.7b04850. [DOI] [PubMed] [Google Scholar]
- Sekiguchi T.; Sotoma S.; Harada Y. Biophysics and physicobiology 2018, 15, 229–234. 10.2142/biophysico.15.0_229. [DOI] [PMC free article] [PubMed] [Google Scholar]
- Dolde F.; Fedder H.; Doherty M. W.; Nöbauer T.; Rempp F.; Balasubramanian G.; Wolf T.; Reinhard F.; Hollenberg L. C. L.; Jelezko F.; Wrachtrup J. Nat. Phys. 2011, 7, 459. 10.1038/nphys1969. [DOI] [Google Scholar]
- Chang Y. R.; Lee H. Y.; Chen K.; Chang C. C.; Tsai D. S.; Fu C. C.; Lim T. S.; Tzeng Y. K.; Fang C. Y.; Han C. C.; Chang H. C.; Fann W. Nat. Nanotechnol. 2008, 3, 284–8. 10.1038/nnano.2008.99. [DOI] [PubMed] [Google Scholar]
- Liu W. L.; Yu F. L.; Yang J. B.; Xiang B.; Xiao P.; Wang L. Adv. Funct. Mater. 2016, 26, 365–375. 10.1002/adfm.201502883. [DOI] [Google Scholar]
- Hui Y. Y.; Hsiao W. W. W.; Haziza S.; Simonneau M.; Treussart F.; Chang H. C. Curr. Opin. Solid State Mater. Sci. 2017, 21, 35–42. 10.1016/j.cossms.2016.04.002. [DOI] [Google Scholar]
- Liu W. N.; Naydenov B.; Chakrabortty S.; Wuensch B.; Hubner K.; Ritz S.; Colfen H.; Barth H.; Koynov K.; Qi H. Y.; Leiter R.; Reuter R.; Wrachtrup J.; Boldt F.; Scheuer J.; Kaiser U.; Sison M.; Lasser T.; Tinnefeld P.; Jelezko F.; Walther P.; Wu Y. Z.; Weil T. Nano Lett. 2016, 16, 6236–6244. 10.1021/acs.nanolett.6b02456. [DOI] [PubMed] [Google Scholar]
- Prabhakar N.; Peurla M.; Koho S.; Deguchi T.; Nareoja T.; Chang H. C.; Rosenholm J. M.; Hanninen P. E. Small 2018, 14, 1701807. 10.1002/smll.201701807. [DOI] [PubMed] [Google Scholar]
- Hemelaar S. R.; de Boer P.; Chipaux M.; Zuidema W.; Hamoh T.; Martinez F. P.; Nagl A.; Hoogenboom J. P.; Giepmans B. N. G.; Schirhagl R. Sci. Rep. 2017, 7, 720. 10.1038/s41598-017-00797-2. [DOI] [PMC free article] [PubMed] [Google Scholar]
- Hsieh F. J.; Chen Y. W.; Huang Y. K.; Lee H. M.; Lin C. H.; Chang H. C. Anal. Chem. 2018, 90, 1566–1571. 10.1021/acs.analchem.7b04549. [DOI] [PubMed] [Google Scholar]
- Wu Y. Z.; Ermakova A.; Liu W. N.; Pramanik G.; Vu T. M.; Kurz A.; McGuinness L.; Naydenov B.; Hafner S.; Reuter R.; Wrachtrup J.; Isoya J.; Fortsch C.; Barth H.; Simmet T.; Jelezko F.; Weil T. Adv. Funct. Mater. 2015, 25, 6576–6585. 10.1002/adfm.201502704. [DOI] [Google Scholar]
- Zhang T.; Neumann A.; Lindlau J.; Wu Y. Z.; Prarnanik G.; Naydenov B.; Jelezko F.; Schuder F.; Huber S.; Huber M.; Stehr F.; Hogele A.; Weil T.; Liedl T. J. Am. Chem. Soc. 2015, 137, 9776–9779. 10.1021/jacs.5b04857. [DOI] [PubMed] [Google Scholar]
- Chu Z. Q.; Zhang S. L.; Zhang B. K.; Zhang C. Y.; Fang C. Y.; Rehor I.; Cigler P.; Chang H. C.; Lin G.; Liu R. B.; Li Q. Sci. Rep. 2015, 4, 4495. 10.1038/srep04495. [DOI] [PMC free article] [PubMed] [Google Scholar]
- Nisman R.; Dellaire G.; Ren Y.; Li R.; Bazett-Jones D. P. J. Histochem. Cytochem. 2004, 52, 13–18. 10.1177/002215540405200102. [DOI] [PubMed] [Google Scholar]
- Dunin-Borkowski R. E. Ultramicroscopy 2000, 83, 193–216. 10.1016/S0304-3991(00)00015-2. [DOI] [PubMed] [Google Scholar]
- Chakrabortty S.; Agrawalla B. K.; Stumper A.; Vegi N. M.; Fischer S.; Reichardt C.; Kogler M.; Dietzek B.; Feuring-Buske M.; Buske C.; Rau S.; Weil T. J. Am. Chem. Soc. 2017, 139, 2512–2519. 10.1021/jacs.6b13399. [DOI] [PMC free article] [PubMed] [Google Scholar]
Associated Data
This section collects any data citations, data availability statements, or supplementary materials included in this article.


