

Abstract
Our group has previously studied the brains of some unique individuals who are able to tolerate robust amounts of Alzheimer’s pathological lesions (amyloid plaques and neurofibrillary tangles) without experiencing dementia while alive. These rare resilient cases do not demonstrate the patterns of neuronal/synaptic loss that are normally found in the brains of typical demented Alzheimer’s patients. Moreover, they exhibit decreased astrocyte and microglial activation markers GFAP and CD68, suggesting that a suppressed neuroinflammatory response may be implicated in human brain resilience to Alzheimer’s pathology. In the present work, we used a multiplexed immunoassay to profile a panel of 27 cytokines in the brains of controls, typical demented Alzheimer’s cases, and two groups of resilient cases, which possessed pathology consistent with either high probability (HP, Braak stage V-VI and CERAD 2–3) or intermediate probability (IP, Braak state III-IV and CERAD 1–3) of Alzheimer’s disease in the absence of dementia. We used a multivariate partial least squares regression approach to study differences in cytokine expression between resilient cases and both Alzheimer’s and control cases. Our analysis identified distinct profiles of cytokines in the entorhinal cortex (one of the earliest and most severely affected brain regions in Alzheimer’s disease) that are up-regulated in both HP and IP resilient cases relative to Alzheimer’s and control cases. These cytokines, including IL-1β, IL-6, IL-13, and IL-4 in HP resilient cases and IL-6, IL-10, and IP-10 in IP resilient cases, delineate differential inflammatory activity in brains resilient to Alzheimer’s pathology compared to Alzheimer’s cases. Of note, these cytokines all have been associated with pathogen clearance and/or the resolution of inflammation. Moreover, our analysis in the superior temporal sulcus (a multimodal association cortex that consistently accumulates Alzheimer’s pathology at later stages of the disease along with overt symptoms of dementia) revealed increased expression of neurotrophic factors, such as PDGF-bb and basic FGF in resilient compared to AD cases. The same region also had reduced expression of chemokines associated with microglial recruitment, including MCP-1 in HP resilient cases and MIP-1α in IP resilient cases compared to AD. Altogether, our data suggest that different patterns of cytokine expression exist in the brains of resilient and Alzheimer’s cases, link these differences to reduced glial activation, increased neuronal survival and preserved cognition in resilient cases, and reveal specific cytokine targets that may prove relevant to the identification of novel mechanisms of brain resiliency to Alzheimer’s pathology.
Keywords: Alzheimer’s disease, resilience, neuroinflammation, partial least squares regression
INTRODUCTION
Amyloid beta (Aβ) plaques and neurofibrillary tangles (NFTs) are the classical pathological hallmarks of Alzheimer’s disease (AD) (Montine et al., 2012a). Although it is widely assumed that plaques and tangles are causally related to the cognitive symptoms of dementia in AD, observations from several studies, including our earlier work, suggest that relationships between plaques, tangles and cognition are not especially strong and may not suffice to reliably predict clinical outcome on an individual basis (Ingelsson et al., 2004). We recently studied the brains of some unique individuals who seem to have an intrinsic capacity to withstand robust amounts of AD pathological lesions without experiencing dementia (Perez-Nievas et al., 2013). These rare resilient brains harbor plaque and tangle loads that in some cases are equivalent to those found in AD cases. However, they do not demonstrate the typical patterns of neuronal/synaptic loss seen in AD, and they exhibit a significantly decreased glial response, marked by GFAP and CD68 expression (Perez-Nievas et al., 2013), suggesting that down-regulated neuroinflammation is one of the differential traits of human brain resilience to AD pathology.
The role of neuroinflammation in AD continues to be uncertain. Some components of the inflammatory response, driven by astrocytes and microglia, may be beneficial to clear plaques and tangles. However, the increased expression of inflammatory mediators in the brains of patients with AD and several epidemiological studies linking the use of anti-inflammatory drugs with a decreased risk for dementia suggest that inflammation may be a driver of the disease (Wyss-Coray, 2006). Evidence from in vitro and in vivo models suggest that neuroinflammation enhances production of oxidative species (Wilkinson and Landreth, 2006), disrupts metabolic homeostasis, and promotes microglial-mediated synaptic loss (Hong et al., 2016). In addition, activated microglia express inflammatory cytokines such as IL-1α and TNF-α, both found to be up-regulated in AD brains (Tobinick et al., 2006; Wood et al., 2015; Ye et al., 2013), which in turn may contribute to astrocyte activation, further microglial activation, and cognitive dysfunction (Gibson et al., 2004; Rao et al., 2012).
Given the direct connection between glial activation and cytokine production, and the role of certain cytokines in neuronal and synaptic loss (Gibson et al., 2004; Hu et al., 2007), we hypothesized that resilient cases would exhibit a differential pattern of cytokine expression related to suppressed neuroinflammation, increased neuronal survival, and preserved cognition when compared to AD cases. In the present study, we have extended our prior characterization of phenotypic traits linked to resilience and AD pathology to include a multivariate analysis of a panel of neuropathological measures. We then quantified 27 immunomodulatory cytokines in four groups of subjects: 1) non-demented individuals whose post-mortem examination demonstrated absence of substantial AD pathology (control group), 2) non-demented individuals whose post-mortem examination demonstrated abundant AD pathology (high probability, HP resilient group with Braak stage V-VI and CERAD 2–3), 3) non-demented individuals whose post-mortem examination demonstrated moderate amounts of AD pathology (intermediate probability, IP resilient group with Braak stage III-IV and CERAD 1–3), and 4) individuals with AD pathology and pre-mortem dementia (AD group). Groups 2 and 3 represent a set of samples that exhibit ‘resiliency’ to neurodegeneration and dementia symptoms in response to the presence of classic AD pathology (plaques and tangles). These resilient groups, HP (group 2) and IP (group 3), also had cortical thickness similar to controls, intact neurite trajectory and axonal geometry, fewer neuritic dystrophies than AD cases, preserved expression of synaptic proteins, and low glial activation markers (GFAP and CD68). Our analysis focused on the entorhinal cortex (EC), a region particularly vulnerable to AD pathology at very early stages of disease, and the multimodal association cortex lining the superior temporal sulcus (STS) (Gómez-Isla et al., 1997), a region that consistently accumulates amyloid plaques and NFTs at later stages along with overt symptoms of dementia (Gomez-Isla et al., 1996). Due to the multidimensional nature of our data, we used a partial least squares regression analysis to identify differences in the cytokine expression profile between the four groups. Our data suggest that resilient cases exhibit distinct profiles of cytokine expression in the EC and STS that distinguish them from AD and control cases.
MATERIALS AND METHODS
Brain Tissue Samples
Postmortem human brain tissue samples were collected from the Massachusetts General Hospital, Mayo Clinic, University of Pittsburgh, Columbia University and Washington University ADRC brain banks. Histological evaluation was performed on a specific set of blocked regions representative of a spectrum of neurodegenerative diseases. All blocks were stained with luxol fast blue and H&E, while selected blocks were routinely stained for Bielschowsky silver stain and Aβ, α-synuclein, ubiquitin and phospho-tau immunoreactivity. Neuropathological diagnosis was recorded, and cases with evidence of cortical Lewy bodies, brain infarcts, or other lesions differing from AD pathology were excluded. Cases were scored by Braak and Braak for neurofibrillary tangles (0-VI scale) (Braak and Braak, 1991) and CERAD scale for neuritic plaque density (0–3 scale where 0 indicates “none”, 1 “sparse”, 2 “moderate” and 3 “frequent” neuritic plaques) (Mirra et al., 1994). The cases were classified in 4 categories according to NIA Reagan Institute criteria: 1) Non-demented individuals before death whose postmortem exam demonstrated a low probability of AD (Braak and Braak I-II and CERAD 0–2) – “control group” (n=28); 2) Non-demented individuals before death but whose postmortem exam demonstrated an high probability of AD (Braak and Braak V-VI and CERAD 2–3) – “HP resilient group” (n=12); 3) Non-demented individuals before death but whose postmortem exam demonstrated an intermediate probability of AD (Braak and Braak III-IV and CERAD 1–3) – “IP resilient group” (n=21), and 4) Demented individuals before death whose portmortem exam demonstrated a high probability of AD (Braak and Braak V-VI and CERAD 2–3) – “AD group” (n=29) (Table S1). Control and resilient cases had either been clinically assessed with formal cognitive evaluation within 2 years prior to death to rule out impaired cognition or had no history of mild cognitive impairment or dementia according to their clinical records and death certificates. Similarly, AD cases had either undergone a formal cognitive assessment within 2 years of death that supported their clinical diagnosis of dementia or had a known clinical history of dementia according to their medical records.
Quantitative neuropathology
Neuropathological measures were derived from the EC and the STS. A detailed analysis of the STS quantitative neuropathological and biochemical amyloid and tau phenotypes in these brains has been reported elsewhere (Perez-Nievas et al., 2013). A detailed analysis of the EC quantitative neuropathological and biochemical phenotypes will be reported elsewhere. Morphologic phenotypes were derived by immunostaining 8-μm thick paraffin-embedded sections containing the EC and 50-mm thick formalin-fixed sections containing the STS with PHF-1 antibody to label NFTs (1:100, a kind gift of Dr. Peter Davies), 10D5 and 6F3D antibodies to label Aβ plaques (1:50, Dako, Carpinteria, CA) (Montine et al., 2012b), GFAP antibody to label activated astrocytes (1:2500, Abcam, Cambridge, MA), CD-68 antibody to label activated microglia (1:50, Dako, Carpinteria, CA) and NeuN antibody to label neurons (1:500, Abcam, Cambridge, MA and Chemicon, Billerica, MA). The sections were then analyzed using a light microscope equipped with a digital camera, linked to a computerized image analysis system running Bioquant software (R and M Biometrix, Nashville, TN). Adjacent sections were processed for Thio-S histology and examined using fluorescence microscopy. Aβ plaque deposition was quantified according to protocols previously published (Gómez-Isla et al., 1997; Irizarry et al., 1997). The fibrillar Aβ plaque burden, defined as the total percentage of EC per 8 μm-thick section or of STS per 50 µm-thick section covered by Thio-S positive deposits, was calculated by manual outlining of the plaque perimeter using ImageJ (NIH) (Serrano-Pozo et al., 2012). Tangle, neuronal and glial cell counts were performed using the optical dissector technique (Gómez-Isla et al., 1997; West and Gundersen, 1990). Cortical thickness was calculated in the regions of interest as additional measure of structural integrity.
Bio-Plex cytokine assay
Tissue samples were cut from cryopreserved brain blocks containing the regions of interest on dry ice, homogenized, and lysed using a Bio-Plex cell lysis kit (BioRad) according to manufacturer’s protocol, with the addition of one cOmplete™ mini (Roche) protease inhibitor per 5mL of buffer. Lysates were placed on an end-over-end rotator for at least 10min and centrifuged at 13.2kRPM. The supernatants were transferred to fresh tubes, and stored at −80°C. Samples were normalized to 7.5μg/25μL in Bio-Plex lysis buffer using a Pierce BCA (Thermo Scientific). 27 cytokines were quantified using the Bio-Plex human 27-plex (BioRad) according to kit protocol and read out using a MAGPIX instrument (Luminex, Austin, TX).
Sample normalization
All computational analyses were conducted in MATLAB (Mathworks, Natick, MA). While all samples were normalized to total protein using Pierce BCA, the Bio-Plex kit lacks an internal loading control. We therefore used a mathematical approach exploiting the multi-dimensionality of the Bio-Plex data for further normalization, as used previously (Wood et al., 2015). For a dataset consisting of n samples and m measurements per sample, the dataset, x, consisted of
| [1] |
where were the cytokine measurements collected from the ith sample. We then computed a sample correction coefficient that we multiplied to all of the measurements from a single sample to correct for loading error. The correction coefficient was computed to minimize the sum-squared error between each corrected cytokine measurement and the mean of that cytokine across the entire dataset,
| [2] |
where and the normalized dataset was
| [3] |
To maintain consistent weighting for each cytokine in Eq. 2, each measurement, , was normalized by prior to computing the loading correction coefficients.
Partial least squares modeling
Discriminant partial least squares regressions (D-PLSRs) were performed in MATLAB using the PLS function written by Cleiton Nunes (available on the Mathworks File Exchange). The data were normalized and z-scored before being input into the PLS script. The individual D-PLSRs were run for cytokine measures in both the EC and the STS. Cytokine measurements were used as the independent variables, and the discrete regression variable in all analyses was the classification of the subject (control, HP, IP, or AD). Latent variables (LV) in three dimensions were defined, and the two primary LVs were used in a leave-one-out sub-sampling without replacement to determine the standard deviation in the predicted marker weighting. Orthogonal rotations were applied to the sample scores and marker weightings to obtain consistent separation of each group along the LV1 and LV2 axes.
RESULTS
Multivariate analysis of neuropathological variables differentiates resilient from AD cases
We have previously reported that some rare human brain samples seem to be resilient to robust burdens of amyloid and tau pathology (Perez-Nievas et al., 2013). Detailed neuropathological and biochemical assessments of the STS in these unique brains revealed a distinct phenotype characterized by increased neuronal survival and suppressed glial responses when compared to brains from demented AD patients. In the present work, we analyzed a collection of 12 neuropathological variables of interest (including Braak NFT stage, CERAD neuritic plaque score, cortical thickness, number of neurons, total number of NFTs, number of extra-neuronal NFTs, number of intra-neuronal NFTs, total Aβ plaque burden, fibrillar Aβ plaque burden, plaque-associated oligomeric Aβ burden, number of GFAP-positive astrocytes and CD68-positive microglial cells) in the EC and STS of aged-matched controls, HP and IP resilient cases and AD cases.
The EC tissue analysis revealed loads of Aβ plaques and tangles in HP and IP resilient cases that were well matched with AD cases despite opposite clinical outcomes (i.e., non-demented vs. demented) (Fig. 1 and Fig. 2, Table S1). Comparable loads of plaques and tangles to those seen in AD cases were also present in the STS of HP resilient cases. As expected, lower burdens of plaques and tangles in the STS were present in IP resilient cases when compared to AD cases. Both in the EC and STS, numbers of GFAP+ astrocytes and CD68+ microglia were distinctly increased in AD compared to HP resilient, IP resilient, or control cases. (Figs. 2B, S3B). These data are in agreement with our prior observation of a significantly down-regulated glial response in the STS in resilient cases (Perez-Nievas et al., 2013). Accompanying this difference in activated glial cells, AD but not resilient cases showed reduced numbers of neurons and cortical thickness in both brain regions when compared to control cases (Figs. 2B, S3B).
Fig. 1. Multivariate analysis of resilient cases.
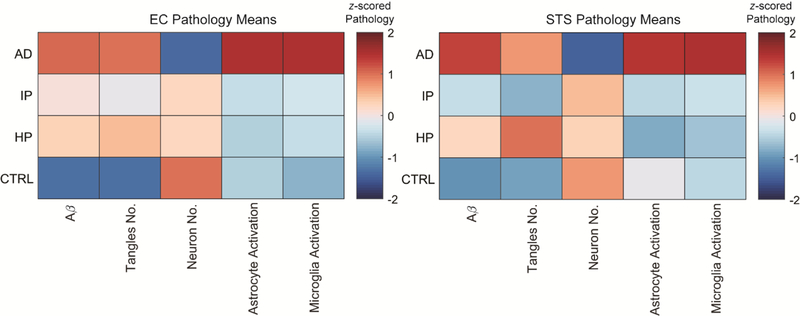
Color map indicates the mean value of each pathological measure, over each column, from the EC and STS in control, HP, IP, and AD groups. The mean values demonstrate that in contrast to AD cases, resilient cases demonstrate no neuronal loss and no astrocyte or microglial activation markers despite Aβ deposits and neurofibrillary tangles at levels that are comparable to demented AD cases in the EC.
Fig. 2. Analysis of pathological markers in the entorhinal cortex distinguishes control, AD, and Resilient cases.
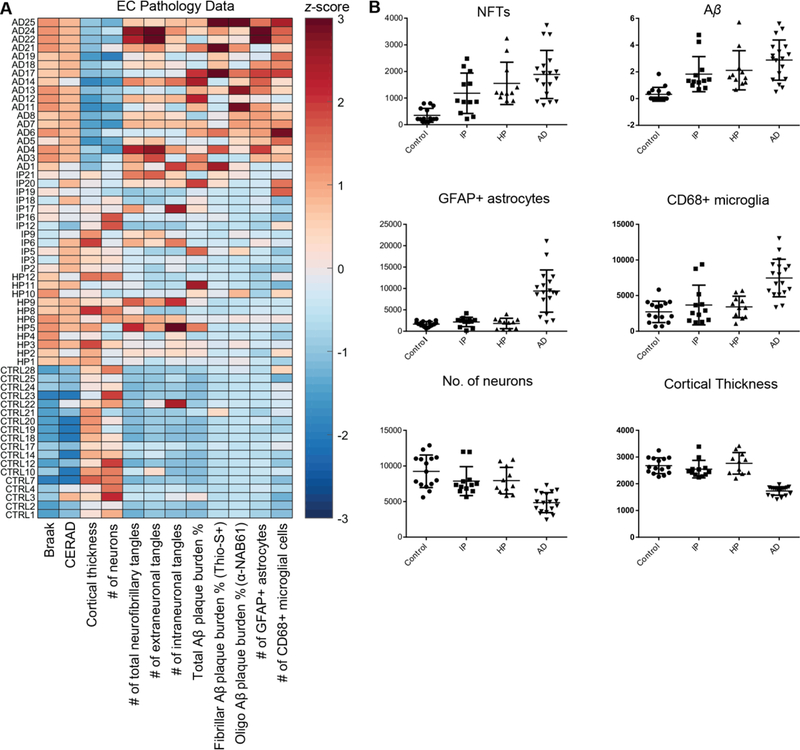
(A) z-scored data for 12 pathological markers. (B) Dot plots for six pathological markers that distinguish control, resilient, and AD cases (mean±SD).
Multivariate analysis of cytokines identifies an immunomodulatory signature that distinguishes resilient from control and AD cases
Since our glial activation measures (GFAP+ astrocytes and CD68+ microglia) pointed to reduced neuroinflammation in the EC and STS of resilient cases compared to AD (Fig. 2, Fig. S3), we next assessed a panel of multiple cytokines in each group to broadly assess differences in their respective inflammatory microenvironments. We used a multiplexed immunoassay (Bio-Rad) to quantify 27 cytokines in the same brain tissue, which we then mathematically normalized to account for panel-wide expression differences between samples (Materials and Methods, Fig. 3, n=41 for EC; Fig. S4, n=41 for STS). The majority of samples available for this analysis overlapped with those used for the analysis of neuropathological variables (Fig. S2).
Fig. 3. Multiplexed immunoassay cytokine analysis of postmortem EC tissues.
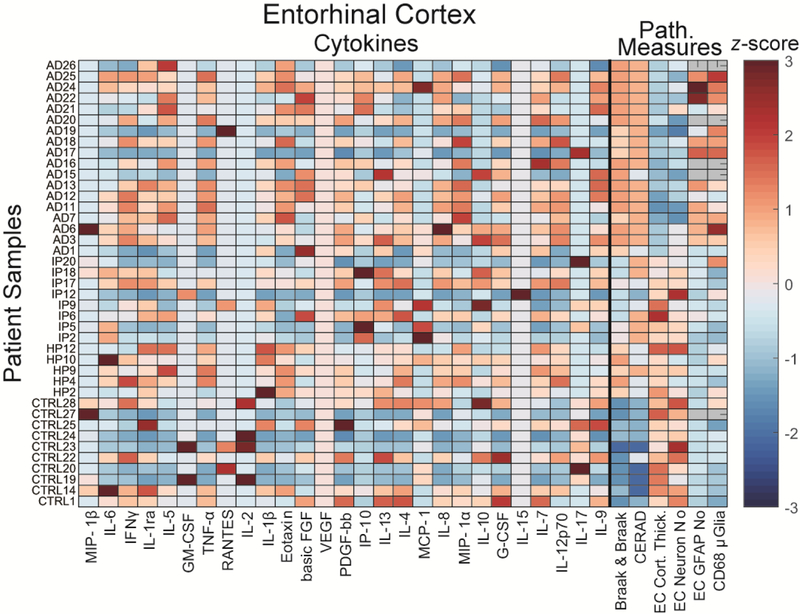
z-scored cytokine panel data plotted together with key pathological measures from postmortem EC samples. (Gray pathological measures indicate no measurement was available). Note that VEGF was not detected in any samples.
To determine if we could identify cytokine differences in this dataset that matched our prior findings (Wood et al., 2015), we first compared control and AD cases. The panel data from each region (Fig. 3, Fig. S4) suggest that cytokine expression profiles are complex and most cytokines are variable within each group. To account for the complexity of these results, we used a discriminant partial least squares regression (D-PLSR) analysis, which enables us to reduce the data from 27 measured variables to a reduced set of latent variables (LV1 and LV2) (Fig. 4A). We can then plot each data point in terms of these variables to identify differences between groups (Fig. 4B). Each LV represents a profile of cytokines that together vary between, e.g., control and AD cases. Application of D-PLSR analysis to our control and AD sample data found that LV1 distinguished control groups to the left and AD groups to the right. Moreover, LV1 consisted of a profile of cytokines that were correlated with AD cases (positive) or with control cases (negative) (Fig. 4C). Using leave-one-out cross validation (LOOCV) approach, wherein each sample was iteratively left and the D-PLSR was re-computed, we found low standard deviation in each cytokine, suggesting that the involvement of each cytokine is not dependent on any single tissue sample (Fig. 4C). LV1 supports our prior identification of an inflammatory cytokine profile differentiating AD patients from controls. Indeed the numerous cytokines identified to be up-regulated in AD here match our prior analysis, including TNF-α, IL-5, IL-8, IL-12p70, and MIP-1α (Wood et al., 2015). Down-regulated cytokines were also in agreement with our previous observations and included GM-CSF, IL-17, and IL-1β.
Fig. 4. D-PLSR analysis of EC cytokines separates control from AD cases along LV1. D-PLSR analysis of EC cytokines separates control from AD cases along LV1.
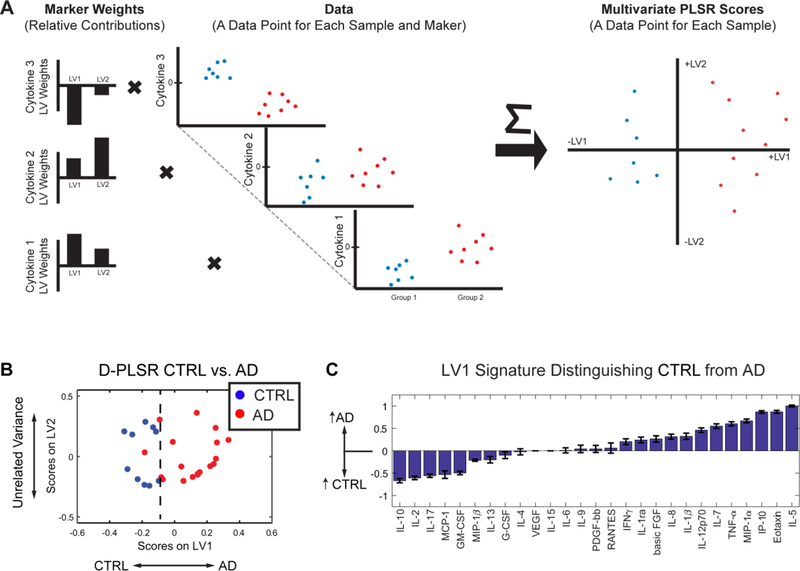
(A) Our D-PLSR analysis identifies a profile of weights for each cytokine maker that transforms the original cytokine data into a new space displayed on two axes called LV1 and LV2. The values of the sample data in the new space are called Scores, which better distinguish between groups than the original data space. (B) D-PLSR analysis separates controls to the left and AD cases to the right along LV1 (C) The new axis LV1 consisted of a profile of cytokines that correlated with either control (negative) or AD (positive) cases.
Our objective in this work was to build on the Alzheimer’s profile by identifying cytokines correlated with resilience to neurodegeneration and dementia, so we next used D-PLSR analyses to separate each resilient group (IP and HP) from AD (Fig. 5, Fig. S6). Since HP resilient cases possess loads of plaques and tangles that are comparable to AD throughout the brain, we first analyzed cytokine differences between HP (n=5 in EC, n=7 in STS) and AD (n=18 in EC, n=10 in STS) cases. The D-PLSR analysis separated HP cases to the left and AD cases to the right. Intriguingly, LV1 revealed that IL-1β, which is a classic pro-inflammatory cytokine that has been cited as an early marker of AD pathology (Griffin, 2011), was the top elevated cytokine in the EC of HP resilient cases compared to AD (Fig. 5A). However, IL-1β has also been shown to promote neuronal survival both in vitro and in vivo (Carlson et al., 1999; Diem et al., 2003) and to reduce the load of fibrillar plaque load in transgenic mice (Shaftel et al., 2007). IL-6, IL-1ra, IL-13, and, IL-4 are other top correlates in HP cases, all of which can promote resolution of inflammation (Xing et al., 1998). Additionally, IL-17, RANTES, and MIP-1β were all negative correlates of HP cases in the EC and all of which have pro-inflammatory properties (Jin and Dong, 2013).
Fig. 5. D-PLSR analysis of EC cytokines separates HP or IP resilient groups from AD cases along LV1.
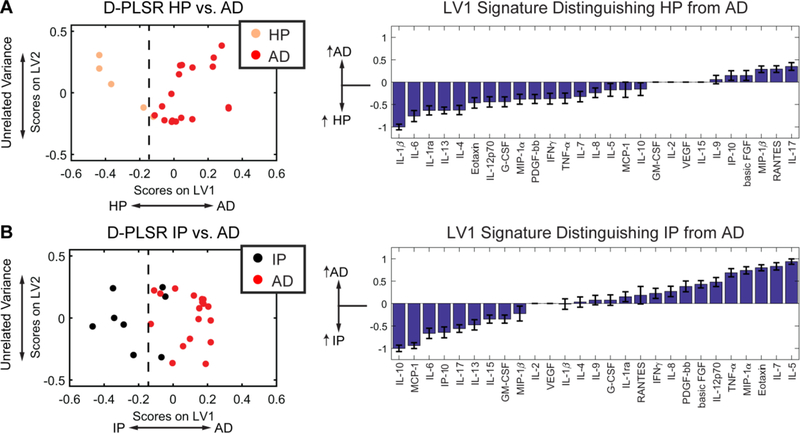
(A) D-PLSR analysis identified a cytokine profile axis, LV1, that separated HP cases to the left and AD cases to the right. The axis consisted of a profile of cytokines that were up-regulated in HP (negative) or AD cases (positive). (B) D-PLSR analysis identified a cytokine profile axis, LV1, that separated IP cases to the left and AD cases to the right. The axis consisted of a profile of cytokines that were up-regulated in IP (negative) or AD cases (positive). Errors bars on each LV1 profile were computed by PLSR model regeneration using iterative leave-one-out cross validation (mean ± SD).
Cytokine signatures associated with IP resilient cases possess similar functions to HP resilient cases
To increase the power of the HP cytokine analysis, we sought to verify the HP resilient cytokine signature against additional tissue samples from IP resilient cases (Perez-Nievas et al., 2013). Though the cytokine profile in the EC distinguishing IP resilient from AD cases did not totally overlap the HP resilient/AD comparison, there were striking similarities (Fig. 5B). Compared to AD cases, IP resilient cases had IL-10 and IL-6 as top correlates, both of which can promote resolution of inflammation (Gadient and Otten, 1997; Yamada and Hatanaka, 1994). Compared to AD cases, IP resilient cases also possessed down-regulation of numerous pro-inflammatory cytokines e.g. TNF-α, IL-5, Eotaxin, and MIP-1α (Fig. 5B). These data suggest that although the cytokine HP-AD and IP-AD differences were not identical, there are notable functional commonalities in cytokine expression profiles between IP and HP resilient cases, including elevation of cytokines that promote resolution of inflammation. Similar to the EC, our analysis of the STS separated control cases to the left from AD cases to the right, along LV1 (Fig. S5). AD cases correlated with increases in Eotaxin, IL-1ra, IL-5, MIP-1α, and TNF-α. Comparison of AD and resilient groups found HP resilient correlates that included IL-1β, PDGF-bb, IL-7, and basic FGF (Fig. S6A), and IP resilient cases correlated with basic FGF, PDGF-bb, IL-9, and IL-13 (Fig. S6A). Of these, basic FGF and PDFG-bb stand out as neurotrophic factors (Richardson, 1991).
Finally, we sought to further determine if there was a cytokine signature common to HP and IP resilient cases potentially linked to the remarkable neuronal survival and cognitive sparing in these cases despite the presence of AD pathology. To do so, we conducted a D-PLSR with all groups included (control, HP resilient, IP resilient and AD) and computationally assigned HP and IP resilient cases to the same group (Fig. S7A). This analysis separated HP and IP resilient cases along LV2, while AD cases separated from controls and resilient cases along LV1. Interestingly, while HP cases separated similarly to AD cases along LV1 (Fig. S7A-C), HP and IP resilient cases grouped together and separated from both control and AD groups. This analysis showed that the HP/IP resilient cytokine profile in the EC included many of the same immunomodulatory cytokines discussed above, e.g., IL-6, IP-10, and IL1-β. A similar analysis in the STS (Figs. S7D-F) showed up-regulation in HP/IP resilient cases of diverse cytokines (IL12p70, TNF-α, Eotaxin, IL-7, IL-5, G-CSF, MIP-1α, IL-1ra) with both pro-proliferative (Nakajima and Ihle, 2001), chemotactic (Yong, 1996) and pro-inflammatory (Bai et al., 2009) properties.
All together, our multivariate analysis of cytokine expression in HP and IP resilient cases indicates that there are marked differences in cytokine expression profiles associated with immunomodulation in resilient cases compared to both AD and control cases.
Multivariate analysis of cytokines defines cytokine profiles that separate HP and IP resilient cases from controls
Since activated astrocytes and microglia express cytokines, differences in cytokine signaling between HP/IP resilient and AD cases are likely to be a result of reduced astrocyte and microglial activation. To further examine the neuroinflammatory profile associated with the presence of AD pathology in resilient cases, we next investigated differences between HP/IP resilient and control cases. D-PLSR analysis identified Eotaxin, IL-5, MIP-1α, and IP-10 to be correlated with HP cases (Fig. 6A). Additionally, IL-10, IL-17, and MCP-1 were reduced compared to controls. A similar analysis comparing IP cases vs controls revealed that IP-10, MCP-1, and IL-6 were all up-regulated in controls, whereas there were not clear differences in other cytokines. A similar analysis in the STS revealed that HP and IP resilient cases had up-regulation of numerous pro-inflammatory factors, including IL-12p70, MIP-1α IL-1β and TNF-α, among others (Fig. S8). However, these factors were concomitant with up-regulation of some of the same immunomodulatory factors identified in the EC, including IP-10, together with the IL-1 antagonist IL-1ra. In total, these analyses reveal that HP and IP resilient cases possess cytokine signaling profiles that distinguish them not only from AD but also from control cases. Moreover, differential cytokine expression, particularly in the EC, is associated with key cytokines, including IP-10 and IL-6, which have the potential to modulate immune function and promote resolution of inflammation.
Fig. 6. D-PLSR analysis of EC cytokines separates HP or IP resilient groups from control cases along LV1.
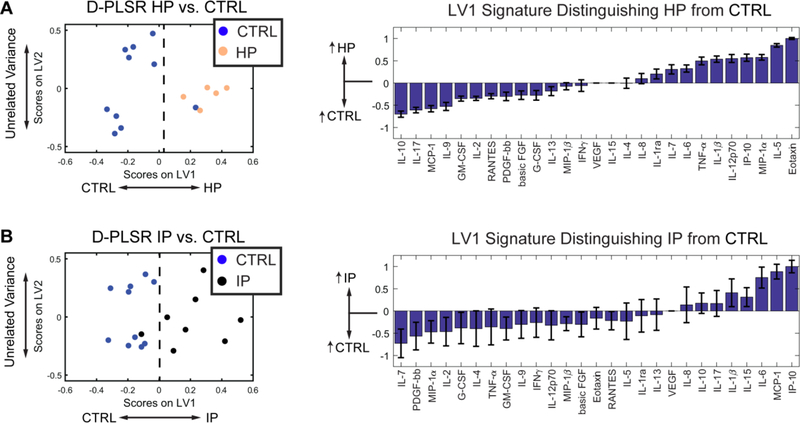
(A) D-PLSR analysis identified a cytokine profile axis, LV1, that separated control cases to the left and HP cases to the right. The axis consisted of a profile of cytokines that were up-regulated in control (negative) or HP cases (positive). (B) D-PLSR analysis identified a cytokine profile axis, LV1, that separated control cases to the left and IP cases to the right. The axis consisted of a profile of cytokines that were up-regulated in control (negative) or IP cases (positive). Errors bars on each LV1 profile were computed by PLSR model regeneration using LOOCV (mean ± SD).
DISCUSSION
Our prior finding of a suppressed glial reaction in resilient brains compared to AD, despite equivalent amounts of amyloid and tau deposits (Perez-Nievas et al., 2013), suggested that resilient cases may exhibit unique immune responses to Alzheimer’s pathology. Since increased inflammatory cytokine expression is a key product and driver of glial response, we hypothesized that resilient cases would possess substantial differences in cytokine expression potentially linked to the lack of neurodegeneration and dementia of these unique cases. To test our hypothesis, we analyzed a broad panel of cytokines in the EC and STS - two regions that consistently undergo amyloid deposition, neurofibrillary tangle formation and synaptic/neuronal loss in AD – in control, resilient, and AD cases. Our prior analysis of cytokine expression patterns in AD cases at different stages of severity (Wood et al., 2015) predicted that broad differences would exist between those three groups. Thus, we took an approach to identify linear combinations of cytokines (i.e., profiles) that differed between groups.
An important finding derived from our D-PLSR analysis was the identification of cytokine profiles that separated HP and IP resilient cases from both AD and control cases (Figs. 5, S6). These novel data add to prior reports on the variable nature of cytokine expression in the presence of AD pathology (Zheng et al., 2016) and emphasize the complexity of cytokine actions and interactions in healthy and diseased brains.
Due to the different burdens of plaques and tangles in the two resilient groups included in this study (high in HP resilient cases and moderate in IP resilient cases), we first separately analyzed pathology and cytokine expression in those two groups. Compared to AD cases, our analysis identified differing profiles associated with either HP or IP resilient cases (Fig. 5) in the EC. However, there was substantial overlap in the functions of the cytokine profiles associated with HP and IP resilient groups. In particular, HP resilient cases had IL-6, IL-1ra, IL-13, and IL-4 as four of the top five correlates, which all have anti-inflammatory properties, e.g. IL-13 and IL-4 can promote microglia to shift into an anti-inflammatory “alternatively activated” state (Gadani et al., 2012). In contrast, IL-10, IL-6, and IP-10 were three of the top correlates in IP resilient cases. Though these cytokines represent a distinct profile compared with HP cases, IL-10 is also known to promote microglial alternative activation (Gadani et al., 2012). Interestingly, IP-10 (interferon gamma-induced protein 10) is a pro-inflammatory cytokine that has been reported to transiently increase in the CSF of patients with mild cognitive impairment (MCI), dropping after conversion from MCI to AD dementia (Craig-Schapiro et al., 2011; Galimberti et al., 2006). Moreover, among other functions, IP-10 is a strong modulator of angiogenesis (Bodnar et al., 2006). Therefore, even though the cytokine profiles associated with HP and IP resilient cases are distinct in identity, there is a clear overlap in their immunomodulatory functions.
Importantly, IL-6 emerged as a strong correlate in both HP and IP cases (Fig. 5). IL-6 is a highly versatile cytokine, expressed in glial and neuronal cells (Atreya et al., 2000; Ishihara and Hirano, 2002; Yasukawa et al., 2003), with both beneficial and destructive potential. Of note, several studies have linked this cytokine to AD pathological lesions. IL-6 enhances amyloid precursor protein (APP) expression and has been found elevated around amyloid plaques in AD brains (Ringheim et al., 1998). In addition, IL-6 induces phosphorylation of tau protein, thus being also a potential contributor to tangle formation in AD (Quintanilla et al., 2004). Moreover, increased plasma levels of IL-6 have been found to be negatively associated with cognitive performance in some population-based studies (Weaver et al., 2002; Wright et al., 2006), although studies looking at IL-6 in cerebrospinal fluid of AD patients have produced conflicting results (Engelborghs et al., 1999; Jia et al., 2005; Martinez et al., 2000; Marz et al., 1997; Yamada et al., 1995). Of note, it has been recognized that, although mostly regarded as a pro-inflammatory cytokine, IL-6 also has anti-inflammatory and regenerative activities that potentially account, at least in part, for the down-regulated glial activation and the increased neuronal survival observed in the resilient cases in this series. The role of IL-6 in the modulation of microglial/macrophage polarization has been recently reconsidered as some studies have shown that IL-6-expressing macrophages protect from neuroinflammation in vivo (Casella et al., 2016). Many studies have underlined the ability of circulating macrophages to infiltrate the brain and clear Aβ micro-aggregates, reviewed in (Thériault et al., 2015), even though the exact functions of this key component of the innate immune system in AD remains unclear. Interestingly, IL-6 induces MCP-1 expression (Hurst et al., 2001), which is up-regulated in our EC IP resilient samples (Fig. 5), and promotes macrophage recruitment (Engelhardt et al., 1998). IL-6 has also been found to inhibit glial production of detrimental cytokines such as TNF-α (Benveniste et al., 1995). This is consistent with our finding of a down-regulated expression of TNF-α in the EC of resilient cases compared to AD (Fig. 5B) and suggests that IL-6 anti-inflammatory signaling may prevail in the CNS of resilient cases. Importantly, several studies have demonstrated that IL-6 bound to its soluble receptor, sIL-6R, promotes neurogenesis and neurite regeneration in neuronal and hippocampal slice cultures (Islam et al., 2009; Thier et al., 1999), and protects against neuronal loss in vivo (Chucair-Elliott et al., 2014). In agreement with those observations, IL-6 knockout mice show a significantly lower progenitor cell survival in the dentate gyrus and subventricular zone compared with their wild-type littermates (Bowen et al., 2011).
Interestingly, IL-1β was the top correlate in the EC HP resilient cases in comparison to AD cases along LV1 (Fig. 5). Of note, IL-1β is overexpressed in microglia associated with amyloid plaques at early stages of plaque formation, waxing and waning through their evolution, reviewed in (Akiyama et al., 2000). IL-1β promotes the synthesis and processing of amyloid precursor protein (Buxbaum et al., 1992; Goldgaber et al., 1989) and may thus promote further Aβ production and deposition in plaques. But of note, IL-1β also has trophic actions like the induction of S100β, a neurite growth-promoting cytokine, by astrocytes (Kligman and Marshak, 1985; Sheng et al., 1996) and has been shown to promote neuronal survival both in vitro and in vivo (Carlson et al., 1999; Diem et al., 2003), and to decrease the fibrillar plaque load in vivo (Shaftel et al., 2007). Moreover, IL-1β is also known to induce IL-6 expression by astrocytes and neurons (Ershler and Keller, 2000; Gadient and Otten, 1997; Sebire et al., 1993). Altogether, the cytokine expression panel in the EC of HP resilient cases points to an immunomodulatory axis that is distinct from AD cases, despite equivalent robust loads of plaques and tangles in both groups, and that may possess neuroprotective properties.
Our analysis of HP and IP resilient cases in the STS identified additional cytokine expression profiles that suggested an overlapping function between these two groups. First, PDGF-bb and basic FGF were strong correlates in both HP and IP resilient cases (Fig. S6), both of which are neurotrophic. Indeed, basic FGF promotes neurogenesis while PDGF-bb promotes neurite outgrowth (Cheng et al., 2002) and neuronal survival (Smits et al., 1991). PDGF is highly expressed by CNS neurons, so neuronal loss in AD (Figs. 1 and 2) may be responsible for reduced PDGF expression (Sasahara et al., 1991). FGF expression by neural progenitor cells is essential for their proliferative capacity in brain repair (Dayer et al., 2007), so a decline in either progenitor number, due to a chronic need to replace lost neurons, or a decline in progenitor expression, may lead to reduced FGF in AD samples compared to resilient and control cases.
Prior work has shown that neurogenesis, associated with growth factors like FGF, in the AD hippocampus is increased over controls (Jin et al., 2004), but that addition of FGF increases neurogenesis in the aged hippocampus by promoting neuronal progenitor cell proliferation (Jin et al., 2003). Our data support that both bFGF and PDGF-bb are increased in AD cases over controls in the STS (Fig. S5). But the further increase in their expression in HP and IP cases (Fig. S6) shows an enhanced ability to promote neurogenesis, demonstrating neuroprotection in the resilient cases.
Further, AD is impacted by insufficient vascular density due to vasoconstriction and vessel regression (Carmeliet, 2003). PDGF-bb and bFGF can stabilize nascent vessels and promote new vessel growth, whereas insufficient levels can lead to vessel regression (Carmeliet, 2003). Interestingly, PDGF-bb also promotes amyloid precursor protein processing via the gamma secretase pathway (Gianni et al., 2003), suggesting a dual mechanism of PDGF-bb that may favor Aβ production while simultaneously promoting neuronal survival. However, Aβ accumulation also increases IL-1 and bFGF expression by microglia and astrocytes (Araujo and Cotman, 1992), possibly in a concerted effort toward clearance. Our data further support this response, since IL-1β is also increased in HP and IP over AD cases (Fig. S6).
IL-7 and IL-9 were the third STS correlates in the HP and IP resilient cases, respectively. IL-9 has been shown to inhibit neuronal apoptosis via the Jak/STAT pathway (Fontaine et al., 2008) while IL-7 is has been shown to be neurotrophic, and can promote neural progenitor cell differentiation into astrocytes and microglia (Araujo and Cotman, 1993). MCP-1 and MIP-1α levels are decreased in HP and IP cases, respectively, both of which are implicated in the neuroinflammation and pathogenesis of Alzheimer’s disease (Ishizuka et al., 1997; Xia et al., 1998). Together, these STS data build on our analysis in the EC suggesting that the neuroinflammatory microenvironment distinguishes AD from HP and IP resilient cases.
The present study does have limitations. First, the correlative nature of our study does not allow us to establish causal relationships between cytokines and pathological outcomes. Additionally, the number of cases studied here is limited, due in part to the fact that brains from individuals with abundant AD pathology at autopsy but no dementia are certainly infrequent; however, the careful characterization of these unique brains may hold important clues for the design of neuroprotective and cognitive-sparing therapies. Given the distinction in profiles between resilient and AD cases, the results of the present study suggest the potential for using top correlates in these cytokine profiles as CSF biomarkers to delineate these cases. However we note that many of the cytokines identified in the present study are not unique to Alzheimer’s disease or AD resiliency (e.g., TNF-α, IL-1, and IL-6 are involved in stroke, ischemia, and neurotrauma (del Zoppo et al., 2000; Leker and Shohami, 2002; Rothwell et al., 1997), so their use as biomarkers could potentially complement a larger array of diagnostic tools.
In summary, our multivariate analyses of pathology and cytokine expression in this series of carefully characterized control, resilient and AD cases provide new insights into the differences in their respective inflammatory microenvironments. Our data point to the existence of a distinct axis of cytokine function in the EC of resilient cases, including up-regulation of immunomodulatory cytokines such as IL-6, IL-13, and IL-10 in resilient cases that may suggest an inflammation-resolving microenvironment. Moreover, the HP and IP STS cases possess increased expression of several neurotrophic factors, including basic FGF and PDGF-bb in resilient cases, suggesting a possible mechanism of neuronal preservation. An important additional investigation might be the consideration of these inflammatory reporters as potential biomarkers in the setting of positive findings from other pre-symptomatic AD markers; for example, if the CSF pTau/Aβ−42 ratio is elevated but the IL-6 level is also high, then the rate of conversion to MCI might be lower than if IL-6 is not elevated. Altogether, our findings emphasize the complex interplay that takes place between inflammatory signaling, glial activation, and neuroprotective mechanisms in the human brain in the presence of amyloid plaques and neurofibrillary tangles. Understanding this complexity requires a shift in focus from single cytokines to a network of cytokine interactions that may promote a “protective” signaling program in resilient brains capable of maintaining homeostatic regulation of neuroinflammation and neuronal survival despite the presence of robust loads of plaques and tangles. Future studies will be essential in determining causal relationships between resilient cytokine brain profiles and potential neuroprotective and anti-inflammatory benefits in the context of AD pathology.
Supplementary Material
ACKNOWLEDMENTS
We acknowledge the Massachusetts General Hospital, University of Pittsburgh, Mayo Clinic, Columbia University, and Washington University ADRCs, and WHICAP study participants and the research and support staff for their contributions to this study.
FUNDING
This study was funded in part by the National Institutes of Health through grants numbers U01AG016976 and R01AG043511 (T.G.I.), P50 AG005134, P01 AG03991, P50 AG05681, P01 AG026276, UF1 AG032438 (J.C.M.), P50 AG005133 (University of Pittsburg ADRC), P01 AG025204 (W.E.K.), P50 AG016574 (Mayo Clinic ADRC), U01 AG006786 (Mayo Clinic Study of Aging), the Cure Alzheimer’s Fund, and by startup funds from the George W. Woodruff School of Mechanical Engineering at the Georgia Institute of Technology (L.B.W). L.D.W. was supported in part by the Cell and Tissue Engineering NIH Biotechnology Training Grant (T32-GM008433). Sample and data collection and sharing for this project was supported in part by the Washington Heights-Inwood Columbia Aging Project (WHICAP, P01AG07232, R01AG037212, RF1AG054023), by the National Institute on Aging (NIA) and by the National Center for Advancing Translational Sciences, National Institutes of Health, through Grant Number UL1TR001873. This manuscript has been reviewed by WHICAP investigators for scientific content and consistency of data interpretation with previous WHICAP Study publications.
Footnotes
Declarations of interest: Dr. Gomez-Isla has participated as speaker in an Eli Lilly sponsored educational symposium and serves as member of an Eli Lilly Data Monitoring Committee (DMC). Dr. Lowe consults for Bayer Schering Pharma, Piramal Life Sciences and Merck Research and receives research support from GE Healthcare, Siemens Molecular Imaging, AVID Radiopharmaceuticals and the NIH (NIA, NCI). Dr. Morris has participated in Eli Lilly and Biogen sponsored trials.
References
- Akiyama H, et al. , 2000. Inflammation and Alzheimer’s disease. Neurobiol Aging 21, 383–421. [DOI] [PMC free article] [PubMed] [Google Scholar]
- Araujo DM, Cotman CW, 1992. Beta-amyloid stimulates glial cells in vitro to produce growth factors that accumulate in senile plaques in Alzheimer’s disease. Brain Res 569, 141–5. [DOI] [PubMed] [Google Scholar]
- Araujo DM, Cotman CW, 1993. Trophic effects of interleukin-4, −7 and −8 on hippocampal neuronal cultures: potential involvement of glial-derived factors. Brain Res 600, 49–55. [DOI] [PubMed] [Google Scholar]
- Atreya R, et al. , 2000. Blockade of interleukin 6 trans signaling suppresses T-cell resistance against apoptosis in chronic intestinal inflammation: evidence in crohn disease and experimental colitis in vivo. Nat Med 6, 583–8. [DOI] [PubMed] [Google Scholar]
- Bai L, et al. , 2009. Human bone marrow-derived mesenchymal stem cells induce Th2-polarized immune response and promote endogenous repair in animal models of multiple sclerosis. Glia 57, 1192–203. [DOI] [PMC free article] [PubMed] [Google Scholar]
- Benveniste EN, et al. , 1995. Differential regulation of astrocyte TNF-alpha expression by the cytokines TGF-beta, IL-6 and IL-10. Int J Dev Neurosci 13, 341–9. [DOI] [PubMed] [Google Scholar]
- Bodnar RJ, et al. , 2006. IP-10 blocks vascular endothelial growth factor-induced endothelial cell motility and tube formation via inhibition of calpain. Circ Res 98, 617–25. [DOI] [PMC free article] [PubMed] [Google Scholar]
- Bowen KK, et al. , 2011. Adult interleukin-6 knockout mice show compromised neurogenesis. Neuroreport 22, 126–30. [DOI] [PubMed] [Google Scholar]
- Braak H, Braak E, 1991. Neuropathological stageing of Alzheimer-related changes. Acta. Neuropathol 82, 239–59. [DOI] [PubMed] [Google Scholar]
- Buxbaum JD, et al. , 1992. Cholinergic agonists and interleukin 1 regulate processing and secretion of the Alzheimer beta/A4 amyloid protein precursor. Proc Natl Acad Sci U S A 89, 10075–8. [DOI] [PMC free article] [PubMed] [Google Scholar]
- Carlson NG, et al. , 1999. Inflammatory cytokines IL-1 alpha, IL-1 beta, IL-6, and TNF-alpha impart neuroprotection to an excitotoxin through distinct pathways. J Immunol 163, 3963–8. [PubMed] [Google Scholar]
- Carmeliet P, 2003. Angiogenesis in health and disease. Nat Med 9, 653–60. [DOI] [PubMed] [Google Scholar]
- Casella G, et al. , 2016. IL4 induces IL6-producing M2 macrophages associated to inhibition of neuroinflammation in vitro and in vivo. J Neuroinflammation 13, 139. [DOI] [PMC free article] [PubMed] [Google Scholar]
- Cheng Y, et al. , 2002. Hippocampal granule neuron production and population size are regulated by levels of bFGF. Eur J Neurosci 15, 3–12. [DOI] [PubMed] [Google Scholar]
- Chucair-Elliott AJ, et al. , 2014. Microglia-induced IL-6 protects against neuronal loss following HSV-1 infection of neural progenitor cells. Glia 62, 1418–34. [DOI] [PMC free article] [PubMed] [Google Scholar]
- Craig-Schapiro R, et al. , 2011. Multiplexed immunoassay panel identifies novel CSF biomarkers for Alzheimer’s disease diagnosis and prognosis. PLoS One 6, e18850. [DOI] [PMC free article] [PubMed] [Google Scholar]
- Dayer AG, et al. , 2007. Expression of FGF-2 in neural progenitor cells enhances their potential for cellular brain repair in the rodent cortex. Brain 130, 2962–76. [DOI] [PubMed] [Google Scholar]
- del Zoppo G, et al. , 2000. Inflammation and stroke: putative role for cytokines, adhesion molecules and iNOS in brain response to ischemia. Brain Pathol 10, 95–112. [DOI] [PMC free article] [PubMed] [Google Scholar]
- Diem R, et al. , 2003. Interleukin-1 beta protects neurons via the interleukin-1 (IL-1) receptor-mediated Akt pathway and by IL-1 receptor-independent decrease of transmembrane currents in vivo. Mol Cell Neurosci 22, 487–500. [DOI] [PubMed] [Google Scholar]
- Engelborghs S, et al. , 1999. Unchanged levels of interleukins, neopterin, interferon-gamma and tumor necrosis factor-alpha in cerebrospinal fluid of patients with dementia of the Alzheimer type. Neurochem Int 34, 523–30. [DOI] [PubMed] [Google Scholar]
- Engelhardt E, et al. , 1998. Chemokines IL-8, GROalpha, MCP-1, IP-10, and Mig are sequentially and differentially expressed during phase-specific infiltration of leukocyte subsets in human wound healing. Am J Pathol 153, 1849–60. [DOI] [PMC free article] [PubMed] [Google Scholar]
- Ershler WB, Keller ET, 2000. Age-associated increased interleukin-6 gene expression, late-life diseases, and frailty. Annu Rev Med 51, 245–70. [DOI] [PubMed] [Google Scholar]
- Fontaine RH, et al. , 2008. IL-9/IL-9 receptor signaling selectively protects cortical neurons against developmental apoptosis. Cell Death Differ 15, 1542–52. [DOI] [PubMed] [Google Scholar]
- Gadani SP, et al. , 2012. IL-4 in the brain: a cytokine to remember. J Immunol 189, 4213–9. [DOI] [PMC free article] [PubMed] [Google Scholar]
- Gadient RA, Otten UH, 1997. Interleukin-6 (IL-6)--a molecule with both beneficial and destructive potentials. Prog Neurobiol 52, 379–90. [DOI] [PubMed] [Google Scholar]
- Galimberti D, et al. , 2006. Intrathecal chemokine synthesis in mild cognitive impairment and Alzheimer disease. Arch Neurol 63, 538–43. [DOI] [PubMed] [Google Scholar]
- Gianni D, et al. , 2003. Platelet-derived growth factor induces the beta-gamma-secretase-mediated cleavage of Alzheimer’s amyloid precursor protein through a Src-Rac-dependent pathway. J Biol Chem 278, 9290–7. [DOI] [PubMed] [Google Scholar]
- Gibson RM, et al. , 2004. CNS injury: the role of the cytokine IL-1. Vet J 168, 230–7. [DOI] [PubMed] [Google Scholar]
- Goldgaber D, et al. , 1989. Interleukin 1 regulates synthesis of amyloid beta-protein precursor mRNA in human endothelial cells. Proc Natl Acad Sci U S A 86, 7606–10. [DOI] [PMC free article] [PubMed] [Google Scholar]
- Gómez-Isla T, et al. , 1997. Neuronal loss correlates with but exceeds neurofibrillary tangles in Alzheimer’s disease. Annals of Neurology 41, 17–24. [DOI] [PubMed] [Google Scholar]
- Gomez-Isla T, et al. , 1996. Profound loss of layer II entorhinal cortex neurons occurs in very mild Alzheimer’s disease. J Neurosci 16, 4491–500. [DOI] [PMC free article] [PubMed] [Google Scholar]
- Griffin WS, 2011. Alzheimer’s - Looking beyond plaques. F1000 Med. Rep 3, 24. [DOI] [PMC free article] [PubMed] [Google Scholar]
- Hong S, et al. , 2016. Complement and microglia mediate early synapse loss in Alzheimer mouse models. Science [DOI] [PMC free article] [PubMed]
- Hu W, et al. , 2007. Development of a novel therapeutic suppressor of brain proinflammatory cytokine up-regulation that attenuates synaptic dysfunction and behavioral deficits. Bioorg Med Chem Lett 17, 414–8. [DOI] [PMC free article] [PubMed] [Google Scholar]
- Hurst SM, et al. , 2001. Il-6 and its soluble receptor orchestrate a temporal switch in the pattern of leukocyte recruitment seen during acute inflammation. Immunity 14, 705–14. [DOI] [PubMed] [Google Scholar]
- Ingelsson M, et al. , 2004. Early Abeta accumulation and progressive synaptic loss, gliosis, and tangle formation in AD brain. Neurology 62, 925–31. [DOI] [PubMed] [Google Scholar]
- Irizarry MC, et al. , 1997. APPSw transgenic mice develop age-related A beta deposits and neuropil abnormalities, but no neuronal loss in CA1. J Neuropathol Exp Neurol 56, 965–73. [DOI] [PubMed] [Google Scholar]
- Ishihara K, Hirano T, 2002. IL-6 in autoimmune disease and chronic inflammatory proliferative disease. Cytokine Growth Factor Rev 13, 357–68. [DOI] [PubMed] [Google Scholar]
- Ishizuka K, et al. , 1997. Identification of monocyte chemoattractant protein-1 in senile plaques and reactive microglia of Alzheimer’s disease. Psychiatry Clin Neurosci 51, 135–8. [DOI] [PubMed] [Google Scholar]
- Islam O, et al. , 2009. Interleukin-6 and neural stem cells: more than gliogenesis. Mol Biol Cell 20, 188–99. [DOI] [PMC free article] [PubMed] [Google Scholar]
- Jia JP, et al. , 2005. Cerebrospinal fluid tau, Abeta1–42 and inflammatory cytokines in patients with Alzheimer’s disease and vascular dementia. Neurosci Lett 383, 12–6. [DOI] [PubMed] [Google Scholar]
- Jin K, et al. , 2004. Increased hippocampal neurogenesis in Alzheimer’s disease. Proc Natl Acad Sci U S A 101, 343–7. [DOI] [PMC free article] [PubMed] [Google Scholar]
- Jin K, et al. , 2003. Neurogenesis and aging: FGF-2 and HB-EGF restore neurogenesis in hippocampus and subventricular zone of aged mice. Aging Cell 2, 175–83. [DOI] [PubMed] [Google Scholar]
- Jin W, Dong C, 2013. IL-17 cytokines in immunity and inflammation. Emerg Microbes Infect 2, e60. [DOI] [PMC free article] [PubMed] [Google Scholar]
- Kligman D, Marshak DR, 1985. Purification and characterization of a neurite extension factor from bovine brain. Proc Natl Acad Sci U S A 82, 7136–9. [DOI] [PMC free article] [PubMed] [Google Scholar]
- Leker RR, Shohami E, 2002. Cerebral ischemia and trauma-different etiologies yet similar mechanisms: neuroprotective opportunities. Brain Res Brain Res Rev 39, 55–73. [DOI] [PubMed] [Google Scholar]
- Martinez M, et al. , 2000. Increased cerebrospinal fluid fas (Apo-1) levels in Alzheimer’s disease. Relationship with IL-6 concentrations. Brain Res 869, 216–9. [DOI] [PubMed] [Google Scholar]
- Marz P, et al. , 1997. Interleukin-6 (IL-6) and soluble forms of IL-6 receptors are not altered in cerebrospinal fluid of Alzheimer’s disease patients. Neurosci Lett 239, 29–32. [DOI] [PubMed] [Google Scholar]
- Mirra S, et al. , 1994. CERAD guide to the neuropathological assessment of Alzheimer’s disease and other dementias Durham, NC: CERAD. [Google Scholar]
- Montine TJ, et al. , 2012a. National Institute on Aging-Alzheimer’s Association guidelines for the neuropathologic assessment of Alzheimer’s disease: a practical approach. Acta. Neuropathol 123, 1–11. [DOI] [PMC free article] [PubMed] [Google Scholar]
- Montine TJ, et al. , 2012b. National Institute on Aging-Alzheimer’s Association guidelines for the neuropathologic assessment of Alzheimer’s disease: a practical approach. Acta Neuropathol 123, 1–11. [DOI] [PMC free article] [PubMed] [Google Scholar]
- Nakajima H, Ihle JN, 2001. Granulocyte colony-stimulating factor regulates myeloid differentiation through CCAAT/enhancer-binding protein epsilon. Blood 98, 897–905. [DOI] [PubMed] [Google Scholar]
- Perez-Nievas BG, et al. , 2013. Dissecting phenotypic traits linked to human resilience to Alzheimer’s pathology. Brain 136, 2510–2526. [DOI] [PMC free article] [PubMed] [Google Scholar]
- Quintanilla RA, et al. , 2004. Interleukin-6 induces Alzheimer-type phosphorylation of tau protein by deregulating the cdk5/p35 pathway. Exp Cell Res 295, 245–57. [DOI] [PubMed] [Google Scholar]
- Rao JS, et al. , 2012. Neuroinflammation and synaptic loss. Neurochem Res 37, 903–10. [DOI] [PMC free article] [PubMed] [Google Scholar]
- Richardson PM, 1991. Neurotrophic factors in regeneration. Curr Opin Neurobiol 1, 401–6. [DOI] [PubMed] [Google Scholar]
- Ringheim GE, et al. , 1998. Enhancement of beta-amyloid precursor protein transcription and expression by the soluble interleukin-6 receptor/interleukin-6 complex. Molecular Brain Research 55, 35–44. [DOI] [PubMed] [Google Scholar]
- Rothwell N, et al. , 1997. The role of interleukin 1 in acute neurodegeneration and stroke: pathophysiological and therapeutic implications. J Clin Invest 100, 2648–52. [DOI] [PMC free article] [PubMed] [Google Scholar]
- Sasahara M, et al. , 1991. PDGF B-chain in neurons of the central nervous system, posterior pituitary, and in a transgenic model. Cell 64, 217–27. [DOI] [PubMed] [Google Scholar]
- Sebire G, et al. , 1993. In vitro production of IL-6, IL-1 beta, and tumor necrosis factor-alpha by human embryonic microglial and neural cells. J Immunol 150, 1517–23. [PubMed] [Google Scholar]
- Serrano-Pozo A, et al. , 2012. Stable size distribution of amyloid plaques over the course of Alzheimer disease. J Neuropathol Exp Neurol 71, 694–701. [DOI] [PMC free article] [PubMed] [Google Scholar]
- Shaftel SS, et al. , 2007. Sustained hippocampal IL-1 beta overexpression mediates chronic neuroinflammation and ameliorates Alzheimer plaque pathology. J Clin Invest 117, 1595–604. [DOI] [PMC free article] [PubMed] [Google Scholar]
- Sheng JG, et al. , 1996. In vivo and in vitro evidence supporting a role for the inflammatory cytokine interleukin-1 as a driving force in Alzheimer pathogenesis. Neurobiol Aging 17, 761–6. [DOI] [PMC free article] [PubMed] [Google Scholar]
- Smits A, et al. , 1991. Neurotrophic activity of platelet-derived growth factor (PDGF): Rat neuronal cells possess functional PDGF beta-type receptors and respond to PDGF. Proc Natl Acad Sci U S A 88, 8159–63. [DOI] [PMC free article] [PubMed] [Google Scholar]
- Thériault P, et al. , 2015. The dynamics of monocytes and microglia in Alzheimer’s disease. Alzheimer’s Research & Therapy 7, 41. [DOI] [PMC free article] [PubMed] [Google Scholar]
- Thier M, et al. , 1999. Interleukin-6 (IL-6) and its soluble receptor support survival of sensory neurons. J Neurosci Res 55, 411–22. [DOI] [PubMed] [Google Scholar]
- Tobinick E, et al. , 2006. TNF-alpha modulation for treatment of Alzheimer’s disease: a 6-month pilot study. Med. Gen. Med 8, 25. [PMC free article] [PubMed] [Google Scholar]
- Weaver JD, et al. , 2002. Interleukin-6 and risk of cognitive decline: MacArthur studies of successful aging. Neurology 59, 371–8. [DOI] [PubMed] [Google Scholar]
- West MJ, Gundersen HJ, 1990. Unbiased stereological estimation of the number of neurons in the human hippocampus. J Comp Neurol 296, 1–22. [DOI] [PubMed] [Google Scholar]
- Wilkinson BL, Landreth GE, 2006. The microglial NADPH oxidase complex as a source of oxidative stress in Alzheimer’s disease. J Neuroinflammation 3, 30. [DOI] [PMC free article] [PubMed] [Google Scholar]
- Wood LB, et al. , 2015. Identification of neurotoxic cytokines by profiling Alzheimer’s disease tissues and neuron culture viability screening. Sci Rep 5, 16622. [DOI] [PMC free article] [PubMed] [Google Scholar]
- Wright CB, et al. , 2006. Interleukin-6 is associated with cognitive function: the Northern Manhattan Study. J Stroke Cerebrovasc Dis 15, 34–8. [DOI] [PMC free article] [PubMed] [Google Scholar]
- Wyss-Coray T, 2006. Inflammation in Alzheimer disease: driving force, bystander or beneficial response? Nat Med 12, 1005–1015. [DOI] [PubMed] [Google Scholar]
- Xia MQ, et al. , 1998. Immunohistochemical study of the beta-chemokine receptors CCR3 and CCR5 and their ligands in normal and Alzheimer’s disease brains. Am J Pathol 153, 31–7. [DOI] [PMC free article] [PubMed] [Google Scholar]
- Xing Z, et al. , 1998. IL-6 is an antiinflammatory cytokine required for controlling local or systemic acute inflammatory responses. J Clin Invest 101, 311–20. [DOI] [PMC free article] [PubMed] [Google Scholar]
- Yamada K, et al. , 1995. Decreased interleukin-6 level in the cerebrospinal fluid of patients with Alzheimer-type dementia. Neurosci Lett 186, 219–21. [DOI] [PubMed] [Google Scholar]
- Yamada M, Hatanaka H, 1994. Interleukin-6 protects cultured rat hippocampal neurons against glutamate-induced cell death. Brain Res 643, 173–80. [DOI] [PubMed] [Google Scholar]
- Yasukawa H, et al. , 2003. IL-6 induces an anti-inflammatory response in the absence of SOCS3 in macrophages. Nat Immunol 4, 551–6. [DOI] [PubMed] [Google Scholar]
- Ye L, et al. , 2013. IL-1beta and TNF-alpha induce neurotoxicity through glutamate production: a potential role for neuronal glutaminase. J Neurochem 125, 897–908. [DOI] [PMC free article] [PubMed] [Google Scholar]
- Yong KL, 1996. Granulocyte colony-stimulating factor (G-CSF) increases neutrophil migration across vascular endothelium independent of an effect on adhesion: comparison with granulocyte-macrophage colony-stimulating factor (GM-CSF). Br J Haematol 94, 40–7. [DOI] [PubMed] [Google Scholar]
- Zheng C, et al. , 2016. The dual roles of cytokines in Alzheimer’s disease: update on interleukins, TNF-alpha, TGF-beta and IFN-gamma. Transl Neurodegener 5, 7. [DOI] [PMC free article] [PubMed] [Google Scholar]
Associated Data
This section collects any data citations, data availability statements, or supplementary materials included in this article.