

Abstract
The advent of whole-slide imaging in digital pathology has brought about the advancement of computer-aided examination of tissue via digital image analysis. Digitized slides can now be easily annotated and analyzed via a variety of algorithms. This study reviews the fundamentals of tissue image analysis and aims to provide pathologists with basic information regarding the features, applications, and general workflow of these new tools. The review gives an overview of the basic categories of software solutions available, potential analysis strategies, technical considerations, and general algorithm readouts. Advantages and limitations of tissue image analysis are discussed, and emerging concepts, such as artificial intelligence and machine learning, are introduced. Finally, examples of how digital image analysis tools are currently being used in diagnostic laboratories, translational research, and drug development are discussed.
Keywords: Artificial intelligence, computational pathology, digital pathology, image analysis, quantitative image analysis, whole-slide imaging
INTRODUCTION
Modern pathology practice is moving toward a digital workflow, cumulating in utilizing computer screens to view scanned histology slides. This process of digitization of glass slides, in combination with the development of specialized software tools to identify and measure events previously observed via a microscope, has brought about the ability for pathologists to utilize digital image analysis on tissue sections. Tissue image analysis, when performed correctly, can result in the generation of tissue-derived readouts that are precise and highly reproducible.
This white paper provides an introduction to the digital analysis of scanned tissue slides and outlines the current state of available software tools as well as their advantages and their limitations. In addition, we provide examples of areas in which these tools are currently utilized to generate data in preclinical and clinical workflows that go beyond the conventional histopathological data provided by manual pathology review.
Image analysis and whole-slide imaging
The term “image analysis” has been reserved for the specific discipline that aims to obtain meaningful information from images in an objective and reproducible manner. The origin of analyzing images with objective tools is almost as old as microscopy itself. It started with measuring and counting when Leeuwenhoek developed a system to measure microscopic objects in the 17th century.[1]
Although there were many incremental advances throughout the centuries, image analysis remained largely unchanged until the advent of digital imaging and computerized analysis in the second half of the last century. From the 1970s on, new tools were developed that allowed for easier measurement of cellular or tissue components. In 1980, video cameras became widely available, leading to further improvement of available systems.[1] Around the year 2000, digital slide scanners became commercially available, and whole-slide imaging (WSI) started to become increasingly common.
The reader is advised to review the Digital Pathology Association's (DPA) white paper on WSI for an introduction to the technical and workflow aspects of digitizing glass slides.[2] To summarize, the traditional glass histology slide is digitized via a slide scanner and can be viewed on a computer screen or handheld device at a similar resolution as light microscopy. Compared to the general workflow of how tissue sections are prepared and viewed under a microscope, this digital workflow requires additional equipment (e.g., slide scanner, image storage, and digital pathology workstation for viewing), trained personnel, and specific quality control steps (e.g., quality control of scans), all of which require increased information technology and departmental resources.[3] However, there are multiple advantages of transitioning to a digital workflow, including ease of slides and cases sharing (consulting with other pathologists, or collaborating within interdisciplinary research teams), standardization of teaching, organization of archived digitized slides, and extraction of complex data in a highly reproducible fashion via specialized software.[4] The pathologist plays a key role both in the process of slide digitization and in the subsequent data generation via the use of appropriate image analysis algorithms.
Whole-slide images of tissue samples are rich in information, some of which was previously only accessible visually by a trained pathologist or biotechnologist whose expertise was based on previous experience and training. Therefore, manual readouts could easily be influenced by inherent cognitive and visual bias.[5] With a digital image, however, some of this information is amenable to more precise and reproducible extraction, which can reduce or potentially eliminate human bias. In response to this new technology, the market is rapidly expanding with new companies that sell optimized software for extracting relevant digital information from images or that offer the data generation as a service.
Application areas of image analysis
Utilizing digital image analysis tools, the most commonly used categories of measurements that can be extracted from digitized tissue slides are area based, cell based, and measurements pertaining to objects in the tissue aside from cells.[4]
Area-based measurements include the most basic assessments, for example, quantifying the areas (2-dimensional) of a certain stain (e.g., chemical or immunohistochemistry [IHC] stain), the area of fat vacuoles, or other events present on a slide. Cell-based measurements aim at identifying and enumerating objects, e.g. cells. This identification of individual cells enables subsequent assessment of subcellular compartments. Finally, algorithms can be utilized to assess events or objects present on tissue sections that may not be comprised of individual cells. More detailed descriptions are given in the following sections. When undertaking assessment and quantification of biomarkers, image analysis tools can be of great value to standardize the analysis as well as minimize bias, subjectivity, and variability in the generated data. This includes the application of standard scoring paradigms to IHC-stained sections (e.g., programmed death-ligand 1 [PD-L1] scoring and human epidermal growth factor receptor 2 [HER2] scoring), as well as aid in the quantification of in situ hybridization (ISH) dots. These assessments can further be tuned to limit the quantification of the present biomarker to tissue compartments (e.g., tumor and stroma) and subcellular compartments (membranous, cytoplasmic, nuclear, or combination thereof), to consider variable staining thresholds, and/or to enable more global biomarker data collection that then can be interrogated in postprocessing steps. In addition, digital tissue image analysis tools can be applied not only to routine formalin-fixed, paraffin-embedded tissues but also to frozen sections, whole organ, and embryo mounts.[6,7,8,9] Similarly, a whole host of staining techniques (and combinations thereof) can be amendable to image analysis, not limited to routine hematoxylin and eosin (H and E) staining, IHC, or ISH labeling (chromogenic and fluorescent).[4,10,11,12,13]
While image analysis tools not only reduce bias introduced by both visual limitations and cognitive traps, they also enable capturing of data from tissue slides that may not be accessible during manual assessment via routine microscopy.[5,14]
Image analysis tools are already widely used in both clinical research and translational research, as well as various disciplines, ranging from oncology and immuno-oncology, to cardiology and hepatology, neurosciences, and many others.[8,11,15,16,17,18,19,20]
THE BASICS OF IMAGE ANALYSIS
Cellular analysis
One of the most fundamental units in a typical histology image is the cell. In H and E-stained slides, in particular, cell nuclei are prominently visible structures. Other cellular compartments are often visible as well and the cell's cytoplasm has its own characteristic staining attributes.[21,22,23] Second-order structures formed from arrangements of cells are readily observed in microscopic images and provide important cues that support several scoring and grading systems in cancer.[24,25] A common theme for computational image analysis is to achieve a quantitative representation of cell staining, morphology, and architecture that can ultimately be used to support diagnosis and prediction.[4] Therefore, demarcating cells or subcellular structures are among the first and most important steps of many image analysis routines.
This specification (enumeration of many objects is possible, cells is only one option) was specifically requested by reviewers. The term “segmentation” represents a process in which an image is spatially parsed into constituent parts that have some significance or utility. Segmentation can be applied to a histology image to delineate tissue compartments such as stroma or epithelium, to distinguish tumor from benign regions, or to identify subcellular structures such as cell nuclei. Cell segmentation generally refers to the process of identifying groups of pixels that represent a cell. Segmentation typically involves two key steps: identification of candidate pixels and demarcation of these pixels into compartments that best approximate the spatial confines of a single cell. This process is often difficult in the presence of adjacent or overlapping cells which can lead to undersegmentation (the representation of more than one cell as a single object).[26] Methods to avoid undersegmentation may, however, result in oversegmentation (the erroneous division of a single cell into multiple objects) [Figure 1].[27] A number of segmentation algorithms have been developed to identify cells in histology images. These algorithms typically employ fixed or adaptive thresholding, watershed segmentation, active contour models, template matching with shape priors, or a probabilistic framework and may consist of multiple stages that can incorporate a combination of these strategies.[28,29,30,31,32,33,34,35,36,37,38,39,40,41,42] When selecting a segmentation algorithm, users are often faced with the decision to prioritize sensitivity (how likely the algorithm is to capture a weakly stained nucleus or cell), specificity (how well the algorithm rejects artifacts), contour accuracy (how well the algorithm can approximate the exact shape of the nucleus or cell), and the likelihood of under- and oversegmentation. Ground truth defined by manual demarcation of cells by trained observers can help users evaluate the performance of a particular segmentation algorithm.[43]
Figure 1.
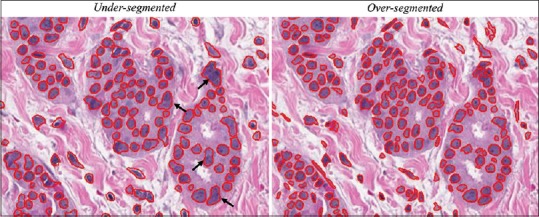
Hematoxylin and eosin-stained image analyzed using the “cell detection” algorithm in QuPath (open-source tool). Nuclear segmentation, depicted as red outlines, was fragmented in the rightmost image by setting the noise reduction Gaussian filter σ = 1.0. Conversely, nuclear oversegmentation was achieved by setting σ = 2.5. Black arrows in the left image denote examples of single objects that consisted of multiple nuclei
One of the most common uses of image analysis in pathology is to support the approximation of protein expression as assessed by IHC. For example, for invasive breast cancer, the College of American Pathologists’ (CAP) guidelines instruct pathologists to report the percentage and intensity of cells positively stained for estrogen receptor (ER) and progesterone receptor (PR), which can ultimately guide treatment strategy.[44,45] This procedure can benefit from the aid of quantitative image analysis, which in some cases has been shown to surpass pathologist performance.[46,47,48] Quantitative scoring of nuclear stains such as ER and PR requires segmentation of both positive and negative stained cell nuclei. Conventionally, ER and PR expression is parsed according to the intensity of staining. Stained nuclei are categorized into 0 (negative), 1+ (lightly stained), 2+ (intermediately stained), and 3+ (darkly stained) groups that are typically defined by a fixed threshold. The threshold may be applied to the overall intensity of the pixels, a single red, green, and blue channel, or to a single channel following a stain separation procedure.[49] Once the distribution of 0, 1+, 2+, and 3 +cells is determined, a laboratory may report a measure of intensity either as a simple average (usually rounded) or can use a weighted scoring system such as the H-score that combines information about the intensity of staining with the percentage of cells stained [Equation 1]. Although there is a direct relationship between H-score and the more conventional percent positive metric, H-score may have additional prognostic value not wholly captured by percent positivity.[50,51,52]
Equation 1: H =3 × (%3+) +2 × (%2+) + (%1+)
IHC is often used to also detect proteins expressed on the cell membrane or in the cytoplasm. One of the most widely used examples is HER2, a protein expressed at the cell membrane whose expression can directly guide treatment strategy and prognosis in a number of different tissues.[53,54,55] In breast tissue, guidelines for interpretation of HER2 expression are fairly well established and have undergone multiple modifications by consensus groups, most recently in 2018 with a set of updated CAP guidelines for scoring and interpretation.[56,57,58] The scoring strategy for HER2 combines both staining intensity and the circumferential pattern of staining (stain completeness), both of which are ultimately used to establish a HER2 score. Likewise, PD-L1, a membrane protein whose expression can determine treatment eligibility for immunotherapy, is recommended to be interpreted according to the staining intensity, spatial distribution of staining, and prevalence of staining in the tissue.[59,60,61] Image analysis routines can be harnessed to characterize these patterns of staining. The authors believe that quantitative image analysis can enhance the accuracy and reproducibility of interpretation of the staining pattern of various biomarkers.
Cell morphology can also provide important clues to support diagnosis and prediction. A number of classical studies have shown that nuclear area and shape (e.g., circularity and aspect ratio) carry prognostic value independent of other information.[62,63,64,65,66,67] Consequently, many groups have developed image analysis procedures to quantitatively measure these features to predict outcomes or to characterize tumors.[68,69,70,71] Additional cellular features such as H and E staining attributes and texture, nuclear/cytoplasmic ratio, and automated mitotic detection have also been used.[72]
Color normalization
One of the main obstacles to the development of successful image analysis routines is that stained tissue exhibits significant variability in color, making it difficult to apply simple rules to a dataset with vast differences in staining properties. For example, as noted in the previous sections, staining thresholds can often be an important element to an image analysis algorithm. However, when excessive staining variability is present in a dataset, applying a threshold may produce different results not due to intrinsic properties of the tissue but rather due to different staining or imaging protocols. Other image analysis procedures not based on threshold can also do poorly on image sets with significant color variability.[73] Figure 2 shows an example of different H and E staining appearances across tissue processed by different institutions, but variation within the same institution is also common.[23,73]
Figure 2.

Sample hematoxylin and eosin images obtained from six sources designated on the right depict different color attributes commonly encountered when viewing digital images of slides across laboratories or across imaging modalities
Color normalization is an image processing tool that has been developed to mitigate the effects of color variation by transforming the color properties of an image to align to a single standard, often specified by the user. This serves two purposes: (1) it reduces the overall staining variation within a sample and (2) it forces the color of the image to adhere to a desired color standard which can be useful for visualization. A number of different color normalization approaches have been developed that utilize intensity thresholding, histogram normalization, stain separation, color deconvolution, and structure-based color classification.[29,49,74,75,76,77,78,79,80,81,82] Many of these techniques have demonstrated a reduction in color variability by a factor of 2 or more. However, it is important to detect and assess distortions in the image that may potentially be introduced by these techniques.
TYPICAL ALGORITHM GRAPHICAL USER INTERFACE
There are numerous software packages, which are used by pathologists and researchers to step through the workflows described in previous sections.
Beneath the image analysis software are numerous computational algorithms that utilize a variety of parameters as inputs and perform the actual processing and segmentation of the image. Graphical user interfaces (GUIs) essentially expose the “knobs” underlying the algorithms, thus enabling end users who might lack a background in software engineering to interpret the image data and guide the analytic process.
A typical GUI walks the user through a series of steps. As an example, in the following, we describe a two-color chromogenic assay stained with hematoxylin, brown (Ki-67 marker), and red (CD3 T cell marker). The GUI would include a number of user-input parameters such as:
Color definition – Ability to set the color for each of the stains. In this example, blue for hematoxylin, brown for Ki-67, and red for CD3. Because actual stain colors vary, this GUI could include an eyedropper tool (or a tool with similar functionality) which allows the user to identify an example stain in the image
Nuclear detection – Many algorithms start with nucleus or cell detection. This GUI may include parameters such as nuclear size, color threshold, roundness, eccentricity, and other parameters to identify individual nuclei while excluding nonnuclear structures
Marker detection for each biomarker – This GUI would include parameters such as biomarker color (e.g., brown for Ki-67), cellular compartment (nuclear, cytoplasm, and membrane: e.g., nuclear for Ki-67), and intensity threshold to identify the desired stain in the right compartment, while excluding background staining
Expression categories – This GUI would include values to separate detected cells into negative, low, medium, or high (0, 1+, 2+, or 3+) based on the intensity thresholds. Depending on the use of an algorithm, some of these categories may be locked down to ensure reproducibility of results
Image analysis outputs – There are a plethora of image features output by algorithms. A GUI may include options to export only a subset of information.
An image analysis workflow is an iterative process where the user is adjusting the algorithm parameters, running the algorithm on a subset of images, and then evaluating the algorithm performance until sufficient algorithm performance is achieved. At times, for example, as part of a clinical trial, certain parameters are locked down after an algorithm has been validated, while others remain adjustable. GUIs often include tools for “fine tuning” the parameters where the user can adjust parameters and view results in real time. These tuning methods may improve accuracy via the establishment of a “human-in-the-loop” step, wherein pathologists contribute to the “ground truth.”
High content feature outputs
As an algorithm identifies cells and cellular compartments, it can extract information from each of these compartments, the individual cell (cellular or object data), as well as the entire population of cells (summary data) in the tissue analyzed. Examples are numerous: an algorithm may determine the cytoplasmic area of each cell, the membrane staining intensity, the number of ISH dots per nucleus, as well as cellular roundness, eccentricity, and many more.[4] For each of these parameters, the entire population of cells present can be analyzed or summarized. This can be, for example, in the form of plotting the data as a histogram incorporating all data points or a single score for the entire tissue.
Furthermore, objects that are comprised of cells can be interrogated similarly. For example, blood vessels are formed by cells, but when analyzing them via image analysis, one is rarely interested in the data of individual cells, but in the data of individual vascular profiles as well as the entire population of vessels.[4,83] This may include parameters such as major and minor diameter, circumference, and area.
Analog to this, analysis of tissue components that may not be formed by cells can yield similar data. For example, the analysis of vacuoles will result in both population data (e.g., average area of vacuoles, average circumference, range of major diameter), as well as individual vacuole data characterizing each vacuole identified.[84]
Utilizing the data mentioned above, algorithms can compute various tissue scores. Commonly used manual scoring paradigms range from classifying an entire tissue as positive or negative for a given analyte based on IHC staining, generation of a percent positive stain of a tissue compartment (e.g., percent positive neoplastic cells), scoring paradigms that combine percentage of biomarker-positive cells with the IHC staining intensity, to more complex scoring paradigms such as H-score or AllRed score. A review of these scoring approaches can be found in Aeffner et al.[5]
Many of the routine manual scoring paradigms commonly used are available in the commercially available software packages. In addition, individual Food and Drug Administration (FDA)-approved image analysis solutions for specific scoring scenarios are available for selecting stains and indications (e.g., HER2 scoring in breast cancer). Due to the wealth of data generated, and the computational power of algorithms, a multitude of new scoring paradigms are possible that go beyond what a pathologist can generate via manual evaluations. These scoring paradigms may be logical expansions of existing ones, e.g., expansions of the H-score into other cellular compartments or combinations thereof.[85] Others are novel assessments, which, in the case of the Immunoscore®, have already proven their utility and are actively used in the clinic.[86]
BEYOND TWO-DIMENSIONAL IMAGE ANALYSIS: STEREOLOGY AND DIGITAL THREE-DIMENSIONAL MODELING
While the most commonly used application of image analysis results in the interrogation of two-dimensional (2D) tissue slides of a three-dimensional (3D) object, this assessment is not always representative of the entire object due to inherent biases.[84] The two largest sources of bias are sampling bias and geometrical bias.[87] Stereology is the study of 3D representation from a limited 2D sampling and aims at minimizing bias by utilizing calculations (statistical theory and stochastic geometry) and stringent sampling methods.
In the context of tissue analysis, sampling bias means the probability of staining, sectioning, and imaging the structures of interest. If the subject of the study is sufficiently small, it may be missed if only a few planar sections are examined. For example, 2D sections limit the accuracy of quantification of findings such as chronic allograft vasculopathy. It has been shown that this quantification can be improved by reconstructing the murine coronary system in 3D from 2D digitized slides.[88] Similarly, geometric bias speaks to the fact that planar sampling may systematically miss structures of interest if a poor or unlucky sampling plane is selected. One of the promises of automated WSI is the ability to increase sampling (both in terms of numbers of slide, as well as of areas samples within a slide) and thus minimize the chances for these systematic biases to affect outcomes. Factors such as tissue shrinkage (which can vary section to section and sample to sample) must also be considered to ensure accurate and representative sampling.[89,90]
Image analysis combined with a stereology approach should be considered when an expected effect size is small or an unbiased estimate is required to compare effects across multiple experimental groups.
Due to the advances of digital image analysis, stereology has recently become more efficient and less cumbersome.[87] However, it remains a time-intensive methodology that requires to be performed by a skilled stereologist to ensure proper study design, sample preparation, and data interpretation, as well as specially trained histologists for pristine sample preparation.[87] Furthermore, it requires the usage of a significant amount of tissue, planning, and up-front work. Pilot studies are imperative for successful and accurate data generation.[87] Hence, stereology is not a methodology that can be applied retrospectively to a sample set.[90]
A full review of stereology as a methodology is beyond the scope of this manuscript but has been provided elsewhere.[87,90,91,92,93,94] Commercial image analysis solutions are available that include stereology modules to aid in application of the stereology method to whole-slide images.
THE PATHOLOGIST’S ROLE IN THE IMAGE ANALYSIS WORKFLOW
Within the general workflow of digital pathology and tissue image analysis, the pathologist plays an important role to ensure the value and quality of generated data. While extensive knowledge on algorithm development and image analysis tools is helpful, it is not a requirement. The value a pathologist brings to this workflow greatly lies in the technical knowledge of tissue handling, fixation, processing, and staining, as well as the specialty expertise in biology, histology, pathology, pathophysiology, biomarker expression, comparative anatomy, etc.[4]
Before engaging in any image analysis workflow, the quality of the tissue, histology slide, stain, and scan should be confirmed to ensure that it meets a quality standard that will allow collection of meaningful and reproducible data.[2,4,95,96] The validity of image analysis data can be greatly hampered by performing analysis on low-quality tissue, histology slides, and/or not properly optimized staining results.[84] Preanalytical variables such as interval between tissue harvest and fixation and total fixation time are often poorly controlled.[97,98] Quality control within a pathology laboratory is addressed later in this publication.
Region of interest selection
Whole-slide images contain a vast amount of information that can be difficult from a computational standpoint to process in their entirety. Furthermore, not every region in the whole-slide image is necessarily informative. Expanses of normal tissue and stromal cells, for example, may even have the effect of “diluting” useful information about the disease state in some image analysis algorithms, an effect that has an analog in molecular diagnostics.[99] Efforts to confine the image analysis region to one or more smaller regions of interests (ROIs) are therefore often necessary to create an accurate and computationally viable method for tissue image analysis.
Manual versus automated image annotations
Before running any type of image analysis algorithm on a particular slide, image annotations (also known as image masking) of ROIs are usually a prerequisite. Annotation allows the algorithm to focus on a particular area of the slide to perform the analysis. Two main strategies for annotating images can be employed: manual or automated.
Manual annotations often encompass drawing digital lines (inclusion and exclusion annotations) on whole-slide images to mark an ROI for the algorithm.[4] The algorithm will analyze all tissues included in the inclusion annotation, but omits analysis in that area for tissue regions marked with exclusion annotations. Those exclusions may include tissue structures not deemed for analysis, areas of necrosis, tissue artifacts, and staining artifacts. While manual annotations can be performed by a trained technician, final review and approval by a pathologist is advised.[4]
More tools have become available to automate the annotation process, especially as part of commercial software packages. In these solutions, the algorithm may come preprogrammed to identify specific features (e.g., mitotic figures and epithelial cells) or can be taught to identify specific features or structures (e.g., lung cancer nodules, glomeruli, and vessels), utilizing machine learning algorithms (discussed later). The accuracy of these automated annotations should nevertheless be checked by a pathologist as well.
Finally, crowdsourcing (as in soliciting help from a large number of individuals via web-based tools) of image annotations has recently been studied and may be an option for specific and large-scale studies.[100]
In addition to ensuring quality of annotations, the review by a pathologist may also gain valuable insight into the population of the study slides to be analyzed and highlight specific issues or potential pitfalls that may need to be considered during algorithm development.[4]
Pathologist's role in algorithm development and data review
The pathologist plays a crucial part in the iterative process of algorithm development and the review of generated data and its interpretation.
Whenever the assessment of biomarker expression via staining intensity is part of the objective of an analysis, final algorithm thresholds should be approved by a pathologist before data generation.[101,102] This is often done by reviewing the performance of test algorithms and thresholds on selected smaller areas of the ROI.[4]
These test algorithms should also be reviewed for other performance criteria. For example, are cells or other desired structures correctly identified and enumerated? Is the target tissue correctly identified and separated from other structures not intended for analysis? Is staining adequately classified (i.e., staining intensity or ISH dots as part of a scoring paradigm)? While it is not necessary for an algorithm to perform with 100% precision and accuracy, a reasonable level of performance should be met that correlates with the general goals of the analysis.[103,104] For example, it may be acceptable for a study which is designed to rank a large number of samples or tissue microarray (TMA) cores by staining to be less accurate, whereas a clinical study to inform treatment decisions or prognosis may be required to meet a more stringent predetermined expectation of accurate classification.[105] Specific samples that do not meet these predetermined criteria should be failed upon review, which should trigger either reworking of the algorithm, reanalysis, and re-review or exclusion from analysis.[4] However, depending on the software solution or image analysis toolbox used, the researcher or pathologist's ability to modify algorithms to improve performance may be limited. On the other hand, some commercially available solutions can provide so many options for modification that may be difficult to use or require image analysis experts to be involved in the workflow.[84,97]
Once test algorithms meet desired performance criteria, final analysis can be performed on a study set of slides. A pathologist should review the algorithm performance, typically by viewing the markup images (also known as segmentation overlays), a visual representation of the image segmentation and classification [Figure 3]. Different institutions practice different review strategies, ranging from review of every individual slide and markup to only reviewing a certain percentage of analysis runs. The appropriate extent of analysis review should be informed by the general question interrogated via image analysis and the impact of the data on research, decision-making, and ultimately patients. Only data from algorithms that pass the pathologist's review and the general performance criteria should be included in final reporting.[106] It is not uncommon that, for a few slides, no suitable analysis solution can be found.
Figure 3.
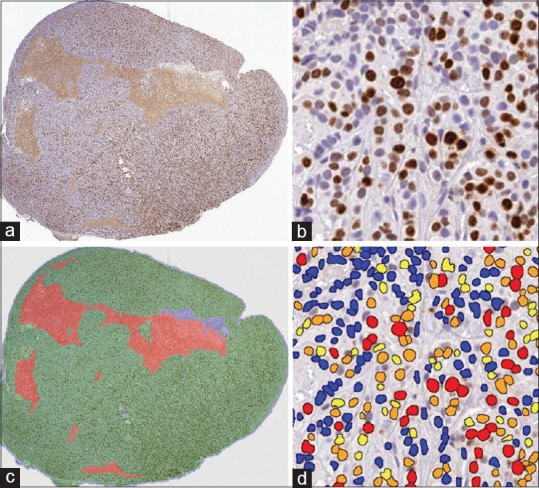
(a) A mouse xenograft tumor sample is stained with hematoxylin and Ki67 (DAB). (b) An enlarged region is shown where nuclei are stained blue and Ki67+ cells are brown. (c) A pathologist-trained random forest classifier is developed to identify tumor (green), stroma (blue), necrosis (red), and glass (gray). (d) The algorithm parameters are fine-tuned with the pathologist's input to optimize the nuclear segmentation and to define intensity thresholds to categorize the expression into four bins: 0+ (blue), 1+ (yellow), 2+ (orange), and 3+ (red)
Final data interpretation should also involve the expertise of a pathologist, but can be performed by a larger team with specialty expertise in various areas relevant to the objectives of the analysis. Due to large amounts of data generated, it is advised to have a biostatistician as part of such team.[4] Some commercially available algorithm solutions come with data interrogation and plotting tools to aid in this step of the analysis. Similarly, some image analysis service providers offer further statistical analysis and expert interpretation of study data as part of the service package.
Importance of quality control
Although there have been some quality assurance programs instituted for IHC (e.g., United Kingdom National External Quality Assessment System and International Quality Network for Pathology), there are few quality assurance check programs available to users in digital pathology.[107,108] Creating a similar quality stain across different runs of IHC is critical for achieving the optimal value from image analysis. Therefore, a human is still required for quality assurance of digital images before they can be processed by an image analysis algorithm. Inter- and intrarun variability in staining quality can generally be tolerated by pathologists during manual assessment. However, when image analysis tools are used to ask more detailed questions, utilizing the same slides displaying variable staining, results may be greatly influenced by inconsistent staining results. Similarly, technical aspects of the slide digitization, for example, maximum magnification, image compression, and color palette, can have an effect both on the viewed digital image and on the final image analysis results. Tissue heterogeneity can also introduce variability within the image analysis process.[84]
The validation of an image analysis algorithm for a specific biomarker assay is dependent on a number of other factors related to the histology, staining and scanning quality, and equipment. The level of validation is dependent on the assay's intended use, often referred to as “fit-for-purpose”. Whereas a clinical biomarker assay would require rigorous validation, a research or exploratory assay may require less.
For clinical use of an image analysis algorithm, it is important to know the use cases that the algorithm is intended for and to make sure that the algorithm is adequately validated for those specific tissue conditions, such as frozen tissue, formalin-fixed tissue, B5-fixed tissue, or decalcified tissue. In the future, there are likely to be more commercially available solutions for image analysis in the clinical space. This will be similar to purchasing an analyzer for the clinical pathology laboratory. However, the image analysis algorithms will need to be internally validated by each of the institutions before the algorithms can be used for clinical care. National societies such as the CAP are creating guidelines to facilitate adoption of image analysis into routine pathology workflows.
MACHINE LEARNING AND ARTIFICIAL INTELLIGENCE
Speaking the artificial intelligence language
The field of artificial intelligence (AI) comes with its own broad vocabulary. Many of these terms are used interchangeably or erroneously in common parlance.[109] While a number of resources exist online that go into great depth in explaining the nuances of the language around AI, there are some concepts at the core of most AI that can serve pathologists as a baseline in understanding the technology:[110]
AI – The broadest of these concepts, AI refers to any technology in which machines can perform activities considered “smart” or “human” in nature. This could involve hard coding the machine to perform specific tasks intelligently, machine learning, and other approaches[111]
Machine learning – Machine learning is the specific branch of AI in which machines are exposed to a large amount of data with the expectation that these machines establish their own patterns to interpret and act on new data[112]
Deep learning – Deep learning is a subset of machine learning. However, while supervised machine learning algorithms require some level of input in training, deep learning leverages artificial neural networks (ANNs) to make its own determination as to whether its interpretation or prediction is correct[113,114,115]
Supervised and unsupervised learning – The goal of machine learning, at its core, is to develop a machine that is capable of going from a set of inputs to a set of outputs. Supervised learning is the application of this concept with a known, defined set of outputs on which the system is assessed, while unsupervised learning has no predefined output set and enables the machine to determine what it defines as the natural patterns present in the data[109,116]
ANNs – Our own brains operate through a complex network of interconnected neurons. An ANN is a set of layered, connected artificial neurons, with a defined pathway for how data are propagated and moved through the system.[117] These ANNs provide a means of getting an output that is the result of several, often independent, steps of computation, weighting, and assessment.[118,119]
Brief history and evolution of artificial intelligence
Although AI is a very young field of inquiry, with some of the key contributors still being alive today, it has already been through several hype cycles and deep “AI winters” in its evolution.
Some now propose, however, that in 2018, the “plateau of productivity” has truly been reached and large-scale societal impact will be realized. In 2008, Thomas Fuchs, to some the “founding father of computational pathology”, demonstrated the utility of computational pathology with analysis of TMAs and survival prediction of renal clear cell carcinoma patients.[120] The advent of graphics processing units (GPUs) in the late 2000s further advanced the field, and in 2012, Dan Ciresan et al. showed a significant improvement on the best performance in the literature for multiple image databases using multicolumn deep neural networks for image classification – the era of convolutional neural networks (CNNs) was born.[121]
Where are we now?
AI as applied to medical image analysis is still a very young but rapidly burgeoning field. It is <10 years since the advent of GPUs and CNNs, both of which have radically advanced the opportunities in this space. The following are some of the areas in pathology and related fields which either already have seen or are likely to soon see the implementation of AI:
Radiomics and Pathomics – In other data-rich fields of medicine, AI is already being implemented in health-care practices as a means of addressing workload volume and driving augmentative insights. For example, service providers exist that offer workload easing AI at a fixed per-case price in the field of radiology.[122] Similar nondiagnostic workflow applications of AI are valuable for pathology. As AI becomes an increasingly relevant part of individual fields of medicine, overlap and cross-specialty application is natural progression for the technology[123,124]
New Integrative Diagnostics for Oncology: Computational methods have revolutionized the ability to assess the quantitative, spatial, and temporal architecture of tumors. Anant Madabhushi, for example, has pioneered new methods to measure tumor-infiltrating lymphocytes and proposed an image-based risk score, which computes the probability of disease aggressiveness using features mined from medical images for a variety of cancers.[120,125]
-
Further potential in pathology:
- Companion diagnostics – As pharmaceutical companies continue to develop targeted approaches to cancer therapy, there is a growing need for companion diagnostics. Conventionally, these have been biomarker specific. However, AI may serve as a separate approach to correlate patterns in tissue with likelihood or degree of response to therapies[113,126]
-
Computer-aided diagnosis – Training an AI product as an inferential tool inherently lends itself toward assisting in diagnosis. Whether this ultimately in an application that presents measurements and quantifications of parameters already used in diagnostic assessment or develops as a predictive indicator, AI will have a growing role to play in the diagnostic element of pathology[127]
- The Camelyon17 was organized by the Diagnostic Image Analysis Group and Department of Pathology of the Radboud University Medical Center (the Netherlands). The purpose of this challenge was to come up with a fully automated method to identify breast cancer metastases in whole-slide images of lymph nodes and to classify each lymph node into one of four stages: (1) cancer negative, (2) isolated tumor cells, (3) micrometastases, or (4) macrometastases. More information including data and results can be found at https://camelyon17.grand-challenge.org/(last accessed: October 14, 2018).[128] A similar previous challenge was called Camelyon16, and it is expected that comparable future challenges will be opened up to continue to incentivize and highlight technological advances in this area
- A global initiative to better understand kidney disease, which is using unsupervised learning of whole-slide images, is the nation institutes of health NIH-lead Kidney Precision Medicine Project (KPMP), which has revealed new insights into the morphology of glomerular diseases (https://www.niddk.nih.gov/research-funding/research-programs/kidney-precision-medicine-project-kpmp; last accessed: October 3, 2018).
INCORPORATING IMAGE ANALYSIS INTO PATHOLOGY WORKFLOW
Depending on if image analysis tools are used within a clinical setting or as part of a research laboratory in drug development, different aspects need to be considered with regard to how to best integrate image analysis within the laboratory's workflow.
Clinical/diagnostic workflow
The value added by image analysis in pathology is exemplified by biomarkers, mitotic detection, nuclear morphology detection, cancer grading, hematology, and others.[72,84,129,130,131,132,133] The most frequent application for patient care purpose is a quantitative analysis of IHC study of ER, PR, and HER2 for breast cancer as prognostic and predictive biomarkers.
The key elements to incorporate image analysis in pathology workflow include the quality of the slides (sectioning, staining, and scanning), image quality, ROI selection, algorithm selection, and the expertise of the pathologist who will be able to correlate the image analysis result with the relevant clinical information to make sure it is appropriate for that particular patient/case. Using breast cancer biomarker quantitative image analysis as an example, a few comments on algorithm selection and the role of pathologists are addressed here.
A good quantitative image analysis algorithm produces accurate, precise, and reproducible results. Accuracy defines the degree of correctness or true values of a given laboratory result comparing to a gold standard, which implies freedom of error. Precision defines the degree to which a test provides the same measurement over time.[134] There are basically three types of algorithm available currently in the diagnostic space: (1) FDA-cleared – FDA has determined that the commercially available product is substantially equivalent to another legally marketed algorithm for the same purpose as safe and effective. A premarket notification is referred as to 510(k);[135] (2) non-FDA approved commercially available – these products can be FDA registered for investigational use only; and (3) laboratory developed test – the algorithm is designed and used within a single laboratory according to the laboratory's own procedure. When laboratories choose to use quantitative image analysis for clinical purpose, the quantitative image analysis system and algorithm must be validated for diagnostic interpretation. Validation is designed to gather and document evidence that a system or test will consistently produce a result that meets predetermined acceptance criteria. Clinical laboratory improvement amendments and CAP require that laboratories validate the performances of tests to meet the operational needs of the tests.[136] FDA-cleared quantitative image analysis systems and algorithms have less validation burden than non-FDA-cleared products for the laboratory.
As an example, according to the ASCO/CAP HER2 guideline, quantitative image analysis can be used to achieve consistent interpretation. To further guide pathologists to improve accuracy, precision, and reproducibility in the interpretation of HER2 in breast cancer using image analysis, CAP developed evidence-based recommendations. These include 11 recommendations, 7 of which are based on CAP laboratory accreditation requirements and 4 are based on expert consensus opinions. In summary, quantitative image analysis and procedures must be validated before implementation, followed by regular maintenance and ongoing evaluation of quality control and quality assurance. HER2 analysis performance, interpretation, and reporting should be supervised by pathologists with expertise in image analysis.[137]
Research and drug development image analysis workflow
Research laboratories performing tissue-based research, especially biomarker discovery, were early adopters of digital pathology due to the valuable and multiparametric outputs offered by quantitative image analysis. It is the pharmaceutical and academic research market which appears to be the majority of users of digital pathology image analysis systems.
High-throughput tissue biomarker screening, particularly in the area of oncology, was bolstered by the introduction of digital pathology image analysis. TMAs, made by transferring cylindrical cores of tissue from paraffin-embedded donor blocks into recipient paraffin, can contain tens to thousands of tissue specimens.[138] TMA slides are probed using typical IHC or ISH techniques to allow biomarkers to be compared across all specimens simultaneously. TMAs save precious tissue and remove issues associated with slide-to-slide staining variability. TMA workflow tools available within many of today's digital pathology image analysis platforms complement this powerful technology by automating the segmentation and analysis of tissue cores, thus allowing biomarker expression to be scored quickly and objectively. TMAs are used to address a variety of different research questions: to investigate the state of the cancer proteome at different stages of tumorigenesis, to understand biochemical pathways involved in the development of different types of cancer, to identify potential new therapeutic targets, and to screen candidate prognostic or predictive biomarkers.
Within the field of immuno-oncology, researchers have made extensive use of tissue image analysis tools. For example, it has been shown that the number and location of CD8-positive lymphocytes is critical for measuring immune response in PD-L1-positive and PD-L1-negative non-small cell carcinoma samples via analysis with commercial software.[139] Utilizing TMAs of colonic adenocarcinomas, open-source software demonstrated its ability to analyze IHC staining for CD3, CD8, p53, and PD-L1.[140] In breast carcinoma TMAs, it was shown that analysis with a commercial software yielded superior results over manual scoring when evaluating the biomarker Ki-67, ER, PR, and HER2.[46]
While TMAs offer the advantage of being able to screen biomarker expression across large numbers of specimens simultaneously, the small TMA cores may not adequately capture information about tissue and biomarker heterogeneity. It is not uncommon in cancer to find significant regional heterogeneity in tumor biomarker expression within a single biopsy, and in some cases, such as with HER2 expression, this heterogeneity may impact patient outcomes.[141,142] Likewise, in immuno-oncology, lymphocytes may be unevenly distributed within the tumor microenvironment; therefore, a single field of view or biopsy core may not always be representative. Some modern digital pathology image analysis platforms provide tools to help researchers with these “big picture” questions. For example, biomarker heterogeneity can be visualized by creating a spatial plot of cell data and color-coding dots based on the level of biomarker expression [Figure 4a]. Researchers can easily identify “hot spots” of high (or low) expression across whole-slide tissues using these “heat map” views. Spatial plots can also be used to quantify the spatial distances between different cell types in the tissue, such as lymphocytes and tumor cells [Figure 4b]. In the latter instance, multiple biomarkers may be required to differentiate specific immune and tumor cell phenotypes. In instances where more than two markers are required, fluorescent whole-slide scanning or multispectral imaging platforms are employed in combination with compatible algorithms to facilitate multiplexed analysis.[143]
Figure 4.
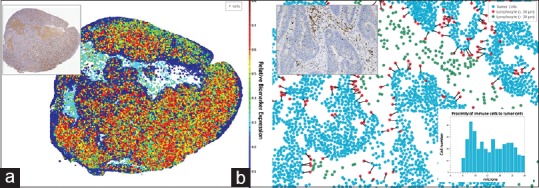
Digital pathology image analysis in spatial context reveal biomarker and cell heterogeneity. (a) The inset digital slide with DAB-stained biomarker (brown) was analyzed. Cells identified in the analysis were plotted spatially as a dot plot and each cell “dot” color coded according to the optical density of DAB stain in that cell. Cells in “cooler” colors (blues and greens) have lower stain optical density compared to cells in “warmer” colors (yellow, orange, and red). (b) Tumor cells and immune cells (DAB-positive) identified by image analysis were plotted spatially and analyzed to quantify immune cells within 30 μm of tumor cells (proximal immune cells). Tumor cells are colored blue, proximal immune cells are colored red, and nonproximal immune cells are green. The distance between tumor cells and proximal immune cells are recorded to create a histogram (inset, bottom right) and are connected by nearest neighbor lines in the dot plot
Digital pathology image analysis and related technologies are applicable to areas of research beyond oncology. Scientists interested in metabolic disease states, such as diabetes, may use image analysis to understand the metabolic state of the pancreas in animal models. In this instance, image analysis is used to measure overall expression of metabolic hormones, insulin, glucagon, and/or somatostatin and to quantify the relative number of cells that are secreting these hormones within the pancreatic islets [Figure 5a].[144,145,146] Changes to islets and pancreatic structure can occur as a result of drug toxicity as well. In this instance, machine learning-based tissue classification approaches are useful for evaluating the relative composition and morphology of the pancreas.[146] Neuroscientists interested in Alzheimer's disease have adopted digital pathology image analysis and stereological approaches to quantify density and size of beta-amyloid plaques in cortex and hippocampus [Figure 5b].[147,148,149] In sciatic and optical nerve, digital image analysis is used to calculate axon G-ratios, a measurement of myelination.[150] Digital pathology image analysis is also ideally suited for screening whole brain tissues for rare, but physiologically relevant events, such as microhemorrhages, which may be missed using conventional microscopy. Large brain sections must be mounted on large format slides, and the development of slide scanners that can handle larger formats has greatly expanded the utility of digital pathology image analysis within the field of neuroscience.
Figure 5.
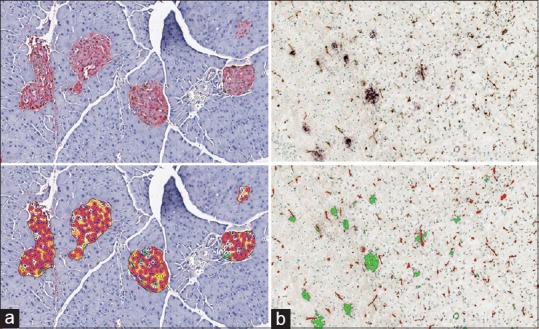
Digital pathology image analysis in the pancreas and brain. (a) Islets stained with antibodies against insulin (red stain) and glucagon (brown stain) in digital slides. Analysis shown bottom left quantifies number of islets that are of islet (orange area in markup) and number of cells that are positive for insulin (red cell markup), glucagon (green cell markup), both (yellow cell markup), or neither marker (white cell markup). (b) Identification of beta-amyloid plaques in brain sections. Slides are probed with antibodies against beta-amyloid (purple) and vessel endothelial marker (brown). Digital image analysis shown bottom right quantifies density, diameter, and area of vessels (red markup) and plaques (green markup), and colocalized area (yellow markup)
Within the drug development pipeline, pharmaceutical researchers utilize many of the same image analysis applications as their academic counterparts during the early phases of drug development. Downstream of discovery, digital image analysis can assist researchers and pathologist in preclinical testing and clinical trials [Table 1]. Some of the quantitative algorithms that emerge from drug development research may transition into the clinic as companion diagnostics, thus closing the circle of technology adoption. While there are only a handful of complementary quantitative algorithms (e.g., HER2), there are no current examples where quantitative algorithms are required to interpret a companion biomarker. Nonetheless, promising findings in the area of immuno-oncology described above suggest that this area of image analysis is poised for significant growth in the coming decade.
Table 1.
Role of image analysis in different phases of drug development
| Phase | Image analysis role |
|---|---|
| Discovery phase | • Quantitative analysis of target and pathway inhibition biomarkers using xenografts and in vivo models: Understand how the drug target and pathway biomarkers are regulated by drug concentration and dosing regimen |
| • Measurement of target expression and specificity using TMAs and other high-throughput approaches | |
| • Correlative analysis (e.g., efficacy) for identification of potential companion or complementary biomarkers based on animal models | |
| Preclinical studies | • Animal models and safety assessment (non-GLP): Quantification of hypertrophy, steatosis, fibrosis, and other readouts using traditional image analysis approaches |
| • Quantification of organ morphology using machine learning-based tissue classification (e.g., islets in pancreas and glomeruli in kidney) | |
| • Additional studies in different animal models to identify potential clinical biomarkers | |
| Clinical trials | • Analysis of biomarkers used for patient stratification and prediction of therapeutic response |
| • Deep learning approaches to identify classifiers for patient stratification and prediction of therapeutic response |
TMA: Tissue microarray , GLP: Good laboratory practice
AVAILABLE TOOLS: APPLICATION MODULES VERSUS DEVELOPMENT ENVIRONMENT
There are numerous tools available to the pathologist and researcher to facilitate the quantitative analysis of histology-based images. These tools can be integrated with a digital pathology image management platform or as a separate software platform. Image analysis platforms are available from both commercial vendors and open-source software providers or as a service from a contract research organization. These service providers may use commercial software or proprietary image analysis tools. In general, there are two different types of image analysis platform tools: prebuilt application modules or development/toolboxes that enable the user to build a custom image analysis pipeline or workflow.
Prebuilt application modules are image analysis algorithms designed to analyze a specific biomarker localization or tissue morphological phenotype. These modules are typically designed for ease of use with a minimum set of adjustable parameters, though they can get quite complex for advanced applications such as multiplex assays. One example of a relatively simple assay is for a single compartment (nuclear) biomarker such as Ki67, a tissue biomarker for cellular proliferation. A nuclear module may include only a few user-adjustable parameters such as color selection (e.g., blue for hematoxylin and brown for DAB IHC stain), nuclear size (a priori information to help algorithm segment nuclei), and intensity threshold (to identify Ki67-positive cells vs. Ki67-negative cells). The user may also be able to configure which image analysis features are extracted (e.g., number of total cells, positive cells, nuclei area, and nuclei diameter). An example of a more complex image analysis module is an algorithm to measure multiple biomarkers in a single image, i.e., multiplex assays. These are becoming common, especially for immune phenotyping in tissue. This multiplex module would need more user-adjustable parameters to address the segmentation of each individual biomarker. In the case of a multiplex brightfield assay, the user would need to define each color (for example, blue for hematoxylin, brown for CD4, yellow for CD8, and cyan for FoxP3). The user would also need to select the localization of each biomarker (nuclear, cytoplasm, and membrane), thresholds, etc. One can see how the number of user-configurable parameters quickly increases with these multiplex assays. Once configured, the settings can be saved, so that subsequent users can simply load the parameters for testing and running the assay on additional images. These two examples are for cellular localization of biomarkers, but there are numerous other examples of prebuilt image analysis modules such as measuring pancreatic islets, neurons, chromogenic or fluorescent ISH, microvessels, fat vacuoles, and many other applications.
A second approach for image analysis algorithms is the toolbox approach. The software includes a set of tools that are used to build a “script” to analyze each image. The tools are generally organized by different functions: color separation, preprocessing, object segmentation, postprocessing, and filtering. The user would develop the script to include the processing tools required for their specific application. For the Ki67 assay above, a script might include these steps:
Color separation of blue (hematoxylin) and brown (DAB) to create two image masks (nuclei only and Ki67 only)
Threshold probability map to identify nuclei or Ki67+ pixels and generate two image masks (nuclei only and Ki67 only)
Object segmentation algorithm, e.g., watershed algorithm, to segment individual objects from image mask (nuclei and Ki67+ cells)
Splitting algorithm to split touching nuclei
Threshold algorithm to distinguish negative and positive Ki67 nuclei
Postprocessing to remove any objects that are not real nuclei (e.g., based on size and shape)
Export appropriate image analysis features, e.g., number of total cells and positive cells.
Once a script is developed for a specific assay, the script can be used by other users, so novice users would not necessarily need to know the details of the tools to run the script on their set of images.
There are pros and cons to each approach. The module approach is user-friendly and can often be configured by the novice in an interactive trial-by-error approach with a minimal amount of training. If an available module addresses a user's specific biomarker application, they can typically install and run the image analysis the same day. The toolbox approach requires some expertise to understand what each function does, why you would use each function, and what order to apply each function. The toolbox approach requires more time for training, but can offer more flexibility in optimizing a script to a specific biomarker assay or tissue type. In either case, the approach depends on each user's or group's ability and needs, so it is recommended to spend time to understand tissue image analysis needs and evaluate multiple options to determine which solution is best for each situation.
How to decide between open-source and commercial software
In the past decade, a vast array of digital pathology image analysis software has emerged. Software types differ based on area of application, ease of use, cost, and customer support, among other variables. Open-source software provides a collaborative option for image analysis, whereas commercial software provides more personalized image analysis choices. Each option presents certain advantages and disadvantages [Table 2]. Given the number of open-source and commercial software solutions, it is often difficult to choose which tool is appropriate for a given task.
Table 2.
Pros and cons of open-source versus commercial digital image analysis software
| Open source | Commercial | |
|---|---|---|
| Cost | Free | Moderate to expensive |
| Technical support | Limited, provided by email and chat groups | Guaranteed support for customer issues |
| License | No software license necessary, and installation and updates administered by user | Software license required; installation and updates administered or supported by vendor |
| Viability | Life of software and new development at risk of open-source provider - potential short-term viability | Life of software and new development at risk of vendor - though typically longer-term viability |
| Fixing issues | Rapid, collaborative response to troubleshoot malfunctions | Only vendor experts can troubleshoot malfunctions |
| Software application training | Limited hands-on training, but online resources often exist | On-site and online training provided by vendor |
| Image file compatibility | May be compatible with a variety of image formats | May have limited compatibility |
Analytic software ranges from relatively inexpensive, toolbox-like software for basic tissue color quantification to complex and costly model-based applications for tissue recognition and quantification.[151] Although current pathology training involves progressive exposure to software, advanced computational skills are not universal. The ideal digital image analysis software should include easy installation, user-friendly instructions and training, optimal speed and capacity, rapid and effective customer support, and an intuitive interface that is easy to use.[152] Important considerations for choosing digital pathology image analysis software are presented in Table 3.
Table 3.
Important considerations for choosing digital pathology image analysis software
| Consideration | Key question(s) |
|---|---|
| Application | Will the software be utilized for optimization of clinical/diagnostic workflow, basic research, or research in a regulated environment? |
| User-friendliness | Is it easy and convenient to interact with the software interface? |
| Training requirement | What level of expertise is required to operate the software? |
| What duration of staff training will be required to effectively utilize the software? | |
| Performance: Speed and capacity | What is the speed and capacity of the analyzer? |
| How long does image processing take for a single image? Can the user increase throughput by utilizing distributed computing? | |
| Resources | What additional resources (e.g., technologists, hardware, laboratory footprint, IT infrastructure, etc.,) are required for the optimal function? |
| Technical support | Where is the nearest customer support location or time zone? |
| In what manner, and how quickly do customer support personnel respond to issues? | |
| Licensure | Is a paid license required? |
| Per user, per instance, or per laboratory/research unit? | |
| File compatibility | In what file format can data be exported? |
| Is the software compatible with multiple image file formats from various whole-slide scanners? | |
| Including bright-field and/or fluorescent scans? | |
| Data storage | What is the average file size of an analysis run and data packages created? |
| Cloud storage provided by vendor or own internal storage solution required? | |
| Servicing | How are hardware and software malfunctions managed? |
| How often are software updates required? | |
| Cost-benefit analysis | How much will the image analysis solution cost? |
| Can individual modules be acquired based on needs, or will a full package need to be | |
| purchased? | |
| What is the cost of servicing/updating the software? | |
| What are the terms of the warranty? | |
| What is the cost of all additional resources required for optimal use of the software? | |
| After how much time will use of the analyzer result in a net gain? | |
| Will there be enough use cases to justify investment into equipment, infrastructure and staff, or would outsourcing to a service provider be more economical? |
IT: Information technology
Commercial software can be expensive and requires dedicated training. It offers extensive technical support, which helps streamline issues that inevitably arise from frequent use of the software.[151,152,153,154] An open-source software offers a more cost-effective option for individuals who wish to become familiar with digital analyzers and for those who have infrequent or educational use of image analysis. Ultimately, the successful implementation of digital pathology imaging software will depend on the desired application and other variables. Finally, for infrequent utilization of image analysis, service providers are also available, enabling the usage of this technology without having to invest into own digital workflows, etc.
CONCLUSION
The combination of image analysis software and pathology expertise provides an opportunity to transform a traditionally qualitative assessment to a quantitative analysis of complex biomarker expression, patterns, and tissue phenotypes. Image analysis and machine learning algorithms can be used to automatically identify tissue compartments of interest, segment individual cells, or anatomical features and categorize these features based on biomarker expression levels and localization. The research scientist and pathologist will continue to be instrumental in both the use and operation of image analysis workflows, which will continue to evolve and transform both preclinical and clinical biomarker research.
ABOUT THE DIGITAL PATHOLOGY ASSOCIATION
The DPA was founded in 2009 and is a nonprofit organization comprised of pathologists, scientists, technologists, and industry representatives dedicated to advancing the field of digital pathology. The organization's mission is to facilitate education and awareness of digital pathology applications in health care and life sciences. The DPA's committees and task forces are dedicated to enhancing the field. The association collaborates with the FDA on equipment approvals and addressing technology regulations. The members are encouraged to share best practices and promote the use of the technology among colleagues to demonstrate efficiencies and share knowledge and its ultimate benefits to patient care. For more information, visit https://digitalpathologyassociation.org.
Financial support and sponsorship
Nil.
Conflicts of interest
There are no conflicts of interest.
Acknowledgments
The authors would like to thank Abbey Norris Kovacinski for her administrative support of this effort. The authors would also like to thank Dr. Navid Farahani for his thoughtful input on sections of this manuscript.
Footnotes
Available FREE in open access from: http://www.jpathinformatics.org/text.asp?2019/10/1/9/253721
REFERENCES
- 1.Meijer GA, Beliën JA, van Diest PJ, Baak JP. Origins of… image analysis in clinical pathology. J Clin Pathol. 1997;50:365–70. doi: 10.1136/jcp.50.5.365. [DOI] [PMC free article] [PubMed] [Google Scholar]
- 2.Zarella MD, Bowman D, Aeffner F, Farahani N, Xthona A, Absar SF, et al. A practical guide to whole slide imaging: A White paper from the digital pathology association. Arch Pathol Lab Med. 2018 doi: 10.5858/arpa.2018-0343-RA. doi: 10.5858/ arpa.2018-0343-RA. [Epub ahead of print] [DOI] [PubMed] [Google Scholar]
- 3.Griffin J, Treanor D. Digital pathology in clinical use: Where are we now and what is holding us back? Histopathology. 2017;70:134–45. doi: 10.1111/his.12993. [DOI] [PubMed] [Google Scholar]
- 4.Aeffner F, Wilson K, Bolon B, Kanaly S, Mahrt CR, Rudmann D, et al. Commentary: Roles for pathologists in a high-throughput image analysis team. Toxicol Pathol. 2016;44:825–34. doi: 10.1177/0192623316653492. [DOI] [PubMed] [Google Scholar]
- 5.Aeffner F, Wilson K, Martin NT, Black JC, Hendriks CLL, Bolon B, et al. The gold standard paradox in digital image analysis: Manual versus automated scoring as ground truth. Arch Pathol Lab Med. 2017;141:1267–75. doi: 10.5858/arpa.2016-0386-RA. [DOI] [PubMed] [Google Scholar]
- 6.Wuttisarnwattana P, Gargesha M, van’t Hof W, Cooke KR, Wilson DL. Automatic stem cell detection in microscopic whole mouse cryo-imaging. IEEE Trans Med Imaging. 2016;35:819–29. doi: 10.1109/TMI.2015.2497285. [DOI] [PMC free article] [PubMed] [Google Scholar]
- 7.Blacher S, Gérard C, Gallez A, Foidart JM, Noël A, Péqueux C, et al. Quantitative assessment of mouse mammary gland morphology using automated digital image processing and TEB detection. Endocrinology. 2016;157:1709–16. doi: 10.1210/en.2015-1601. [DOI] [PubMed] [Google Scholar]
- 8.Aeffner F, Martin NT, Peljto M, Black JC, Major JK, Jangani M, et al. Quantitative assessment of pancreatic cancer precursor lesions in IHC-stained tissue with a tissue image analysis platform. Lab Invest. 2016;96:1327–36. doi: 10.1038/labinvest.2016.111. [DOI] [PubMed] [Google Scholar]
- 9.Aeffner F, Faelan C, Moore SA, Moody A, Black JC, Charleston JS, et al. Validation of a muscle-specific tissue image-analysis tool for quantitative assessment of dystrophin staining in frozen muscle biopsies. Arch Pathol Lab Med. 2018 doi: 10.5858/arpa.2017-0536-OA. doi: 10.5858/arpa.2017-0536-OA. [Epub ahead of print] [DOI] [PMC free article] [PubMed] [Google Scholar]
- 10.Chen JM, Li Y, Xu J, Gong L, Wang LW, Liu WL, et al. Computer-aided prognosis on breast cancer with hematoxylin and eosin histopathology images: A review. Tumour Biol. 2017;39:1010428317694550. doi: 10.1177/1010428317694550. [DOI] [PubMed] [Google Scholar]
- 11.Reisenbichler ES, Horton D, Rasco M, Andea A, Hameed O. Evaluation of dual immunohistochemistry and chromogenic in situ hybridization for HER2 on a single section. Am J Clin Pathol. 2012;137:102–10. doi: 10.1309/AJCPLNHINN9O6YSF. [DOI] [PubMed] [Google Scholar]
- 12.Chaudhuri AD, Yelamanchili SV, Fox HS. Combined fluorescent in situ hybridization for detection of microRNAs and immunofluorescent labeling for cell-type markers. Front Cell Neurosci. 2013;7:160. doi: 10.3389/fncel.2013.00160. [DOI] [PMC free article] [PubMed] [Google Scholar]
- 13.Elmore SA, Aeffner F, Bangari DS, Crabbs TA, Fossey S, Gad SC, et al. Proceedings of the 2017 national toxicology program satellite symposium. Toxicol Pathol. 2017;45:799–833. doi: 10.1177/0192623317733924. [DOI] [PMC free article] [PubMed] [Google Scholar]
- 14.Henson DE. End points and significance of reproducibility in pathology. Arch Pathol Lab Med. 1989;113:830–1. [PubMed] [Google Scholar]
- 15.Bolon B, Aeffner F. A primer for oncoimmunology (Immunooncology) Toxicol Pathol. 2017;45:584–8. doi: 10.1177/0192623317713318. [DOI] [PubMed] [Google Scholar]
- 16.Pavlides M, Birks J, Fryer E, Delaney D, Sarania N, Banerjee R, et al. Interobserver variability in histologic evaluation of liver fibrosis using categorical and quantitative scores. Am J Clin Pathol. 2017;147:364–9. doi: 10.1093/ajcp/aqx011. [DOI] [PMC free article] [PubMed] [Google Scholar]
- 17.Lee MJ, Bagci P, Kong J, Vos MB, Sharma P, Kalb B, et al. Liver steatosis assessment: Correlations among pathology, radiology, clinical data and automated image analysis software. Pathol Res Pract. 2013;209:371–9. doi: 10.1016/j.prp.2013.04.001. [DOI] [PubMed] [Google Scholar]
- 18.Lloyd MC, Johnson JO, Kasprzak A, Bui MM. Image analysis of the tumor microenvironment. Adv Exp Med Biol. 2016;936:1–0. doi: 10.1007/978-3-319-42023-3_1. [DOI] [PubMed] [Google Scholar]
- 19.Watanabe J, Asaka Y, Kanamura S. Relationship between immunostaining intensity and antigen content in sections. J Histochem Cytochem. 1996;44:1451–8. doi: 10.1177/44.12.8985137. [DOI] [PubMed] [Google Scholar]
- 20.Daunoravicius D, Besusparis J, Zurauskas E, Laurinaviciene A, Bironaite D, Pankuweit S, et al. Quantification of myocardial fibrosis by digital image analysis and interactive stereology. Diagn Pathol. 2014;9:114. doi: 10.1186/1746-1596-9-114. [DOI] [PMC free article] [PubMed] [Google Scholar]
- 21.Wittekind D. Traditional staining for routine diagnostic pathology including the role of tannic acid 1.Value and limitations of the hematoxylin-eosin stain. Biotech Histochem. 2003;78:261–70. doi: 10.1080/10520290310001633725. [DOI] [PubMed] [Google Scholar]
- 22.Chan JK. The wonderful colors of the hematoxylin-eosin stain in diagnostic surgical pathology. Int J Surg Pathol. 2014;22:12–32. doi: 10.1177/1066896913517939. [DOI] [PubMed] [Google Scholar]
- 23.Zarella MD, Breen DE, Plagov A, Garcia FU. An optimized color transformation for the analysis of digital images of hematoxylin & eosin stained slides. J Pathol Inform. 2015;6:33. doi: 10.4103/2153-3539.158910. [DOI] [PMC free article] [PubMed] [Google Scholar]
- 24.Humphrey PA. Gleason grading and prognostic factors in carcinoma of the prostate. Mod Pathol. 2004;17:292–306. doi: 10.1038/modpathol.3800054. [DOI] [PubMed] [Google Scholar]
- 25.Bloom HJ, Richardson WW. Histological grading and prognosis in breast cancer; a study of 1409 cases of which 359 have been followed for 15 years. Br J Cancer. 1957;11:359–77. doi: 10.1038/bjc.1957.43. [DOI] [PMC free article] [PubMed] [Google Scholar]
- 26.Irshad H, Veillard A, Roux L, Racoceanu D. Methods for nuclei detection, segmentation, and classification in digital histopathology: A review-current status and future potential. IEEE Rev Biomed Eng. 2014;7:97–114. doi: 10.1109/RBME.2013.2295804. [DOI] [PubMed] [Google Scholar]
- 27.Qi X, Xing F, Foran DJ, Yang L. Robust segmentation of overlapping cells in histopathology specimens using parallel seed detection and repulsive level set. IEEE Trans Biomed Eng. 2012;59:754–65. doi: 10.1109/TBME.2011.2179298. [DOI] [PMC free article] [PubMed] [Google Scholar]
- 28.Al-Kofahi Y, Lassoued W, Lee W, Roysam B. Improved automatic detection and segmentation of cell nuclei in histopathology images. IEEE Trans Biomed Eng. 2010;57:841–52. doi: 10.1109/TBME.2009.2035102. [DOI] [PubMed] [Google Scholar]
- 29.Ballarò B, Florena AM, Franco V, Tegolo D, Tripodo C, Valenti C, et al. An automated image analysis methodology for classifying megakaryocytes in chronic myeloproliferative disorders. Med Image Anal. 2008;12:703–12. doi: 10.1016/j.media.2008.04.001. [DOI] [PubMed] [Google Scholar]
- 30.Korde VR, Bartels H, Barton J, Ranger-Moore J. Automatic segmentation of cell nuclei in bladder and skin tissue for karyometric analysis. Anal Quant Cytol Histol. 2009;31:83–9. [PMC free article] [PubMed] [Google Scholar]
- 31.Gurcan MN, Pan T, Shimada H, Saltz J. Image analysis for neuroblastoma classification: Segmentation of cell nuclei. Conf Proc IEEE Eng Med Biol Soc. 2006;1:4844–7. doi: 10.1109/IEMBS.2006.260837. [DOI] [PubMed] [Google Scholar]
- 32.Veta M, van Diest PJ, Kornegoor R, Huisman A, Viergever MA, Pluim JP, et al. Automatic nuclei segmentation in H&E stained breast cancer histopathology images. PLoS One. 2013;8:e70221. doi: 10.1371/journal.pone.0070221. [DOI] [PMC free article] [PubMed] [Google Scholar]
- 33.Nandy K, Gudla PR, Amundsen R, Meaburn KJ, Misteli T, Lockett SJ, et al. Automatic segmentation and supervised learning-based selection of nuclei in cancer tissue images. Cytometry A. 2012;81:743–54. doi: 10.1002/cyto.a.22097. [DOI] [PMC free article] [PubMed] [Google Scholar]
- 34.Latson L, Sebek B, Powell KA. Automated cell nuclear segmentation in color images of hematoxylin and eosin-stained breast biopsy. Anal Quant Cytol Histol. 2003;25:321–31. [PubMed] [Google Scholar]
- 35.Yang L, Meer P, Foran DJ. Unsupervised segmentation based on robust estimation and color active contour models. IEEE Trans Inf Technol Biomed. 2005;9:475–86. doi: 10.1109/titb.2005.847515. [DOI] [PubMed] [Google Scholar]
- 36.Mouelhi A, Sayadi M, Fnaiech F, Mrad K, Ben Romdhane K. Automatic image segmentation of nuclear stained breast tissue sections using color active contour model and an improved watershed method. Biomed Signal Proce Control. 2013;8:421–36. [Google Scholar]
- 37.Ali S, Veltri R, Epstein JI, Christudass C, Madabhushi A. Adaptive energy selective active contour with shape priors for nuclear segmentation and gleason grading of prostate cancer. Med Image Comput Comput Assist Interv. 2011;14:661–9. doi: 10.1007/978-3-642-23623-5_83. [DOI] [PubMed] [Google Scholar]
- 38.Fatakdawala H, Xu J, Basavanhally A, Bhanot G, Ganesan S, Feldman M, et al. Expectation-maximization-driven geodesic active contour with overlap resolution (EMaGACOR): Application to lymphocyte segmentation on breast cancer histopathology. IEEE Trans Biomed Eng. 2010;57:1676–89. doi: 10.1109/TBME.2010.2041232. [DOI] [PubMed] [Google Scholar]
- 39.Zarella MD, Garcia FU, Breen DE. Proceedings of the 9th International Conference on Bioinformatics and Biomedical Technology. Lisbon, Portugal: 2017. A Template Matching Model for Nuclear Segmentation in Digital Images of H&E Stained Slides. [Google Scholar]
- 40.Naik S, Doyle S, Agner S, Madabhushi A, Feldman M, Tomaszewski J. Automated Gland and Nuclei Segmentation for Grading of Prostate and Breast Cancer Histopathology. Paper presented at: Biomedical Imaging: From Nano to Macro, 2008. ISBI 2008. 5th IEEE International Symposium on; 14-17 May. 2008 [Google Scholar]
- 41.Ali S, Madabhushi A. An integrated region-, boundary-, shape-based active contour for multiple object overlap resolution in histological imagery. IEEE Trans Med Imaging. 2012;31:1448–60. doi: 10.1109/TMI.2012.2190089. [DOI] [PubMed] [Google Scholar]
- 42.Jelen L, Fevens T, Krzyzak A. Influence of Nuclei Segmentation on Breast Cancer Malignancy Classification. Paper presented at: SPIE Medical Imaging. 2009 [Google Scholar]
- 43.Gelasca ED, Obara B, Manjunath BS. San Diego, CA: IEEE International Conference on Image Processing; 2008. Evaluation and Benchmark for biological image segmentation. [Google Scholar]
- 44.Hammond ME, Hayes DF, Dowsett M, Allred DC, Hagerty KL, Badve S, et al. American Society of Clinical Oncology/College of American Pathologists Guideline Recommendations for immunohistochemical testing of estrogen and progesterone receptors in breast cancer (unabridged version) Arch Pathol Lab Med. 2010;134:e48–72. doi: 10.5858/134.7.e48. [DOI] [PubMed] [Google Scholar]
- 45.Tamoxifen for early breast cancer: An overview of the randomised trials. Early breast cancer trialists’ collaborative group. Lancet. 1998;351:1451–67. [PubMed] [Google Scholar]
- 46.Stålhammar G, Fuentes Martinez N, Lippert M, Tobin NP, Mølholm I, Kis L, et al. Digital image analysis outperforms manual biomarker assessment in breast cancer. Mod Pathol. 2016;29:318–29. doi: 10.1038/modpathol.2016.34. [DOI] [PubMed] [Google Scholar]
- 47.Lykkegaard Andersen N, Brügmann A, Lelkaitis G, Nielsen S, Friis Lippert M, Vyberg M, et al. Virtual double staining: A digital approach to immunohistochemical quantification of estrogen receptor protein in breast carcinoma specimens. Appl Immunohistochem Mol Morphol. 2018;26:620–6. doi: 10.1097/PAI.0000000000000502. [DOI] [PubMed] [Google Scholar]
- 48.Stålhammar G, Robertson S, Wedlund L, Lippert M, Rantalainen M, Bergh J, et al. Digital image analysis of Ki67 in hot spots is superior to both manual Ki67 and mitotic counts in breast cancer. Histopathology. 2018;72:974–89. doi: 10.1111/his.13452. [DOI] [PubMed] [Google Scholar]
- 49.Ruifrok AC, Katz RL, Johnston DA. Comparison of quantification of histochemical staining by hue-saturation-intensity (HSI) transformation and color-deconvolution. Appl Immunohistochem Mol Morphol. 2003;11:85–91. doi: 10.1097/00129039-200303000-00014. [DOI] [PubMed] [Google Scholar]
- 50.Zarella MD, Heintzelman RC, Popnikolov NK, Garcia FU. BCL-2 expression aids in the immunohistochemical prediction of the oncotype DX breast cancer recurrence score. BMC Clin Pathol 2018. 18 doi: 10.1186/s12907-018-0082-3. 14. doi: 10.1186/s12907-018-0082-3. eCollection 2018. [DOI] [PMC free article] [PubMed] [Google Scholar]
- 51.Flanagan MB, Dabbs DJ, Brufsky AM, Beriwal S, Bhargava R. Histopathologic variables predict oncotype DX recurrence score. Mod Pathol. 2008;21:1255–61. doi: 10.1038/modpathol.2008.54. [DOI] [PubMed] [Google Scholar]
- 52.Clark BZ, Dabbs DJ, Cooper KL, Bhargava R. Impact of progesterone receptor semiquantitative immunohistochemical result on oncotype DX recurrence score: A quality assurance study of 1074 cases. Appl Immunohistochem Mol Morphol. 2013;21:287–91. doi: 10.1097/PAI.0b013e31826f80c9. [DOI] [PubMed] [Google Scholar]
- 53.Romond EH, Perez EA, Bryant J, Suman VJ, Geyer CE, Jr, Davidson NE, et al. Trastuzumab plus adjuvant chemotherapy for operable HER2-positive breast cancer. N Engl J Med. 2005;353:1673–84. doi: 10.1056/NEJMoa052122. [DOI] [PubMed] [Google Scholar]
- 54.Piccart-Gebhart MJ, Procter M, Leyland-Jones B, Goldhirsch A, Untch M, Smith I, et al. Trastuzumab after adjuvant chemotherapy in HER2-positive breast cancer. N Engl J Med. 2005;353:1659–72. doi: 10.1056/NEJMoa052306. [DOI] [PubMed] [Google Scholar]
- 55.Gilcrease MZ, Woodward WA, Nicolas MM, Corley LJ, Fuller GN, Esteva FJ, et al. Even low-level HER2 expression may be associated with worse outcome in node-positive breast cancer. Am J Surg Pathol. 2009;33:759–67. doi: 10.1097/PAS.0b013e31819437f9. [DOI] [PMC free article] [PubMed] [Google Scholar]
- 56.Wolff AC, Hammond ME, Schwartz JN, Hagerty KL, Allred DC, Cote RJ, et al. American Society of Clinical Oncology/College of American Pathologists Guideline recommendations for human epidermal growth factor receptor 2 testing in breast cancer. Arch Pathol Lab Med. 2007;131:18–43. doi: 10.5858/2007-131-18-ASOCCO. [DOI] [PubMed] [Google Scholar]
- 57.Wolff AC, Hammond ME, Hicks DG, Dowsett M, McShane LM, Allison KH, et al. Recommendations for human epidermal growth factor receptor 2 testing in breast cancer: American society of clinical oncology/College of american pathologists clinical practice guideline update. J Clin Oncol. 2013;31:3997–4013. doi: 10.1200/JCO.2013.50.9984. [DOI] [PubMed] [Google Scholar]
- 58.Wolff AC, Hammond ME, Allison KH, Harvey BE, Mangu PB, Bartlett JM, et al. Human epidermal growth factor receptor 2 testing in breast cancer: American Society of Clinical Oncology/College of American Pathologists Clinical Practice Guideline Focused Update. J Clin Oncol. 2018;36:2105–22. doi: 10.1200/JCO.2018.77.8738. [DOI] [PubMed] [Google Scholar]
- 59.Reck M, Rodríguez-Abreu D, Robinson AG, Hui R, Csőszi T, Fülöp A, et al. Pembrolizumab versus chemotherapy for PD-L1-positive non-small-cell lung cancer. N Engl J Med. 2016;375:1823–33. doi: 10.1056/NEJMoa1606774. [DOI] [PubMed] [Google Scholar]
- 60.Aguiar PN, Jr, Santoro IL, Tadokoro H, de Lima Lopes G, Filardi BA, Oliveira P, et al. Apooled analysis of nivolumab for the treatment of advanced non-small-cell lung cancer and the role of PD-L1 as a predictive biomarker. Immunotherapy. 2016;8:1011–9. doi: 10.2217/imt-2016-0032. [DOI] [PubMed] [Google Scholar]
- 61.Keytruda. Pathologist's Guide to PD-L1 Testing in NSCLC. [Last accessed on 2018 Aug 01]. Available from: https://www.keytruda.com/static/pdf/ pathologist-guide-to-pd-l1-testing-in-advanced-nsclc.pdf .
- 62.Kuenen-Boumeester V, Hop WC, Blonk DI, Boon ME. Prognostic scoring using cytomorphometry and lymph node status of patients with breast carcinoma. Eur J Cancer Clin Oncol. 1984;20:337–45. doi: 10.1016/0277-5379(84)90079-8. [DOI] [PubMed] [Google Scholar]
- 63.Larsimont D, Kiss R, d’Olne D, de Launoit Y, Mattheiem W, Paridaens R, et al. Correlation between nuclear cytomorphometric parameters and estrogen receptor levels in breast cancer. Cancer. 1989;63:2162–8. doi: 10.1002/1097-0142(19890601)63:11<2162::aid-cncr2820631116>3.0.co;2-j. [DOI] [PubMed] [Google Scholar]
- 64.Aaltomaa S, Lipponen P, Eskelinen M, Kosma VM, Marin S, Alhava E, et al. The significance of nuclear morphometric variables as prognostic predictors in breast cancer. Anticancer Res. 1991;11:1663–9. [PubMed] [Google Scholar]
- 65.Pienta KJ, Coffey DS. Correlation of nuclear morphometry with progression of breast cancer. Cancer. 1991;68:2012–6. doi: 10.1002/1097-0142(19911101)68:9<2012::aid-cncr2820680928>3.0.co;2-c. [DOI] [PubMed] [Google Scholar]
- 66.Baak JP, Van Dop H, Kurver PH, Hermans J. The value of morphometry to classic prognosticators in breast cancer. Cancer. 1985;56:374–82. doi: 10.1002/1097-0142(19850715)56:2<374::aid-cncr2820560229>3.0.co;2-9. [DOI] [PubMed] [Google Scholar]
- 67.Baak JP, Kurver PH, De Snoo-Niewlaat AJ, De Graef S, Makkink B, Boon ME, et al. Prognostic indicators in breast cancer – Morphometric methods. Histopathology. 1982;6:327–39. doi: 10.1111/j.1365-2559.1982.tb02727.x. [DOI] [PubMed] [Google Scholar]
- 68.Zarella MD, Breen DE, Reza A, Milutinovic A, Garcia FU. Lymph node metastasis status in breast carcinoma can be predicted via image analysis of tumor histology. Anal Quant Cytopathol Histpathol. 2015;37:273–85. [PubMed] [Google Scholar]
- 69.Whitney J, Corredor G, Janowczyk A, Ganesan S, Doyle S, Tomaszewski J, et al. Quantitative nuclear histomorphometry predicts oncotype DX risk categories for early stage ER+ breast cancer. BMC Cancer. 2018;18:610. doi: 10.1186/s12885-018-4448-9. [DOI] [PMC free article] [PubMed] [Google Scholar]
- 70.Kashyap A, Jain M, Shukla S, Andley M. Study of nuclear morphometry on cytology specimens of benign and malignant breast lesions: A study of 122 cases. J Cytol. 2017;34:10–5. doi: 10.4103/0970-9371.197591. [DOI] [PMC free article] [PubMed] [Google Scholar]
- 71.Lu C, Romo-Bucheli D, Wang X, Janowczyk A, Ganesan S, Gilmore H, et al. Nuclear shape and orientation features from H&E images predict survival in early-stage estrogen receptor-positive breast cancers. Lab Invest. 2018;98:1438–48. doi: 10.1038/s41374-018-0095-7. [DOI] [PMC free article] [PubMed] [Google Scholar]
- 72.Veta M, van Diest PJ, Willems SM, Wang H, Madabhushi A, Cruz-Roa A, et al. Assessment of algorithms for mitosis detection in breast cancer histopathology images. Med Image Anal. 2015;20:237–48. doi: 10.1016/j.media.2014.11.010. [DOI] [PubMed] [Google Scholar]
- 73.Sethi A, Sha L, Vahadane AR, Deaton RJ, Kumar N, Macias V, et al. Empirical comparison of color normalization methods for epithelial-stromal classification in H and E images. J Pathol Inform. 2016;7:17. doi: 10.4103/2153-3539.179984. [DOI] [PMC free article] [PubMed] [Google Scholar]
- 74.Bautista PA, Hashimoto N, Yagi Y. Color standardization in whole slide imaging using a color calibration slide. J Pathol Inform. 2014;5:4. doi: 10.4103/2153-3539.126153. [DOI] [PMC free article] [PubMed] [Google Scholar]
- 75.Kayser K, Görtler J, Metze K, Goldmann T, Vollmer E, Mireskandari M, et al. How to measure image quality in tissue-based diagnosis (diagnostic surgical pathology) Diagn Pathol. 2008;3(Suppl 1):S11. doi: 10.1186/1746-1596-3-S1-S11. [DOI] [PMC free article] [PubMed] [Google Scholar]
- 76.Macenko M, Niethammer M, Marron JS, Borland D, Woosley JT, Xiaojun G, et al. A Method for Normalizing Histology Slides for Quantitative Analysis. Paper presented at: 2009 IEEE International Symposium on Biomedical Imaging: From Nano to Macro. 2009 Jun 28; [Google Scholar]
- 77.Tani S, Fukunaga Y, Shimizu S, Fukunishi M, Ishii K, Tamiya K, et al. Color standardization method and system for whole slide imaging based on spectral sensing. Anal Cell Pathol (Amst) 2012;35:107–15. doi: 10.3233/ACP-2011-0037. [DOI] [PMC free article] [PubMed] [Google Scholar]
- 78.Ruifrok AC, Johnston DA. Quantification of histochemical staining by color deconvolution. Anal Quant Cytol Histol. 2001;23:291–9. [PubMed] [Google Scholar]
- 79.Khan AM, Rajpoot N, Treanor D, Magee D. A nonlinear mapping approach to stain normalization in digital histopathology images using image-specific color deconvolution. IEEE Trans Biomed Eng. 2014;61:1729–38. doi: 10.1109/TBME.2014.2303294. [DOI] [PubMed] [Google Scholar]
- 80.Zarella MD, Yeoh C, Breen DE, Garcia FU. An alternative reference space for H&E color normalization. PLoS One. 2017;12:e0174489. doi: 10.1371/journal.pone.0174489. [DOI] [PMC free article] [PubMed] [Google Scholar]
- 81.Bejnordi BE, Litjens G, Timofeeva N, Otte-Höller I, Homeyer A, Karssemeijer N, et al. Stain specific standardization of whole-slide histopathological images. IEEE Trans Med Imaging. 2016;35:404–15. doi: 10.1109/TMI.2015.2476509. [DOI] [PubMed] [Google Scholar]
- 82.Vahadane A, Peng T, Sethi A, Albarqouni S, Wang L, Baust M, et al. Structure-preserving color normalization and sparse stain separation for histological images. IEEE Trans Med Imaging. 2016;35:1962–71. doi: 10.1109/TMI.2016.2529665. [DOI] [PubMed] [Google Scholar]
- 83.Wild R, Ramakrishnan S, Sedgewick J, Griffioen AW. Quantitative assessment of angiogenesis and tumor vessel architecture by computer-assisted digital image analysis: Effects of VEGF-toxin conjugate on tumor microvessel density. Microvasc Res. 2000;59:368–76. doi: 10.1006/mvre.1999.2233. [DOI] [PubMed] [Google Scholar]
- 84.Webster JD, Dunstan RW. Whole-slide imaging and automated image analysis: Considerations and opportunities in the practice of pathology. Vet Pathol. 2014;51:211–23. doi: 10.1177/0300985813503570. [DOI] [PubMed] [Google Scholar]
- 85.Potts SJ, Krueger JS, Landis ND, Eberhard DA, Young GD, Schmechel SC, et al. Evaluating tumor heterogeneity in immunohistochemistry-stained breast cancer tissue. Lab Invest. 2012;92:1342–57. doi: 10.1038/labinvest.2012.91. [DOI] [PubMed] [Google Scholar]
- 86.Pagès F, Mlecnik B, Marliot F, Bindea G, Ou FS, Bifulco C, et al. International validation of the consensus immunoscore for the classification of colon cancer: A prognostic and accuracy study. Lancet. 2018;391:2128–39. doi: 10.1016/S0140-6736(18)30789-X. [DOI] [PubMed] [Google Scholar]
- 87.Brown DL. Bias in image analysis and its solution: Unbiased stereology. J Toxicol Pathol. 2017;30:183–91. doi: 10.1293/tox.2017-0013. [DOI] [PMC free article] [PubMed] [Google Scholar]
- 88.Fónyad L, Shinoda K, Farkash EA, Groher M, Sebastian DP, Szász AM, et al. 3-dimensional digital reconstruction of the murine coronary system for the evaluation of chronic allograft vasculopathy. Diagn Pathol. 2015;10:16. doi: 10.1186/s13000-015-0248-6. [DOI] [PMC free article] [PubMed] [Google Scholar]
- 89.Mendis-Handagama SM. Estimation error of leydig cell numbers in atrophied rat testes due to the assumption of spherical nuclei. J Microsc. 1992;168:25–32. doi: 10.1111/j.1365-2818.1992.tb03247.x. [DOI] [PubMed] [Google Scholar]
- 90.Gundersen HJ. Stereology of arbitrary particles. A review of unbiased number and size estimators and the presentation of some new ones, in memory of william R. Thompson. J Microsc. 1986;143:3–45. [PubMed] [Google Scholar]
- 91.Dorph-Petersen KA, Lewis DA. Stereological approaches to identifying neuropathology in psychosis. Biol Psychiatry. 2011;69:113–26. doi: 10.1016/j.biopsych.2010.04.030. [DOI] [PMC free article] [PubMed] [Google Scholar]
- 92.Gundersen HJ, Bendtsen TF, Korbo L, Marcussen N, Møller A, Nielsen K, et al. Some new, simple and efficient stereological methods and their use in pathological research and diagnosis. APMIS. 1988;96:379–94. doi: 10.1111/j.1699-0463.1988.tb05320.x. [DOI] [PubMed] [Google Scholar]
- 93.Mattfeldt T, Mall G, Gharehbaghi H, Möller P. Estimation of surface area and length with the orientator. J Microsc. 1990;159:301–17. doi: 10.1111/j.1365-2818.1990.tb03036.x. [DOI] [PubMed] [Google Scholar]
- 94.Reed MG, Howard CV, DE Yanés GS. One-stop stereology: The estimation of 3D parameters using isotropic rulers. J Microsc. 2010;239:54–65. doi: 10.1111/j.1365-2818.2009.03356.x. [DOI] [PubMed] [Google Scholar]
- 95.Ameisen D, Deroulers C, Perrier V, Bouhidel F, Battistella M, Legrès L, et al. Towards Better Digital Pathology Workflows: Programming Libraries for High-Speed Sharpness Assessment of Whole Slide Images. Paper presented at: Diagnostic Pathology. 2014 doi: 10.1186/1746-1596-9-S1-S3. [DOI] [PMC free article] [PubMed] [Google Scholar]
- 96.Shakeri SM, Hulsken B, van Vliet LJ, Stallinga S. Optical quality assessment of whole slide imaging systems for digital pathology. Opt Express. 2015;23:1319–36. doi: 10.1364/OE.23.001319. [DOI] [PubMed] [Google Scholar]
- 97.Dunstan RW, Wharton KA Jr, Quigley C, Lowe A. The use of immunohistochemistry for biomarker assessment – Can it compete with other technologies? Toxicol Pathol. 2011;39:988–1002. doi: 10.1177/0192623311419163. [DOI] [PubMed] [Google Scholar]
- 98.Potts SJ, Young GD, Voelker FA. The role and impact of quantitative discovery pathology. Drug Discov Today. 2010;15:943–50. doi: 10.1016/j.drudis.2010.09.001. [DOI] [PubMed] [Google Scholar]
- 99.Weigelt B, Reis-Filho JS. Molecular profiling currently offers no more than tumour morphology and basic immunohistochemistry. Breast Cancer Res. 2010;12(Suppl 4):S5. doi: 10.1186/bcr2734. [DOI] [PMC free article] [PubMed] [Google Scholar]
- 100.Hughes AJ, Mornin JD, Biswas SK, Beck LE, Bauer DP, Raj A, et al. Quanti.us: A tool for rapid, flexible, crowd-based annotation of images. Nat Methods. 2018;15:587–90. doi: 10.1038/s41592-018-0069-0. [DOI] [PMC free article] [PubMed] [Google Scholar]
- 101.Webster JD, Simpson ER, Michalowski AM, Hoover SB, Simpson RM. Quantifying histological features of cancer biospecimens for biobanking quality assurance using automated morphometric pattern recognition image analysis algorithms. J Biomol Tech. 2011;22:108–18. [PMC free article] [PubMed] [Google Scholar]
- 102.Tadrous PJ. On the concept of objectivity in digital image analysis in pathology. Pathology. 2010;42:207–11. doi: 10.3109/00313021003641758. [DOI] [PubMed] [Google Scholar]
- 103.Park SH, Han K. Methodologic guide for evaluating clinical performance and effect of artificial intelligence technology for medical diagnosis and prediction. Radiology. 2018;286:800–9. doi: 10.1148/radiol.2017171920. [DOI] [PubMed] [Google Scholar]
- 104.Wu JC, Halter M, Kacker RN, Elliott JT, Plant AL. A novel measure and significance testing in data analysis of cell image segmentation. BMC Bioinformatics. 2017;18:168. doi: 10.1186/s12859-017-1527-x. [DOI] [PMC free article] [PubMed] [Google Scholar]
- 105.Weese J, Lorenz C. Four challenges in medical image analysis from an industrial perspective. Med Image Anal. 2016;33:44–9. doi: 10.1016/j.media.2016.06.023. [DOI] [PubMed] [Google Scholar]
- 106.Aeffner F, Adissu HA, Boyle MC, Cardiff RD, Hagendorn E, Hoenerhoff MJ, et al. Digital microscopy, image analysis, and virtual slide repository. ILAR J. 2018 doi: 10.1093/ilar/ily007. doi: 10.1093/ilar/ily007. [Epub ahead of print] [DOI] [PMC free article] [PubMed] [Google Scholar]
- 107.NEQAS U. United Kingdom National External Quality Assessment System. [Last accessed on 2018 Oct 06]. Available from: https://www.ukneqas.org.uk/
- 108.IQNPath. International Quality Network for Pathology. [Last accessed on 2018 Oct 06]. Available from: http://www.iqnpath.org/
- 109.Bini SA. Artificial intelligence, machine learning, deep learning, and cognitive computing: What do these terms mean and how will they impact health care? J Arthroplasty. 2018;33:2358–61. doi: 10.1016/j.arth.2018.02.067. [DOI] [PubMed] [Google Scholar]
- 110.Lewis-Kraus G. The great AI awakening. N Y Times Mag. 2016. [Last accessed on 2019 Feb 02]. Available from: https://www.nytimes.com/2016/12/14/magazine/thegreat- ai-awakening.html .
- 111.Nilsson NJ, Nilsson NJ. New York City: NY: Elsevier Science; 1998. Artificial Intelligence: A New Synthesis. [Google Scholar]
- 112.Handelman GS, Kok HK, Chandra RV, Razavi AH, Lee MJ, Asadi H, et al. EDoctor: Machine learning and the future of medicine. J Intern Med. 2018;284:603–19. doi: 10.1111/joim.12822. [DOI] [PubMed] [Google Scholar]
- 113.Ching T, Himmelstein DS, Beaulieu-Jones BK, Kalinin AA, Do BT, Way GP, et al. Opportunities and obstacles for deep learning in biology and medicine. J R Soc Interface 2018. 15 doi: 10.1098/rsif.2017.0387. pii: 20170387. [DOI] [PMC free article] [PubMed] [Google Scholar]
- 114.Khosravi P, Kazemi E, Imielinski M, Elemento O, Hajirasouliha I. Deep convolutional neural networks enable discrimination of heterogeneous digital pathology images. EBioMedicine. 2018;27:317–28. doi: 10.1016/j.ebiom.2017.12.026. [DOI] [PMC free article] [PubMed] [Google Scholar]
- 115.Litjens G, Sánchez CI, Timofeeva N, Hermsen M, Nagtegaal I, Kovacs I, et al. Deep learning as a tool for increased accuracy and efficiency of histopathological diagnosis. Sci Rep. 2016;6:26286. doi: 10.1038/srep26286. [DOI] [PMC free article] [PubMed] [Google Scholar]
- 116.Komura D, Ishikawa S. Machine learning methods for histopathological image analysis. Comput Struct Biotechnol J. 2018;16:34–42. doi: 10.1016/j.csbj.2018.01.001. [DOI] [PMC free article] [PubMed] [Google Scholar]
- 117.Pivetta T, Isaia F, Trudu F, Pani A, Manca M, Perra D, et al. Development and validation of a general approach to predict and quantify the synergism of anti-cancer drugs using experimental design and artificial neural networks. Talanta. 2013;115:84–93. doi: 10.1016/j.talanta.2013.04.031. [DOI] [PubMed] [Google Scholar]
- 118.Agatonovic-Kustrin S, Beresford R. Basic concepts of artificial neural network (ANN) modeling and its application in pharmaceutical research. J Pharm Biomed Anal. 2000;22:717–27. doi: 10.1016/s0731-7085(99)00272-1. [DOI] [PubMed] [Google Scholar]
- 119.Dande P, Samant P. Acquaintance to artificial neural networks and use of artificial intelligence as a diagnostic tool for tuberculosis: A review. Tuberculosis (Edinb) 2018;108:1–9. doi: 10.1016/j.tube.2017.09.006. [DOI] [PubMed] [Google Scholar]
- 120.Cireşan D, Meier U, Schmidhuber J. Multi-column deep neural networks for image classification. 2012 doi: 10.1016/j.neunet.2012.02.023. arXiv preprint arXiv: 12022745. [DOI] [PubMed] [Google Scholar]
- 121.Fuchs TJ, Wild PJ, Moch H, Buhmann JM. Computational pathology analysis of tissue microarrays predicts survival of renal clear cell carcinoma patients. Med Image Comput Comput Assist Interv. 2008;11:1–8. doi: 10.1007/978-3-540-85990-1_1. [DOI] [PubMed] [Google Scholar]
- 122.Shu C. Zebra Medical Vision gets $30M Series C to create AI-based tools for radiologists. TechCrunch 2018. 2018. [Last accessed on 2019 Feb 02]. Available from: https:// techcrunch.com/2018/06/07/zebra-medical-vision-gets-30m-series-c-tocreate- ai-based-tools-for-radiologists/
- 123.Janowczyk A, Madabhushi A. Deep learning for digital pathology image analysis: A comprehensive tutorial with selected use cases. J Pathol Inform. 2016;7:29. doi: 10.4103/2153-3539.186902. [DOI] [PMC free article] [PubMed] [Google Scholar]
- 124.Lambin P, Leijenaar RTH, Deist TM, Peerlings J, de Jong EEC, van Timmeren J, et al. Radiomics: The bridge between medical imaging and personalized medicine. Nat Rev Clin Oncol. 2017;14:749–62. doi: 10.1038/nrclinonc.2017.141. [DOI] [PubMed] [Google Scholar]
- 125.Ganesan S, Madabhushi A, Basavanhally A, Xu J, Bhanot G, Barnard N, et al. Computerized histologic image-based risk score (IbRiS) classifier for ER+ breast cancer. Cancer Research. 2009. [Last accessed on 2019 Feb 02]. Available from: http://cancerres.aacrjournals.org/content/69/24_ Supplement/3046 .
- 126.LeCun Y, Bengio Y, Hinton G. Deep learning. Nature. 2015;521:436–44. doi: 10.1038/nature14539. [DOI] [PubMed] [Google Scholar]
- 127.Farahani N, Liu Z, Jutt D, Fine JL. Pathologists’ computer-assisted diagnosis: A Mock-up of a prototype information system to facilitate automation of pathology sign-out. Arch Pathol Lab Med. 2017;141:1413–20. doi: 10.5858/arpa.2016-0214-OA. [DOI] [PubMed] [Google Scholar]
- 128.Bándi P, Geessink O, Manson Q, van Dijk M, Balkenhol M, Hermsen M, et al. From detection of individual metastases to classification of lymph node status at the patient level: The CAMELYON17 challenge. IEEE Transactions on Medical Imaging. [Last accessed on 2019 Feb 02];EEE Transactions on Medical Imaging. 2018 38:550–60. doi: 10.1109/TMI.2018.2867350. Available from: https://ieeexplore.ieee.org/document/8447230 . [DOI] [PubMed] [Google Scholar]
- 129.Healey MA, Hirko KA, Beck AH, Collins LC, Schnitt SJ, Eliassen AH, et al. Assessment of ki67 expression for breast cancer subtype classification and prognosis in the nurses’ health study. Breast Cancer Res Treat. 2017;166:613–22. doi: 10.1007/s10549-017-4421-3. [DOI] [PMC free article] [PubMed] [Google Scholar]
- 130.Stålhammar G, Robertson S, Wedlund L, Lippert M, Rantalainen M, Bergh J, et al. Digital image analysis of Ki67 in hot spots is superior to both manual Ki67 and mitotic counts in breast cancer? Histopathology. 2018;72:974–89. doi: 10.1111/his.13452. Doi: 10.1111/his.13452. [DOI] [PubMed] [Google Scholar]
- 131.Wang W, Ozolek JA, Rohde GK. Detection and classification of thyroid follicular lesions based on nuclear structure from histopathology images. Cytometry A. 2010;77:485–94. doi: 10.1002/cyto.a.20853. [DOI] [PMC free article] [PubMed] [Google Scholar]
- 132.He L, Long LR, Antani S, Thoma GR. Histology image analysis for carcinoma detection and grading. Comput Methods Programs Biomed. 2012;107:538–56. doi: 10.1016/j.cmpb.2011.12.007. [DOI] [PMC free article] [PubMed] [Google Scholar]
- 133.Mohammed EA, Mohamed MM, Far BH, Naugler C. Peripheral blood smear image analysis: A comprehensive review. J Pathol Inform. 2014;5:9. doi: 10.4103/2153-3539.129442. [DOI] [PMC free article] [PubMed] [Google Scholar]
- 134.Bui M, Stephenson C. Laboratory Administration for Pathologists. Association of Clinical Scientists. 2013 [Google Scholar]
- 135.Administration TFaD. The Food and Drug Administration. 2018. [Last accessed on 2018 Mar 09]. Available from: http://www.fda.gov .
- 136.Baruch HR, Hassan W, Mehta S. Eight Steps to Method Validation in a Clinical Diagnostic Laboratory. American Society for Clinical Laboratory Science. 2018 [Google Scholar]
- 137.Bui MM, Riben MW, Allison KH, Chlipala E, Colasacco C, Kahn AG, et al. Quantitative Image Analysis of Human Epidermal Growth Factor Receptor 2 Immunohistochemistry for Breast Cancer: Guideline From the College of American Pathologists. Arch Pathol Lab Med. 2019 doi: 10.5858/arpa.2018-0378-CP. Doi: 10.5858/arpa.2018-0378-CP. [DOI] [PMC free article] [PubMed] [Google Scholar]
- 138.Skacel M, Skilton B, Pettay JD, Tubbs RR. Tissue microarrays: A powerful tool for high-throughput analysis of clinical specimens: A review of the method with validation data. Appl Immunohistochem Mol Morphol. 2002;10:1–6. doi: 10.1097/00129039-200203000-00001. [DOI] [PubMed] [Google Scholar]
- 139.Steele KE, Tan TH, Korn R, Dacosta K, Brown C, Kuziora M, et al. Measuring multiple parameters of CD8+tumor-infiltrating lymphocytes in human cancers by image analysis. J Immunother Cancer. 2018;6:20. doi: 10.1186/s40425-018-0326-x. [DOI] [PMC free article] [PubMed] [Google Scholar]
- 140.Bankhead P, Loughrey MB, Fernández JA, Dombrowski Y, McArt DG, Dunne PD, et al. QuPath: Open source software for digital pathology image analysis. Sci Rep. 2017;7:16878. doi: 10.1038/s41598-017-17204-5. [DOI] [PMC free article] [PubMed] [Google Scholar]
- 141.Lewis JT, Ketterling RP, Halling KC, Reynolds C, Jenkins RB, Visscher DW, et al. Analysis of intratumoral heterogeneity and amplification status in breast carcinomas with equivocal (2+) HER-2 immunostaining. Am J Clin Pathol. 2005;124:273–81. doi: 10.1309/J9VX-ABUG-KC4Y-07DL. [DOI] [PubMed] [Google Scholar]
- 142.Seol H, Lee HJ, Choi Y, Lee HE, Kim YJ, Kim JH, et al. Intratumoral heterogeneity of HER2 gene amplification in breast cancer: Its clinicopathological significance. Mod Pathol. 2012;25:938–48. doi: 10.1038/modpathol.2012.36. [DOI] [PubMed] [Google Scholar]
- 143.Ghaznavi F, Evans A, Madabhushi A, Feldman M. Digital imaging in pathology: Whole-slide imaging and beyond. Annu Rev Pathol. 2013;8:331–59. doi: 10.1146/annurev-pathol-011811-120902. [DOI] [PubMed] [Google Scholar]
- 144.Butler AE, Campbell-Thompson M, Gurlo T, Dawson DW, Atkinson M, Butler PC, et al. Marked expansion of exocrine and endocrine pancreas with incretin therapy in humans with increased exocrine pancreas dysplasia and the potential for glucagon-producing neuroendocrine tumors. Diabetes. 2013;62:2595–604. doi: 10.2337/db12-1686. [DOI] [PMC free article] [PubMed] [Google Scholar]
- 145.Forest T, Holder D, Smith A, Cunningham C, Yao X, Dey M, et al. Characterization of the exocrine pancreas in the male zucker diabetic fatty rat model of type 2 diabetes mellitus following 3 months of treatment with sitagliptin. Endocrinology. 2014;155:783–92. doi: 10.1210/en.2013-1781. [DOI] [PubMed] [Google Scholar]
- 146.Golson ML, Bush WS, Brissova M. Automated quantification of pancreatic β-cell mass. Am J Physiol Endocrinol Metab. 2014;306:E1460–7. doi: 10.1152/ajpendo.00591.2013. [DOI] [PMC free article] [PubMed] [Google Scholar]
- 147.Chakrabarty P, Ceballos-Diaz C, Beccard A, Janus C, Dickson D, Golde TE, et al. IFN-gamma promotes complement expression and attenuates amyloid plaque deposition in amyloid beta precursor protein transgenic mice. J Immunol. 2010;184:5333–43. doi: 10.4049/jimmunol.0903382. [DOI] [PMC free article] [PubMed] [Google Scholar]
- 148.Villarreal S, Zhao F, Hyde LA, Holder D, Forest T, Sondey M, et al. Chronic verubecestat treatment suppresses amyloid accumulation in advanced aged tg2576-aβPPswe mice without inducing microhemorrhage. J Alzheimers Dis. 2017;59:1393–413. doi: 10.3233/JAD-170056. [DOI] [PMC free article] [PubMed] [Google Scholar]
- 149.Villarreal SA, Wu Z, Gray A, Shughrue PJ. Evaluation of amyloid plaque in an Alzheimer's disease mouse model with the use of stereological versus aperio analysis. J Histotechnol. 2010;33:161–4. [Google Scholar]
- 150.Karumuthil-Melethil S, Marshall MS, Heindel C, Jakubauskas B, Bongarzone ER, Gray SJ, et al. Intrathecal administration of AAV/GALC vectors in 10-11-day-old twitcher mice improves survival and is enhanced by bone marrow transplant. J Neurosci Res. 2016;94:1138–51. doi: 10.1002/jnr.23882. [DOI] [PMC free article] [PubMed] [Google Scholar]
- 151.Varghese F, Bukhari AB, Malhotra R, De A. IHC profiler: An open source plugin for the quantitative evaluation and automated scoring of immunohistochemistry images of human tissue samples. PLoS One. 2014;9:e96801. doi: 10.1371/journal.pone.0096801. [DOI] [PMC free article] [PubMed] [Google Scholar]
- 152.Carpenter AE, Kamentsky L, Eliceiri KW. A call for bioimaging software usability. Nat Methods. 2012;9:666–70. doi: 10.1038/nmeth.2073. [DOI] [PMC free article] [PubMed] [Google Scholar]
- 153.Wiesmann V, Franz D, Held C, Münzenmayer C, Palmisano R, Wittenberg T, et al. Review of free software tools for image analysis of fluorescence cell micrographs. J Microsc. 2015;257:39–53. doi: 10.1111/jmi.12184. [DOI] [PubMed] [Google Scholar]
- 154.Vonnegut S. Open Source vs. Commercial Tools: Static Code Analysis Showdown . Vol. 2018. Checkmarx. 2015 [Google Scholar]