Abstract
Introduction:
Use of synchrotron radiation (SR) X-ray source in medical imaging has shown great potential for improving soft-tissue image contrast such as the breast. The present study demonstrates quantitative X-ray phase-contrast imaging (XPCI) technique derived from propagation-dependent phase change observed in the breast tissue-equivalent test materials.
Materials and Methods:
Indian synchrotron facility (Indus-2, Raja Ramanna Centre of Advanced Technology [RRCAT]) was used to carry out phantom feasibility study on phase-contrast mammography. Different phantoms and samples, including locally fabricated breast tissue-equivalent phantoms were used to perform absorption and phase mode imaging using 12 and 16 keV SR X-ray beam. Edge-enhancement index (EEI) and edge enhancement to noise ratio (EE/N) were measured for all the images. Absorbed dose to air values were calculated for 12 and 16 keV SR X-ray beam using the measured SR X-ray photon flux at the object plane and by applying the standard radiation dosimetry formalism.
Results and Conclusion:
It was observed in case of all the phantoms and test samples that EEI and EE/N values are relatively higher for images taken in the phase mode. The absorbed dose to air at imaging plane was found to be 75.59 mGy and 28.9 mGy for 12 and 16 keV SR energies, respectively. However, these dose values can be optimized by reducing the image acquisition time without compromising the image quality when clinical samples are imaged. This work demonstrates the feasibility of XPCI in mammography using 12 and 16 keV SR X-ray beams.
Keywords: Mammography, phantom, phase contrast, synchrotron radiation, X-ray
INTRODUCTION
In recent years, use of synchrotron radiation (SR) X-ray source is increasing globally in the medical imaging due to the advent of X-ray phase-contrast imaging (XPCI) technology.[1,2,3] XPCI has shown the great potential with respect to visibility contrast improvement while examining soft tissues found within the breast.[4] In medical imaging field, XPCI has been employed by three methods which are propagation, interference, and analyzer based and the present study employs the propagation-based method for producing phase contrast. Propagation-based XPCI technique relies on the principle of refraction of X-rays at the boundary defined by two different density regions. The refracted and direct wave propagates a finite distance and interferes due to a path difference to produce bright and dark fringes. Outcome of this interaction is manifested in terms of edge enhancement along the boundary of interest. Under XPCI technique, an air gap between the object and the detector is established to transform the phase gradients generated by the interference of X-rays having different phase shifts into intensity gradient on the image.[5,6,7] Because of their high-spatial coherence, micro-focus and synchrotron-based X-ray sources are found to be suitable for phase-contrast imaging, whereas conventional X-ray sources are not due to their low-spatial coherence.[8,9,10] Synchrotron X-ray has several characteristics such as spatially coherent, high intensity, vertical collimation, and polarization.[11,12] It is also reported that when a coherent X-ray beam gets scattered in an object it is distributed not only due to attenuation (photoelectric, absorption, and Compton and Rayleigh scatterings) but also due to refraction on the boundaries between media providing better phase-contrast visibility at boundaries.[13]
Several authors have carried out XPCI-based mammography work, and one such XPCI-based mammography study has shown the great improvement in image quality-dose relationship, which was due to monochromaticity and high degree of intrinsic collimation of SR X-ray beam.[14] Another XPCI study performed at 17 keV SR X-rays on Ackermann mammographic phantom and biological specimens obtained at postmortem excision were reported, and outcome of the study has shown the improved image quality with only slightly increased dose compared with those for SR absorption imaging and also with reduced dose when compared with conventional mammography.[15] Another attempt toward XPCI concludes that in the SR X-ray energy range of 15–25 keV, the effects due to phase shift are considerably more relevant than those due to absorption effects for biologic soft tissues.[16]
We have carried out absorption and phase mode imaging studies on various phantoms and samples made up of breast tissue equivalent materials using 12 and 16 keV SR X-ray beam of Indus-2, Raja Ramanna Centre of Advanced Technology (RRCAT), Indore, India (Indian synchrotron facility). Low keV SR X-ray beams were used in this study because phase-contrast signature is up to thousand times higher than absorption contrast for the soft tissue/objects having small-density differences at these energies.[2,17] SR X-ray images of different phantoms and samples were analyzed, and imaging parameters were quantified in terms of edge-enhancement index (EEI) and edge enhancement to noise ratio (EE/N).[18] Dosimetry calculations were also carried out based on the measured SR X-ray flux at different SR X-ray energies and radiation dosimetry formalism.[19,20]
MATERIALS AND METHODS
Propagation-based X-ray phase-contrast imaging
XPCI technique is based on the principle of refraction of X-rays at the boundary defined by two different density regions and the complex index of refraction (n) is given the following equations:
n = 1-δ-iß (1)
where δ is the index decrement that is responsible for the phase shift and ß is the absorption index.[20] The δ and ß components are expressed as
δ = NA (Z/A) ρe2 λ2/(2πmc2) (2)
ß = μλ/4π (3)
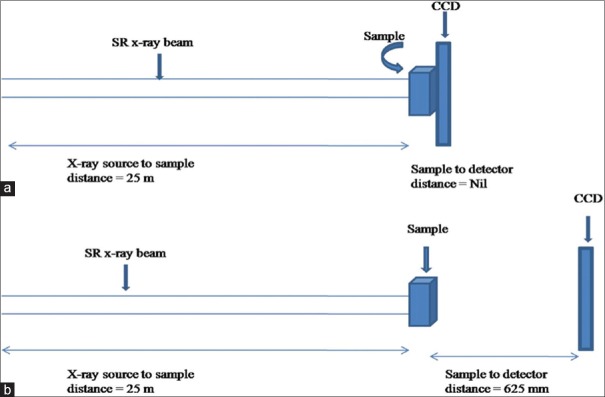
where NA is Avogadro's number (=6.02 × 10²³), Z is atomic number, A is atomic mass, ρ is density (g/cm3) of the medium, e2/(mc2) is classical radius of electron (=2.82 × 10⁻¹³ cm), λ is the wavelength (cm) of X-ray, and μ is the linear attenuation coefficient of the medium. The refractive index decrement δ depends on energy E of the X-ray photons and the density of the object (Equation 2). Term ß is related to linear attenuation coefficient μ and is the basis for image contrast in attenuation-based imaging techniques such as conventional mammography. Figure 1a and b is the schematic diagram of experimental set ups of absorption and phase mode imaging techniques used in this work.
Figure 1.
Schematic diagram of experimental set up utilized to perform synchrotron radiation X-ray imaging of various phantoms/samples under (a) absorption and (b) phase mode
Synchrotron X-ray source
All the experiments were carried out at imaging beam line, BL-4 of the synchrotron facility Indus-2, having a 2.5 GeV, 300 mA third generation SR source located at RRCAT, Indore, India. BL-4 has both monochromatic as well as white beam mode of operation. In monochromatic mode, the energy range covered is 8–35 keV, whereas in white beam mode energy up to 50 keV is available. The maximum beam dimension in the experimental station is 100 mm × 10 mm, and photon flux is ~1010 photons/s in monochromatic mode, whereas it is 1016 photons/s in white beam mode.[20] BL-4 experimental station has all the instruments required to perform various imaging experiments such as phase-contrast X-ray imaging.
Imaging camera system and sample manipulator
In the present study, we have used VHR-1 imaging camera system (Photonic Science, Mountfield, UK) which contains 1:2 fiber optic plate coated with gadolinium oxide scintillator and high-resolution CCD (pixels 4007 × 2678, pixel size 4.5 μm, and field of view 18 mm × 12 mm). The performance of the camera is found to be linear in the energy range 8–50 keV and measured resolution for the fiber optic coupled CCD camera is 5 μm with 8% contrast.[19] BL-4 has high-precision 6-axis sample manipulator stages consisting of X, Y, Z, θ, ψ, and ϕ, and high-precision 3-axis manipulator for X, Y, and Z motions of the detectors. BL-4 also has an ionization chamber for measuring the online beam current and dose monitoring with fast shutter for controlled exposure time in bio-medical imaging. Complete experimental station was placed on vibration-isolated granite table. Images were acquired using a fiber optic coupled CCD camera at 12 and 16 keV SR beam for 620 ms exposure time. In the entire phase mode imaging, source to sample distance was 25 m, and phantom to detector distance was 625 mm which was experimentally optimized condition to achieve the proper phase signature of the various phantoms/sample images as shown in Figure 1.
Image analysis parameters
In XPCI technique, two parameters are defined to quantify the edge effect seen in the image of the object. The first parameter is EEI which quantifies the edge-enhancement effect of a phase mode image.[18] EEI measures the relationship of the edge-enhancement effect relative to the absolute change in intensity form absorption differences across the edge.[18] The EEI is defined as

where P and T are the peak and trough intensity values at the edge as shown in Figure 2a. Intensity values H and L are the result of no edge enhancement at the high- and low-intensity regions next to the edge [Figure 2b].
Figure 2.
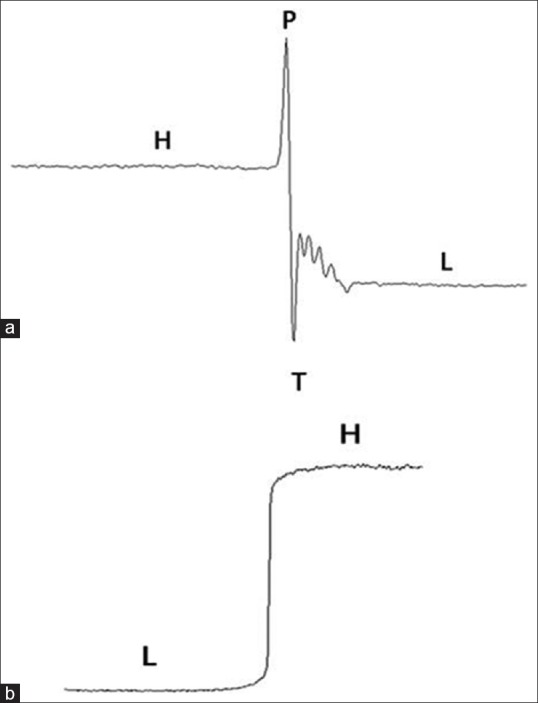
Description of various points for calculating edge-enhancement index and edge enhancement to noise ratio (a) Used to calculate edge-enhancement index and edge enhancement to noise ratio when there is an edge enhancement in the object image (under phase mode imaging) (b) used when there is no edge enhancement seen in the image of an object (absorption mode)
The second parameter is EE/N which measures the edge enhancement relation with image noise and is given by the following equation

where σH and σL are the standard deviations of the pixels used to calculate H and L in the EEI.
Imaging phantoms
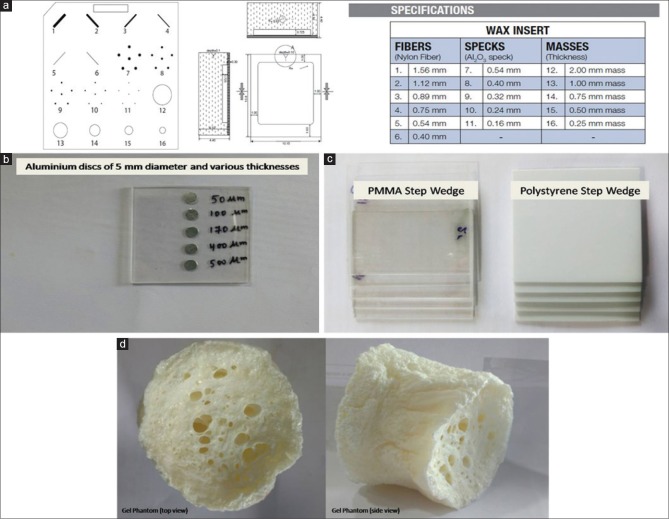
Imaging phantoms are the basis for characterizing any image system. Table 1 lists the details of the phantom/samples of breast tissue-equivalent material and purpose of their selection. Figure 3 shows the construction details and material contents of these phantoms and samples.
Table 1.
Various phantoms and samples used for synchrotron X-ray image analysis
| Phantom/samples | Purpose for selection |
|---|---|
| CIRS mammography imaging phantom (Model 015) | For imaging, various test objects which simulate various breast diseases |
| Aluminum-based microcalcification phantom (locally fabricated) | To simulate microcalcifications found in breast cancer patients |
| PMMA and polystyrene step wedges (locally fabricated) | To simulate thickness variation change within the same tissue types |
| Gel phantom (locally made) | To simulate fibrocystic breast tissues |
CIRS: Computerized imaging reference systems, PMMA: Polymethylmethacrylate
Figure 3.
Schematic of various phantoms and samples (a) wax sheet of mammography imaging phantom with various test objects and their specifications (CIRS model 015) (b) Al discs sample to represent microcalcification (c) poly (methyl methacrylate) and Polystyrene step-wedge phantom (d) top and side view of gel phantom
CIRS mammography imaging phantom
A standard CIRS imaging phantom (model 015) having dimensions of 10.8 cm × 10.2 cm × 4.4 cm was included in this study which is generally used to perform quality-control check on the conventional mammography system (CIRS, Virginia, USA).[21] This model of the CIRS phantom consists of a removable wax sheet of 5-mm thickness and embedded inserts that mimic the anatomic breast structures/artificial features such as fibers, specks to simulate microcalcifications (MCs), and masses. The wax sheet contains six numbers of nylon fibers of different thicknesses ranging from 0.40 to 1.56 mm, five sets of MCs with sizes of 0.16–0.54 mm, and five glandular masses of 0.25–2.00-mm thickness as shown in Figure 3a.
Aluminum-based microcalcification phantom
MCs finding in the breast are considered as indirect signs of pathological process and detecting these on mammograms are difficult due to its small size (<1 mm).[22,23] In conventional mammography, aluminum (Al) is often used as a material for the simulation of calcification.[24,25] In view of this, we have designed and locally fabricated a MC phantom using Al in the form of circular discs with diameter of 5 mm and thickness ranging from 50 to 500 microns. These Al discs were sandwiched between two poly (methyl methacrylate) PMMA sheets each having 1-mm thickness as shown in Figure 3b. SR X-ray images of every Al discs were acquired under absorption and phase mode at 12 and 16 keV.
Poly (methyl methacrylate) and polystyrene step wedges
To simulate thickness variation within the same tissue types, step-wedge samples were fabricated. Although different synthetic materials can be used as breast tissue substitute for making mammography phantoms, we have used PMMA (1.19 g/cm3) and Polystyrene (1.06 g/cm3) as shown in Figure 3c (NIST 2010).[26] Step thickness for these two locally-fabricated step wedges ranges from 1.0 to 5.0 mm. Also at various edges of the steps, a line profile was plotted to compare the EEI and EE/N values under absorption and phase mode. SR X-ray images of these step wedges were analyzed and reported using ImageJ software (Image J).[27]
Gel phantom
In the case of conventional mammography examination, viewing a fibrocystic breast tissue is difficult due to insignificant difference between linear attenuation coefficients of fibrous and tumor tissues in the energy range of 15–26.5 keV.[28] Polymer gel (1.026 g/cm3) exhibits the closet radiological water equivalence, and in view of this, we have used a dried polymer gel phantom [Figure 3d] to study the artificial fibers structure detectability in SR X-ray beam.[29] This phantom was exposed at 12 keV SR X-ray beam in both absorption and phase mode and the results were compared in terms of visual appearance and line plot profile for a small cross-sectional image.
Estimation of absorbed dose to air at object plane
Absorbed dose to air (which is equivalent to air kerma at such a low energy) for the monoenergetic X-ray photon beam with energy E is given by the following relation.[30]
Dair = ϕ E (μen/ρ) (6)
where, ϕ is the incident X-ray photon fluence and μen/ρ is the mass energy-absorption coefficient. It may be noted that in the energy domain of keV X-rays, the linear energy absorption (μen) and energy transfer coefficients (μtr) are considered to be equal.[30,31] In this study, Si-PIN photodiode-based measured values of SR X-ray photon flux and the standard mass energy absorption coefficients were used for estimating the absorbed dose to air.[19,26] Ideally, glandular dose is estimated and mean glandular dose is reported for comparing different clinical mammography systems from the patient dose point of view. However, in this case, it was not possible to measure and report the mean glandular dose, and hence, dose to air at imaging plane was measured and reported.
RESULTS AND DISCUSSION
Image analysis of CIRS wax sheet
Due to small SR X-ray beam size, we have taken the image of each test objects embedded inside the CIRS wax sheet phantom one by one. Finally, these images were analyzed and stitched together to bring out in the form of a single image. Figure 4 shows the images of 16 test objects of CIRS mammography imaging phantom. These images represent the visual image quality of different test objects embedded inside CIRS-wax sheet taken by SR X-ray at 12 and 16 keV energy. Visual analysis of these images was carried out by five different experts, and overall findings of all are reported here. Visual analysis of the SR X-ray image of CIRS wax sheet provides better edge contrast for the fibers, masses, and MCs in the phase mode in comparison to the absorption mode.
Figure 4.
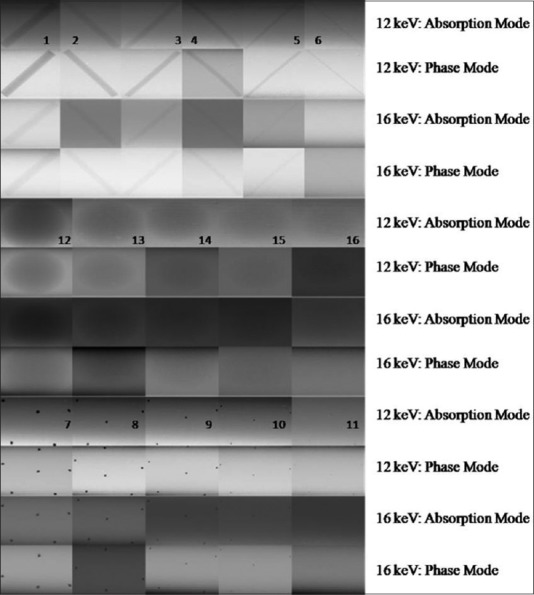
Synchrotron X-ray image of various test objects embedded in CIRS mammography imaging phantom at 12 and 16 keV synchrotron radiation X-ray energies
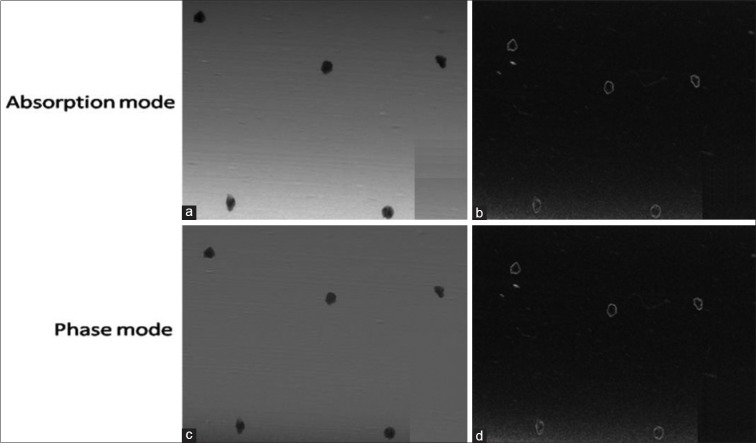
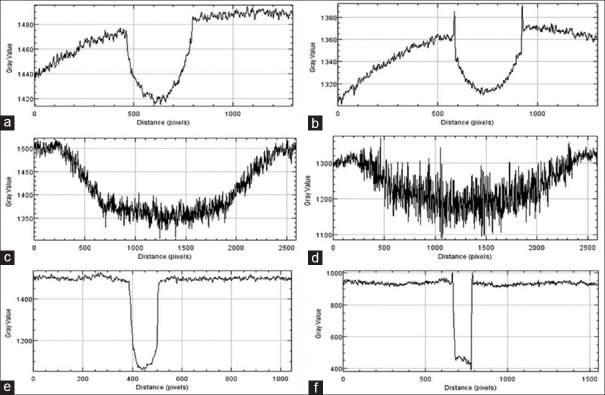
In addition, irregular geometries are also seen in the enlarged view of MCs represented by test object numbers 7–11 [Figure 5] which is generally not possible with the conventional mammography system. Edge enhancement effect was quantified using EEI and EE/N for the larger test objects (e.g., Fiber1, Mass 12 and MC7) only. For this purpose, line profile from the images of these test objects were plotted as shown in Figure 6. Using these profiles, EEI and EE/N were calculated, and average values are shown in Table 2. It is observed that EEI and EE/N values are relatively higher for the phase mode images than the absorption mode images for these test objects.
Figure 5.
Images of microcalcifications represented by test object number 7 of CIRS wax sheet: (a) enlarged view in absorption mode, (b) enlarged view after edge detection processing in absorption mode, (c) enlarged view in phase mode (d) enlarged view after edge detection processing in phase mode
Figure 6.
Line profile from the images of larger test objects (Fiber 1, Mass 12 and MC 7) of CIRS wax sheet: (a) Fiber 1 from absorption mode (b) Fiber 1 from phase mode (c) Mass 12 from absorption mode (d) Mass 12 from phase mode (e) Microcalcification 7 from absorption mode (f) Microcalcification 7 from phase mode
Table 2.
Mean measured edge-enhancement index and edge enhancement to noise ratio values for larger test objects (Fiber 1, Mass 12 and microcalcifications 7) of CIRS wax sheet
| EEI | EE/N | EEI | EE/N | |
|---|---|---|---|---|
| Fiber 1 at 12 keV | Fiber 1 at 16 keV | |||
| Absorption mode | 0.75±0.16 | 3.55±0.12 | 0.79±0.13 | 1.91±0.30 |
| Phase mode | 0.86±0.14 | 3.85±0.09 | 1.35±0.06 | 4.81±0.15 |
| Mass 12 at 12 keV | Mass 12 at 16 keV | |||
| Absorption mode | 0.86±0.11 | 5.2±0.11 | 0.88±0.09 | 5.83±0.12 |
| Phase mode | 1.11±0.08 | 7.5±0.30 | 1.17±0.08 | 8.2±0.16 |
| MC 7 at 12 keV | MC 7 at 16 keV | |||
| Absorption mode | 0.97±0.08 | 12.69±0.18 | 0.93±0.09 | 5.83±0.20 |
| Phase mode | 1.096±0.05 | 15.89±0.10 | 1.17±0.06 | 8.2±0.16 |
MC: Microcalcifications, EEI: Edge-enhancement index, EE/N: Edge enhancement to noise ratio, CIRS: Computerized imaging reference systems
Image analysis of Al-based microcalcification phantom
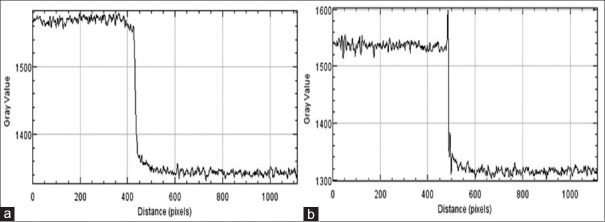
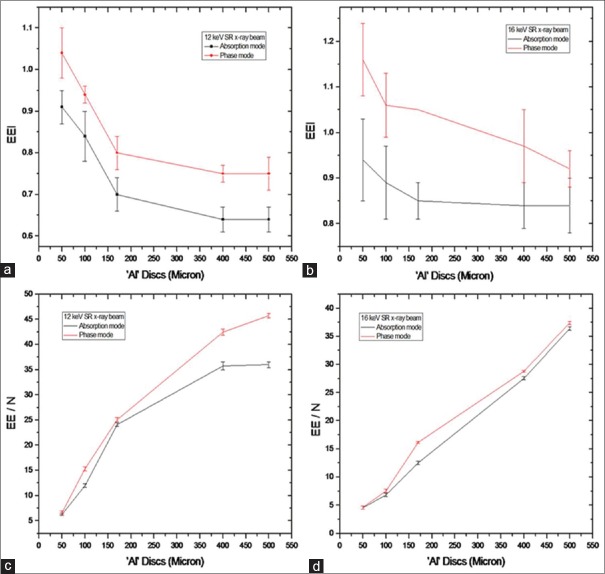
Line profiles were plotted for all the discs of Al-based MC phantom for quantification of image quality in terms of EEI and EE/N. Figure 7 shows the line profile of one of the Al discs plotted from its absorption and phase mode images. EEI and EE/N values were derived for all the five Al discs. Figure 8 shows the variations of EEI and EE/N with respect to thickness of Al discs of MC phantom. The plot includes data from the absorption and phase mode images taken at 12 and 16 keV of SR X-ray energies. It is observed from plots in Figure 8 that EEI and EE/N values are higher for phase mode than absorption mode at both of these SR X-ray energies.
Figure 7.
Plot of line profile for synchrotron radiation X-ray image of ’Al’ disc sample at 16 keV under (a) absorption and (b) phase mode
Figure 8.
Variations of edge-enhancement index and edge enhancement to noise ratio with thickness of Al discs derived from absorption and phase mode: (a) Edge-enhancement index at 12 keV, (b) edge-enhancement index at 16 keV, (c) edge enhancement to noise ratio at 12 keV, and (d) edge enhancement to noise ratio at 16 keV
Image analysis of poly (methyl methacrylate) and Polystyrene step wedges
Figures 9 and 10 present SR X-ray images and the line profiles for PMMA and polystyrene step wedges in absorption and phase modes at 12 and 16 keV energies, respectively. Combined line profiles of absorption and phase modes for the visualization of edge enhancement are shown in these figures. The mean values of EEI and EE/N derived from the lines profiles are given in Table 3 for PMMA and Polystyrene step wedges. The plots and the data show that edge contrast enhancement is relatively higher in-phase mode.
Figure 9.
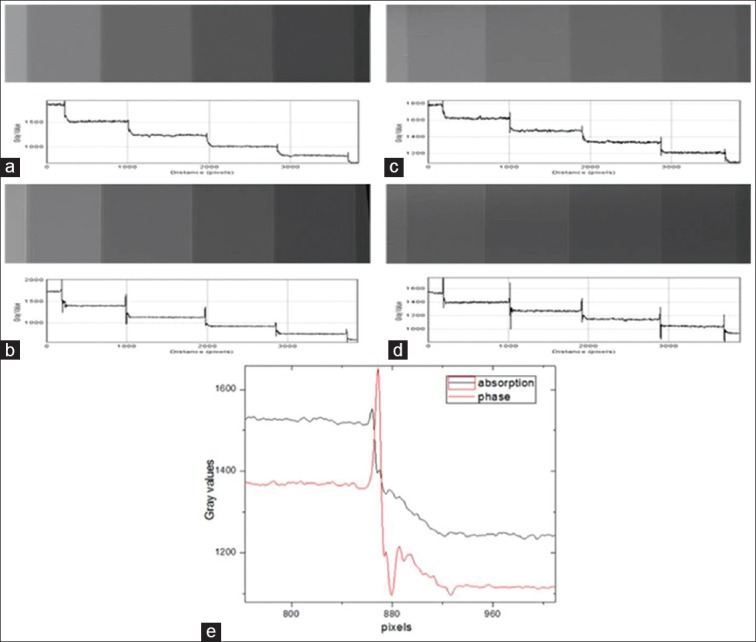
Synchrotron radiation X-ray images and line profiles for poly (methyl methacrylate) step wedge in absorption and phase modes: (a) 12 keV-absorption mode (b) 12 keV-phase mode (c) 16 keV-absorption mode (d) 16 keV-phase mode, and (e) combined line profiles in absorption and phase mode at 12 keV for visualization of edge enhancement
Figure 10.
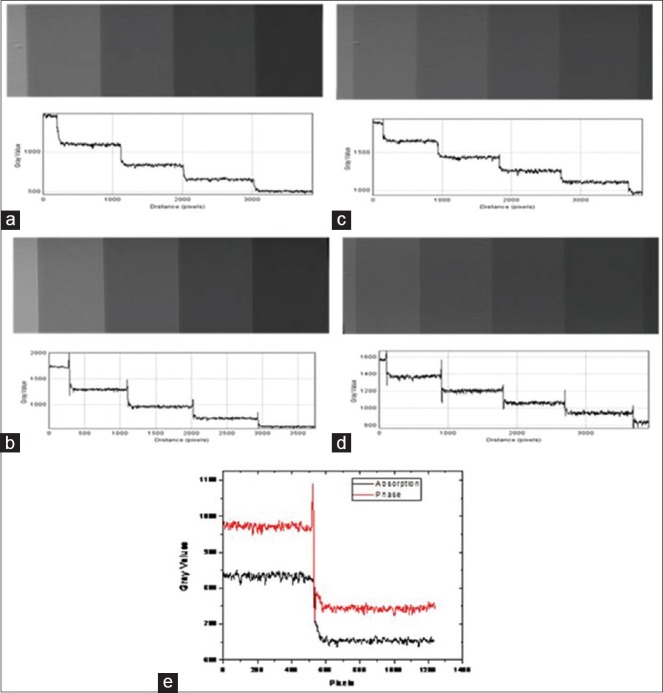
Synchrotron radiation X-ray images and line profiles for Polystyrene step wedge in absorption and phase modes: (a) 12 keV-absorption mode (b) 12 keV-phase mode (c) 16 keV-absorption mode (d) 16 keV-phase mode, and (e) combined line profiles in absorption and phase mode at 12 keV for visualization of edge enhancement
Table 3.
Measured edge-enhancement index and edge enhancement to noise ratio values for step-wedge samples at 12 and 16 keV synchrotron radiation X-ray beam
| Step wedge | 12 keV-EEI | 12 keV-EE/N | ||
|---|---|---|---|---|
| Absorption mode | Phase mode | Absorption mode | Phase mode | |
| PMMA | 0.92±0.17 | 1.64±0.25 | 11.04±2.03 | 25±1.83 |
| Polystyrene | 0.72±0.06 | 1.53±0.31 | 4.54±0.65 | 10.06±3.26 |
| Step wedge | 16 keV-EEI | 16 keV-EE/N | ||
| PMMA | 1.19±0.36 | 3.7±1.11 | 7.73±1.39 | 21.61±2.47 |
| Polystyrene | 0.90±0.10 | 2.49±0.23 | 4.8±1.43 | 11.31±3.04 |
EEI: Edge-enhancement index, EE/N: Edge enhancement to noise ratio, PMMA: Poly (methyl methacrylate)
Image analysis of polymer gel phantom
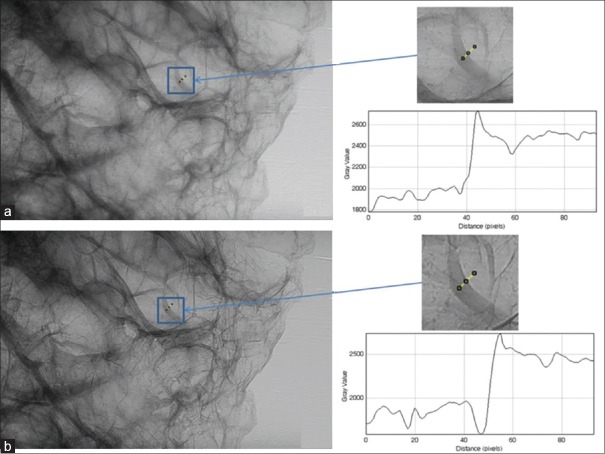
Figure 11 shows absorption and phase mode images of polymer gel phantom and line profiles of a small region of interest from the images. EEI and EE/N were derived from these line profiles and the mean values are shown in Table 4. Both visual inspection and the quantitative values of EEI and EE/N indicate better image quality (e.g., visualization of fibers) of polymer gel phantom in-phase mode.
Figure 11.
Cross-sectional image of gel phantom and plot of line profile at 12 keV under (a) absorption and (b) phase mode image
Table 4.
Mean measured edge-enhancement index and edge enhancement to noise ratio values for a small region of the polymer gel phantom
| EEI at 12 keV | EE/N at 12 keV | ||
|---|---|---|---|
| Absorption mode | Phase mode | Absorption mode | Phase mode |
| 1.19±0.21 | 1.86±0.36 | 28.21±0.3 | 35.31±0.67 |
EEI: Edge-enhancement index, EE/N: Edge enhancement to noise ratio
Absorbed dose to air from synchrotron radiation X-ray beam
The measured photon flux at 12 and 16 keV of SR X-ray energies are 1.74 × 10⁸ and 1.21 × 10⁸ photons/s/mm2. Values of mass energy absorption coefficients for these two SR X-ray energies are 3.48 and 1.44 cm2/g. Accordingly, absorbed dose to air for the SR X-ray beam of 12 and 16 keV energies was found to be 75.59 mGy and 28.9 mGy, respectively. The value of absorbed dose to air for 16 keV is less than that of 12 keV SR X-ray beam due to low SR X-ray flux and mass energy-absorption coefficient value of 16 keV. It can be seen that the obtained dose values are very high when compared with conventional mammography system due to high X-ray flux and dose rate at the sample plane when SR is used. However, these dose values can be optimized by reducing the image acquisition time without compromising the image quality when clinical samples are imaged.
CONCLUSION
As in-phantom measurements are the best solution for characterizing any imaging system, we have used various phantoms and samples made up of breast tissue-equivalent materials for carrying out mammography imaging studies at beam line, BL-4, Indus-2 SR X-ray source of RRCAT, Indore, India. SR X-ray images of different phantoms and samples were analyzed and imaging parameters were quantified in terms of EEI and EE/N. Dosimetry calculations were also carried out based on the measured SR X-ray flux at different SR X-ray energies. Outcome of these studies shows that improved sensitivity can be achieved by applying low keV SR X-ray based XPCI imaging for examining soft-tissue equivalent materials. In conclusion, this work demonstrates the feasibility of XPCI in mammography using 12 and 16 keV SR X-ray beams.
Financial support and sponsorship
Nil.
Conflicts of interest
There are no conflicts of interest.
REFERENCES
- 1.Fitousi NT, Delis H, Panayiotakis G. Monte Carlo simulation of breast imaging using synchrotron radiation. Med Phys. 2012;39:2069–77. doi: 10.1118/1.3694670. [DOI] [PubMed] [Google Scholar]
- 2.Bradley D, Gundogdu O, Jenneson P, Eleftheria N, Che IE. Review of X-ray phase contrast imaging techniques and propagation based imaging using a benchtop microfocal source. J Sains Kesihatan Malaysia. 2007;5:1–16. [Google Scholar]
- 3.Munro PR, Ignatyev K, Speller RD, Olivo A. Design of a novel phase contrast x-ray imaging system for mammography. Phys Med Biol. 2010;55:4169–85. doi: 10.1088/0031-9155/55/14/014. [DOI] [PMC free article] [PubMed] [Google Scholar]
- 4.Miao H, Gomella AA, Harmon KJ, Bennett EE, Chedid N, Znati S, et al. Enhancing tabletop x-ray phase contrast imaging with nanofabrication. Sci Rep. 2005;5:13581. doi: 10.1038/srep13581. [DOI] [PMC free article] [PubMed] [Google Scholar]
- 5.Dreossi D, Abrami A, Arfelli F, Bregant P, Casarin K, Chenda V, et al. The mammography project at the SYRMEP beamline. Eur J Radiol. 2008;68:S58–62. doi: 10.1016/j.ejrad.2008.04.038. [DOI] [PubMed] [Google Scholar]
- 6.Matsuo S, Katafuchi T, Tohyama K, Morishita J, Yamada K, Fujita H, et al. Evaluation of edge effect due to phase contrast imaging for mammography. Med Phys. 2005;32:2690–7. doi: 10.1118/1.1992087. [DOI] [PubMed] [Google Scholar]
- 7.Weon BM, Je JH, Hwu Y, Margaritondo G. Phase contrast x-ray imaging. Int J Nanotechnol. 2006;3:280–97. [Google Scholar]
- 8.Wong MD, Wu X, Liu H. Image quality and dose efficiency of high energy phase sensitive x-ray imaging: Phantom studies. J Xray Sci Technol. 2014;22:321–34. doi: 10.3233/XST-140428. [DOI] [PMC free article] [PubMed] [Google Scholar]
- 9.Schleede S, Bech M, Achterhold K, Potdevin G, Gifford M, Loewen R, et al. Multimodal hard X-ray imaging of a mammography phantom at a compact synchrotron light source. J Synchrotron Radiat. 2012;19:525–9. doi: 10.1107/S0909049512017682. [DOI] [PMC free article] [PubMed] [Google Scholar]
- 10.Nesterets YI, Gureyev TE, Mayo SC, Stevenson AW, Thompson D, Brown JM, et al. A feasibility study of X-ray phase-contrast mammographic tomography at the imaging and medical beamline of the Australian synchrotron. J Synchrotron Radiat. 2015;22:1509–23. doi: 10.1107/S160057751501766X. [DOI] [PubMed] [Google Scholar]
- 11.Burattini E. Synchrotron radiation: New trend in X-ray mammography. Acta Phys Pol A. 1997;91:707–13. [Google Scholar]
- 12.Longo R. Current studies and future perspectives of synchrotron radiation imaging trials in human patients. Nucl Instrum Methods Phys Res A. 2016;809:13–22. [Google Scholar]
- 13.Ingal VN, Beliaevskaya EA, Brianskaya AP, Merkurieva RD. Phase mammography – A new technique for breast investigation. Phys Med Biol. 1998;43:2555–67. doi: 10.1088/0031-9155/43/9/009. [DOI] [PubMed] [Google Scholar]
- 14.Moeckli R, Verdun FR, Fiedler S, Pachoud M, Schnyder P, Valley JF, et al. Objective comparison of image quality and dose between conventional and synchrotron radiation mammography. Phys Med Biol. 2000;45:3509–23. doi: 10.1088/0031-9155/45/12/301. [DOI] [PubMed] [Google Scholar]
- 15.Arfelli F, Bonvicini V, Bravin A, Cantatore G, Castelli E, Palma LD, et al. Mammography with synchrotron radiation: Phase-detection techniques. Radiology. 2000;215:286–93. doi: 10.1148/radiology.215.1.r00ap10286. [DOI] [PubMed] [Google Scholar]
- 16.Raven C, Snigirev A, Snigireva I, Spanne P, Souvorov A, Kohn V. Phase-contrast microtomography with coherent high-energy synchrotron x rays. Appl Phys Let. 1996;69:1826–8. [Google Scholar]
- 17.Pelka JB. Synchrotron radiation in biology and medicine. Acta Phys Pol A. 2008;114:309. Proceedings of the 7th National meeting of synchrotron radiation users. [Google Scholar]
- 18.Donnelly EF, Lewis KG, Wolske KM, Pickens DR, Price RR. Characterization of the phase-contrast radiography edge-enhancement effect in a cabinet x-ray system. Phys Med Biol. 2006;51:21–30. doi: 10.1088/0031-9155/51/1/002. [DOI] [PubMed] [Google Scholar]
- 19.Agrawal AK, Singh B, Kashyap YS, Shukla M, Sarkar PS, Sinha A, et al. Design, development and first experiments on the X-ray imaging beamline at indus-2 synchrotron source RRCAT, India. J Synchrotron Radiat. 2015;22:1531–9. doi: 10.1107/S1600577515016276. [DOI] [PubMed] [Google Scholar]
- 20.Yamazaki A, Ichikawa K, Kodera Y. Evaluation of physical image characteristics of phase contrast mammography. Proc SPIE. 2007;6510:65103A. [Google Scholar]
- 21.CIRS Tissue Simulation and Phantom Technology. The CIRS Model 015 Mammography Accreditation Phantom. [Last accessed on 2016 Jul 16]. Available from: http:// www.cirsinc.com/file/Products/015 .
- 22.Henrot P, Leroux A, Barlier C, Génin P. Breast microcalcifications: The lesions in anatomical pathology. Diagn Interv Imaging. 2014;95:141–52. doi: 10.1016/j.diii.2013.12.011. [DOI] [PubMed] [Google Scholar]
- 23.Suryanarayanan S, Karellas A, Vedantham S, Sechopoulos I, D’Orsi CJ. Detection of simulated microcalcifications in a phantom with digital mammography: Effect of pixel size. Radiology. 2007;244:130–7. doi: 10.1148/radiol.2441060977. [DOI] [PMC free article] [PubMed] [Google Scholar]
- 24.Vedantham S, Karellas A. X-ray phase contrast imaging of the breast: Analysis of tissue simulating materials. Med Phys. 2013;40:041906. doi: 10.1118/1.4794503. [DOI] [PMC free article] [PubMed] [Google Scholar]
- 25.Warren LM, Mackenzie A, Dance DR, Young KC. Comparison of the x-ray attenuation properties of breast calcifications, aluminium, hydroxyapatite and calcium oxalate. Phys Med Biol. 2013;58:N103–13. doi: 10.1088/0031-9155/58/7/N103. [DOI] [PubMed] [Google Scholar]
- 26.Berger MJ, Hubbell JH, Seltzer SM, Chang J, Coursey JS, Sukumar R, et al. XCOM: Photon cross section database (version 1.5) [Last accessed on 2015 Mar 02]. Available from: http://www.physics.nist.gov/xcom 2010 .
- 27.Rasband WS. ImageJ, U.S. National Institutes of Health. Bethesda, Maryland, USA: 2012. [Last accessed on 2016 Mar 11]. Available from: http://www.imagej.nih.gov/ij/ [Google Scholar]
- 28.Chen RC, Longo R, Rigon L, Zanconati F, De Pellegrin A, Arfelli F, et al. Measurement of the linear attenuation coefficients of breast tissues by synchrotron radiation computed tomography. Phys Med Biol. 2010;55:4993–5005. doi: 10.1088/0031-9155/55/17/008. [DOI] [PubMed] [Google Scholar]
- 29.Brown S, Venning A, De Deene Y, Vial P, Oliver L, Adamovics J, et al. Radiological properties of the PRESAGE and PAGAT polymer dosimeters. Appl Radiat Isot. 2008;66:1970–4. doi: 10.1016/j.apradiso.2008.06.005. [DOI] [PubMed] [Google Scholar]
- 30.Attix FH. Weinheim: Wiley-VCH; 2004. Introduction to Radiological Physics and Radiation Dosimetry. [Google Scholar]
- 31.Mittone A, Baldacci F, Bravin A, Brun E, Delaire F, Ferrero C, et al. An efficient numerical tool for dose deposition prediction applied to synchrotron medical imaging and radiation therapy. J Synchrotron Radiat. 2013;20:785–92. doi: 10.1107/S0909049513017184. [DOI] [PubMed] [Google Scholar]


