Abstract
Aim:
This study aims to develop a method using dual-energy computed tomography (DECT) to determine the effective atomic number and electron density of substances.
Materials and Methods:
Ten chemical substances of pure analytical grade were obtained from various manufacturers. These chemicals were pelletized using a hydraulic press. These pellets were scanned using DECT. A relation was obtained for the pellet's atomic number and electron density with their CT number or Hounsfield unit (HU) values. Calibration coefficients were determined. Five new chemical pellets were scanned, and their effective atomic number and electron densities were determined using the calibration coefficients to test the efficacy of the calibration method.
Results:
The results obtained for effective atomic number and electron density from the HU number of DECT images were within ±5% and ±3%, respectively, of their actual values.
Conclusions:
DECT can be used as an effective tool for determining the effective atomic number and electron density of high atomic number substance.
Keywords: Dual-energy computed tomography, effective atomic number, electron density
INTRODUCTION
A new imaging modality called dual-energy computed tomography (DECT) is gaining popularity in radiodiagnosis. DECT systems are basically of two types. They may be a single-source DECT and dual-source DECT. A single-source DECT has a single X-ray tube in which a rapid kVp switching between two alternate tube voltages is carried out to obtain a DECT image. On the other hand, dual source DECT uses two rotating tubes to acquire both high and low voltage images simultaneously. The image obtained in computed tomography is based on the differential attenuation of the X-ray beam as it passes through the different parts of the object of which image is acquired. These two energy acquisition systems are mounted onto the rotating gantry with an angular offset of 90°. Although DECT has been introduced into clinical use recently, its technique has been investigated for >3 decades, i.e., since 1970s.[1] DECT provides better diagnostic images and what is more advantageous is that it does not require an additional dose compared to single energy CT.[2,3]
From dual-energy image data, effective atomic number (Zeff) which describes the composition of a scanned object can be derived and hence can be used to differentiate materials. This technique was first conceived in 1976.[4] Computed tomography enabled the material differentiation by scanning material with two different energies simultaneously, i.e., dual-energy imaging which allowed the analysis of the Compton and photoelectric effects. Conversion of the Hounsfield unit (HU) number (or CT number) to electron density is one of the main processes that determine the accuracy of patient dose calculations in radiation treatment planning.[5]
DECT technique uses two different energies for scanning the body (or material) simultaneously at a time. This simultaneous acquisition of images at two different energies can enable us to determine the atomic number and electron density of the scanned system. It is clear that since two unknown variables (Zeff, ρe) are to be found, one would need HU values at two different energies. DECT takes into account the dependence of the Compton effect and the photoelectric effect on the energy (E) of the photon and thus determines the values of Zeff and ρe. It was understood that this would be feasible if one could separate out the contributions from the Compton scattering and photoelectric effect from the total linear attenuation coefficient (μ) of the substance. These are some of the important factors that affect the accuracy of the method to find the Zeff and ρe values from the DECT data. Although medical X-ray tubes generate polychromatic spectra, the general principle for photoelectric effect and Compton scattering remains valid. Thus, DECT can be defined as the use of attenuation values acquired with different energy spectra, and the known changes in attenuation between the two spectra, to differentiate and classify tissue composition.
In 1976, Rutherford et al.[6] tried to determine the electron density and atomic number using EMI scanner as it was the technology available at that time. These results were applied in the investigation of some brain tumors in vivo. Millner et al. in 1979[7] tried to use the method as suggested by Rutherford et al. to differentiate various inserts in AAPM phantom.
Saito[8] stated that a simple one to one correspondence of CT number and electron density was not possible as CT number depends on electron density and effective atomic number of the material. They presented a simple conversion from the energy-subtracted CT number by means of DECT to the relative electron density through a single linear relationship.
Goodsitt et al.[9] performed a study to investigate the accuracies of the synthesized monochromatic images and effective atomic number maps obtained with the CT scanner. A Gammex-RMI model 467 tissue characterization phantom and the CT number linearity section of a Phantom Laboratory Catphan 600 phantom were scanned using the dual-energy feature on the GE CT750 HD scanner. These values of the effective atomic number obtained from CT scanner were accurate up to 15% with respect to their true values provided by the manufacturer. The synthesized monochromatic CT numbers were very unreliable.
Heismann et al.[10] suggested a projection algorithm for obtaining the density and atomic number with an energy-resolving X-ray method. In this method, the determination of atomic number interferes with determination of electron density and vice versa, and hence, the results had large errors. In these previous studies, there had been many limitations like the inadequacy of the available technology for the scanners. Furthermore, these studies[6,7,8,10] just focused on the accurate determination of electron density. In some cases, the extent of the accuracy of determination of the quantities, electron density, and effective atomic number simultaneously was not satisfactory due to machine dependent factors. Saito and Sagara[11] describes the approach of obtaining the effective atomic number from electron density. This method suffers from the drawback that any error in the determination of electron density will be propagated to the values of effective atomic number.
In this paper, we have tried to devise a method which is not only independent of the machine dependent factors[12,13,14] but also in this method, determination of electron density does not interfere with the determination of effective atomic number or vice versa. The machine dependent factors such as the source spectrum (which may be influenced by various factors such as tube's inherent and additional filtration,[14] tube current, and tube accelerating voltage) and detector efficiency have been taken care of by this novel method. The clinician can visually differentiate among bone soft tissue, lung, water, and air from CT images. Recent literature describes[11,15,16,17,18] commercial phantom-based studies for differentiating bone soft tissue, lung, water, and air in human body by obtaining electron density and effective atomic number from DECT data. However, the challenge lies in differentiating among different type of renal stones (calcium stones), types of atherosclerotic plaque, etc., from CT images as visual differentiation is hindered due to overlapping HU values. Differentiation among the type of renal stones (calcium oxalate monohydrate and dehydrate) is clinically desirable but yet not achieved with the different type of imaging modalities. We attempt to resolve this problem using electron density and the effective atomic number derived from DECT data, and the present study describes the calibration process for obtaining electron density and effective atomic number.
The results obtained from this study will be of great significance as the accurate determination of electron density and effective atomic number impacts both the therapeutic[3] as well as diagnostic[7,14] aspect of the use of radiation in our clinics. The method suggested in this paper will give us more accurate electron density and effective atomic number and hence can be used to characterize kidney stones and coronary artery plaques as well as more accurate dose calculation in low energy brachytherapy.
MATERIALS AND METHODS
The whole study consisted of four parts:
Mathematical formulations for calibration and determination of calibration coefficients
Selection and preparation of calibration samples (henceforth called calibrators)
Scanning of calibrators
Testing the method of calibration with the help of validators
Mathematical formulations for calibration and determination of calibration a coefficients
Total linear attenuation coefficient (incoherent scattering) μ(E) of X-rays is given by:


where,
 is Compton attenuation,
  is photoelectric attenuation, and αo= 66.62 × 10^, (−24) and βo= 54.7578 × 10^ (−28) are constants. In eq. 2, fKN is Klein–Nishina coefficient and fph is photoelectric coefficient which is given by:

The values of exponent X and Y for various chemical substances were obtained from NIST tables by the method given by Haghighi et al.[19,12] Io is the intensity of the X-ray beam.
Effective atomic number and electron density of the samples were calculated using eq.4 and eq.5, respectively.[19]


where ρ (rho) is density and ρe is electron density of the scanned sample, Cj is the concentration of chemical species, nij is a tensor notation for number of atom. Zi is the atomic number of ith atom. Various authors have used different values of P, and hence, different values of P have been suggested in the literature. In the present investigation, we have used P = 4. For hydrogen atom, the photoelectric coefficient varies as ρeZ4.[20,21] Hence, in view of the fact that the hydrogen atom is the simplest atom, this choice has been made. Mp is the mass of the proton and is = 1.67 × 10⁻²⁷ gm.
Relation between Zeff and ZeffX
MATLAB 2015Rb was used to perform the mathematical calculations and determination of the calibration coefficients. Let us define a quantity T.
where,

Applying log on both sides

After finding the value for X for each chemical, we now fit the computed values of Zxeff with computed values of Zeff


Zeff for a chemical sample can be calculated using equation 1.
Determination of ZeffX
Let us define a function


where  and
and  are attenuation coefficient of the substance and water, respectively, averaged over the entire source spectrum. HU(v) is HU number of the scanned chemical substance scanned at voltage v (i.e., at 100 kV and 140 Sn). Substituting
  in equation 12 with equation 4 and
  and
and 

Expanding the denominator and rearranging the above equation it can be written as
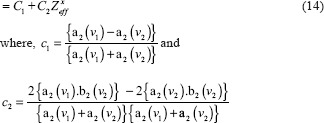
The higher order terms of Zxeff is very small and can be neglected. Consequently, the above equation can be written in linear form as

Determination of Electron Density (ρe)
Using the above equation no. 13, we can write


Applying log on both sides, we get
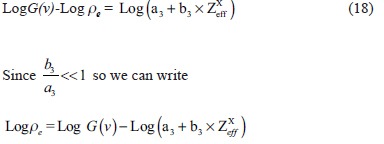

The above mathematical formulation and equations show that we need to determine the coefficients a1, b1, c1, c2, a4 and b4. These coefficients gave linear regression between the effective atomic number or the electron density of the scanned substance and functions of predefined HU values. Once the calibration was carried out and correlation coefficients were obtained, they were used to determine the effective atomic number and electron density of the validator samples using their scanned data or HU value.
Selection and preparation of calibration samples (calibrators)
We selected stable chemicals with atomic number in the range of 7.06–16. This range was selected keeping in mind the possible application of this calibration to noninvasively characterize the kidney stones (as the atomic number of renal stones also lies in range 7.0–16).[12] Only those compounds were considered which can be pelletized without any binder by using hydraulic pressure pump (as kidney stones being solid, have high electron density). Further, we checked these chemicals for hygroscopicity and toxicity, as hygroscopic compound would change its density with slight exposure to air. The toxic compound would have required tough precautionary measures and would have complicated their handling while working with a CT scanner.
Scanning of calibration samples
The scans were performed using the phantom shown in Figure 1 which we designed for the purpose. The phantom consisted of two parts (a) the outer sphere and (b) the inner cylindrical tube.
Figure 1.
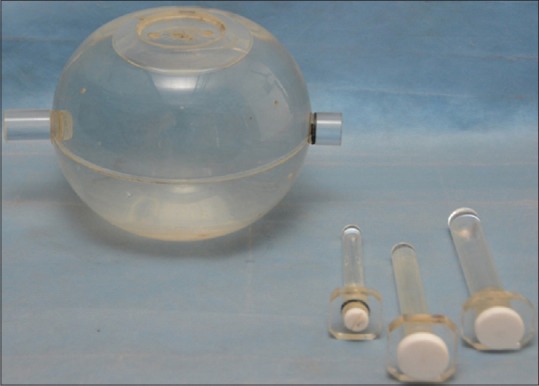
Calibration phantom consisted of two parts the outer sphere and the inner cylindrical tubes of various sizes to accommodate different size of pellets. The cylindrical tubes could be fitted to outer sphere with the help of a zig. The pellets of calibrators and validators were put in cylindrical tube which was inserted into outer sphere containing water. The inner cylindrical tube also contained a suitable liquid
For scanning the solid samples, the pellets were kept immersed in a suitable liquid which was kept in an inner cylindrical tube of the phantom. This was done to avoid air interface between the pellets and tube walls. The liquid was chosen keeping in mind that the selected pellet for scanning should not be soluble in the liquid chosen. Hence, we needed various liquids such as ether and ethanol for performing our experiments.
The cylindrical tube was inserted into an outer sphere filled with distilled water. The outer sphere had a diameter of 18 cm. The diameter of the central cylindrical tube was 1 cm, 1.5 cm, and 2 cm. Length of the tube was 7 cm so that it may reach the center of the sphere. Slots for three tubes (although only one can be used at a time) of different diameter were provided to accommodate pellets of different diameters. The whole system was placed on the CT couch in such a way that long axis of tube was along the Z axis of the scanning table. A separate scan was performed for each calibration sample. The scans were performed by 16-slice Siemens CT scanner Somatom Definition Flash. Scan protocol details are mentioned in Supplement Table 1. We have checked the HU values of water near the central tube of phantom and also close to the outer wall of the phantom at 12, 3, 6, 9 o’ clock position. The typical values of HU were as follows, −3.3 (12 o’ clock), −1.2 (3 o’ clock), 0.6 (6 o’ clock), −3.6 (9 o’ clock), and −1.6 (at centre) for 120 kVp. This shows that the HU values of water were nearly the same at different points. We thus concluded that the beam hardening effect has been taken care by the machine. Literature reveals[21] that DECT reduces beam hardening artifacts and scanning at higher kV results in harder X-ray and thus less hardening artifacts. Generally, with use of inbuilt filters of CT machine, the machine itself overcomes beam hardening. A circular region of interest was selected at the center of the pellet in different slices. The phantom was scanned using dual energies 100 kV and 140 kV Sn (Tin) filter. We chose the region of interest (ROI) of 0.1 mm2 at the center of the pelletized compounds in such a way that each ROI (along the axial slices) must contain at least three pixels per ROI so that HU values can be statistically acceptable.
Supplement Table 1.
Ten calibrators, which were used to do calibration and five validators used for checking the validity of inversion algorithm
| Sample type | Sample code | Sample name | Exponent X |
|---|---|---|---|
| Calibration samples (calibrators) | S1 | Sodium acetate anhydrous | 2.426 |
| S2 | Sodium | 2.586 | |
| S3 | Sucrose | 2.238 | |
| S4 | Sodium bisulfite | 2.626 | |
| S5 | Magnesium | 2.627 | |
| S6 | Aluminum | 2.659 | |
| S7 | Silicon | 2.720 | |
| S8 | Calcium sulfate dihydrate | 2.655 | |
| S9 | Ammonium chloride | 2.680 | |
| S10 | Phosphorus | 1.766 | |
| Samples used for verification of calibration (validators) | S11 | Ethylenediamine acetate | 2.346 |
| S12 | Potassium hydrogen carbonate | 2.656 | |
| S13 | Potassium sulfate | 2.701 | |
| S14 | Calcium acetate | 2.614 | |
| S15 | Ammonium sulfate | 2.553 |
Exponent Y was found to be ~3.07 for all the above samples
Ten chemicals samples (called calibrators) were used to calibrate the CT scanning system to develop a method to determine the effective atomic number and electron density of the scanned substance. These chemicals were of pure analytic grade with effective atomic number in the range of 7.06–16.
Testing the method of calibration
After the calibration coefficients were determined, we chose 5 new chemical samples in pellet form. These chemicals pellets were called validators. They were scanned under the same experimental conditions as we described earlier. The HU data were collected, and the value of function S was found. Thereafter, using the calibration coefficients found in the earlier section, we determined the values of effective atomic number and electron density of validators.
RESULTS
For diagnostic radiology, the effective energy lies in the regime 20 and 80 keV (20<E< 80) most of the time. This can be seen from the Boone–Seibert source spectrum S0 (E, V).[15,16] Table 1 shows the HU values at 100 and 140 Sn kVp and other functions defined in the equations 2–15 for calibrators. For each of the pelletized compounds, HU values were measured at least ten times. Tables 2 and 3 give the average HU values. The standard deviation in HU values for these compounds was founded to be within ±10 HU, which gave a maximum error of 0.79% within 99% confidence limit and hence implies acceptable variation in HU values (error <1% in HU values).
Table 1.
Scanning details
| Parameters | Details |
|---|---|
| Protocol | Abdominal protocol |
| Reconstruction algorithm | D26f convolution kernel |
| Slice thickness | 0.3 mm |
| Collimation | 64×0.6 |
| Temporal resolution (ms) | 83 |
| Pitch | 0.25 |
| Rotation time (ms) | 330 |
| Matrix size | 512×512 |
Table 2.
Data for the calibrators like their Hounsfield unit values for dual-energy computed tomography scan, Zxeff, Zeff, ρ, ρe
| Sample number | HU 100 | HU 140 Sn | S | Zxeff | Zeff | Density ρ (g/cm3) | ρe×1023/cm3 |
|---|---|---|---|---|---|---|---|
| S1 | 442.72 | 375.18 | 0.0185 | 191.31 | 8.71 | 1.38 | 4.32 |
| S2 | 98.14 | −30.68 | 0.0816 | 494.28 | 11.00 | 0.97 | 2.69 |
| S3 | 530.00 | 480.00 | 0.0166 | 79.523 | 7.07 | 1.51 | 4.81 |
| S4 | 1564.72 | 1155.36 | 0.0867 | 821.15 | 12.88 | 2.08 | 6.23 |
| S5 | 2052.00 | 1599.2 | 0.0964 | 794.99 | 12.00 | 2.42 | 7.35 |
| S6 | 2470.91 | 1789.01 | 0.1089 | 916.83 | 13.00 | 2.70 | 7.79 |
| S7 | 1052.86 | 701.51 | 0.0829 | 1311.60 | 14.00 | 1.71 | 5.10 |
| S8 | 1842.44 | 1197.06 | 0.1280 | 1326.48 | 14.99 | 2.06 | 6.34 |
| S9 | 1425.31 | 807.33 | 0.1460 | 1432.26 | 15.05 | 1.47 | 4.74 |
| S10 | 2257.30 | 1324.20 | 0.1671 | 1897.54 | 16.00 | 1.88 | 5.56 |
The HU values at 100 and 140 Sn kVp were obtained after DECT scan and other function like ρe, S, Zeff X, and Zeff was obtained using equation 5,8, 11 and 15. HU: Hounsfield unit, DECT: Dual-energy computed tomography
Table 3.
Effective atomic number obtained experimentally (Zeff (DECT)) as well as by using formulae (Zeff (actual)) given in equation 1
| Sample code | HU 100 | HU 140 Sn | Zeff (DECT) | Zeff (Actual) | Percentage error (R1) | ρe (DECT) ×1023/cm3 | ρe (actual) ×1023/cm3 | Percentage error (R2) |
|---|---|---|---|---|---|---|---|---|
| S11 | 600 | 540 | 7.51 | 7.91 | 5.0 | 4.90 | 5.02 | 2.3 |
| S12 | 2154.02 | 1401.84 | 14.69 | 15.08 | 2.7 | 6.39 | 6.31 | 1.2 |
| S13 | 3098.5 | 1789.94 | 16.13 | 16.34 | 1.2 | 6.83 | 7.01 | 2.5 |
| S14 | 836.62 | 469.58 | 13.89 | 14.23 | 2.3 | 4.06 | 4.12 | 1.4 |
| S15 | 998.1 | 763.9 | 11.71 | 11.47 | 2.0 | 5.25 | 5.35 | 1.8 |
Also electron density obtained experimentally (ρe (obtained)) as well as by using formulae (ρe (actual)) given in equation 5. Percentage error R1 and R2 are the ratio of actual to DECT obtained values of effective atomic number and electron density respectively. HU: Hounsfield unit, DECT: Dual-energy computed tomography
Figures 2-4 illustrate the calibration results from equation 8, 15, and 19, respectively. The calibration experiments yielded the values of coefficient a1 = 0.3491, b1 = 0.2593, c1 = 0.0155, c2 = 8.18 × 10⁻⁵, a4 = −0.5055, and b4 = 9.788 × 10⁻⁵. Final values of a4 and b4 were found by averaging the values at 100 and 140 kVp with equal weightage. Once these coefficients and the HU values of test samples (calibrators) were known, we were able to determine the effective atomic number and electron density of any test samples. We verified our method by applying it to five new chemicals called validators (S11 to S15). Table 3 lists the various parameters for these validators including the atomic number and electron density obtained by our DECT experimental method [Called Zeff (DECT) and ρe (DECT) respectively] along with their actual atomic number and electron density [Called Zeff (Actual) and ρe (Actual) respectively]. The actual effective atomic number and electron density were calculated using their chemical formulae. R1 is the percentage error in the effective atomic number values obtained from DECT relative to its actual value. Similarly, R2 is the percentage error in the electron density obtained from DECT relative to its actual.
Figure 2.
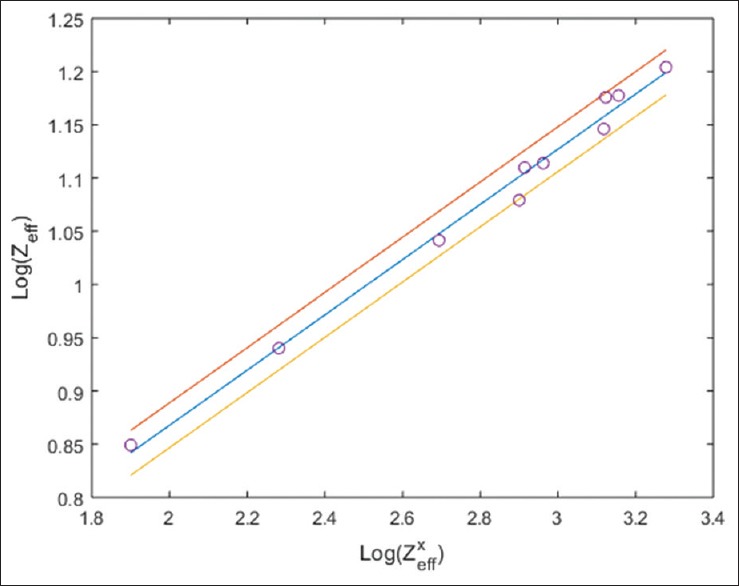
Least square fit graph between Log Zxeff and Log Zeff which was used to determine correlation coefficients a1 and b1 of equation 8. 95% confidence interval was shown by lines drawn above and below the central line. Value of a1 = 0.3491 and b1 = 0.2593 (linear regression coefficient r = 0.9949 with P < 0.0001 that is statistically highly significant result) were found by calibrators
Figure 4.
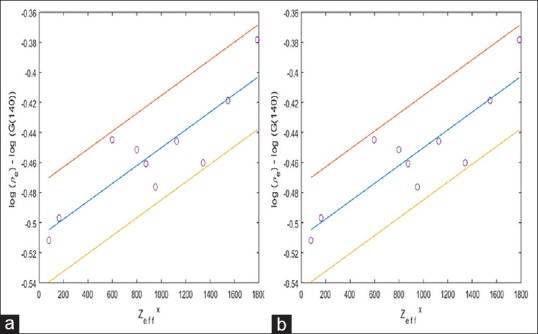
Linear regression fit of equation 19 that is [Log (ρe)-LogG(ν)] versus Zxeff 95% confidence interval was shown by lines drawn above and below the central line. (a) The value of correlation coefficient a4 and b4 were found to be −0.501 and 1.366 × 10⁻⁴, respectively (linear regression coefficient r = 0.9707 with P < 0.0001 that is statistically highly significant result) for voltage ν =140 kVp. (b) Similarly, at ν =100 kVp, a4 and b4 were found to be −0.509 and 5.932 × 10⁻⁵, respectively (linear regression coefficient r = 0.8696 with P < 0.01 that is statistically significant result)
Figure 3.
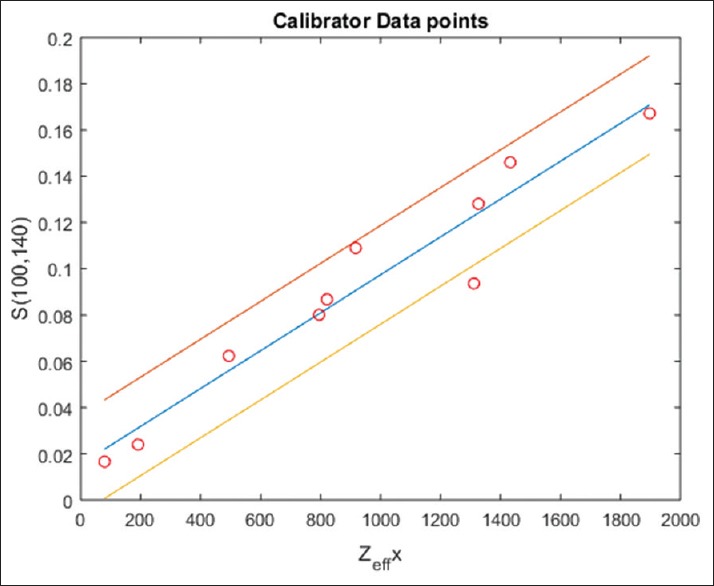
Least square graph fit between Zxeff and S which was used to determine the correlation coefficients c1 and c2 of equation 15. 95% confidence interval was shown by lines drawn above and below the central line. Value of c1 = 0.015 and c2 = 8.187 × 10⁻⁵ (linear regression coefficient r = 0.9636 with P < 0.0001 that is statistically highly significant result) were found by calibrators
The experimental results for these test samples were within ± 5% of their actual values of Zeff and ±3% of their actual values of ρe.
DISCUSSION
When a photon with energy in diagnostic energy range (50–150 keV) interacts with a material, the most common types of interactions are photoelectric effect, Compton effect, and Rayleigh scattering. The probability of photoelectric effect depends on (i) K or L shell binding energy of the interacting atom, (ii) atomic number of the material, and (iii) energy of the incident X-ray photon. On the other hand, the Compton effect depends on the electron density of the interacting material. For low atomic number, the probability of photoelectric effect is very small and hence very difficult to determine the effective atomic number. In our case, we have used the material with high effective atomic number, i.e., the atomic number between 10 and 20. In this range, the photoelectric effect is dominant.
For this study, Rayleigh scattering was taken into account while calculating X for different elements and compounds. It was seen through NIST tables that in the atomic range of 11–16, the Rayleigh scattering is ~10% of the total photon attenuation in the energy range of 25–60 keV. Therefore, we decided to take Rayleigh effect into account for our experiments. Several researchers have tried to determine effective atomic number of the scanned material but our method is unique and can be utilized in the wide range of application like radiotherapy and the present application of characterization of kidney stones. The choice of P equal to 4 in equation 4, and has been chosen as it is the value for the simplest hydrogen atom.[20,21] In our study, we found that the photoelectric part of the attenuation coefficient has a power law dependence, i.e., (1) proportional to (1/E)y on the energy of the photon while (2) and on the effective atomic number of the substance as Zeffx.
Several new methods[6,22,23,24,25,26,27] have been suggested by researchers for the determination of effective atomic number and electron density using DECT. Saito[8] studied the potential of dual-energy subtraction for converting CT numbers to electron density based on a single linear relationship. This study exhibited a linear relationship over a wide range of electron density but lacked in analyzing the effect of the atomic number on the variation of HU values. Goodsitt et al.[9] used the synthesized monochromatic images in GE Discovery CT750 HD CT to measure the atomic number of material and compared it with manufacturer provided values of the atomic number. The method adopted by Goodsitt reports inaccuracy as the CT spectrum is polychromatic leading to error up to ±15% whereas the results we produced has the accuracy of ±3%. This was possible because in our present study, we could determine the atomic number of the material by a novel technique which is independent of the source spectrum.
In the method proposed by Heismann et al.,[10] a projection algorithm was proposed for obtaining the density and atomic number Z(r) with an energy-resolving X-ray method. In this method, the determination of atomic number interferes with determination of electron density and vice versa which was not the case in our study because in equations involved in our method, the elimination of one quantity was taken care of mathematically so as to avoid the occurrence/continuance of eror in the determination of other.
The salient features of this new study are as follows:
The samples used were of high effective atomic number range, and hence, it establishes the validity of the method in higher atomic number range
We have developed the method of calibration using the solid samples rather than liquid chemicals unlike in previous works.[13,14,28]
The Rayleigh effect is taken into account in this study for the calculation of exponents.
The accuracy of the developed method was checked using those chemicals which were not the part of the calibration method. These chemicals samples were called validators
This paper is a carefully planned comprehensive work focusing on all the steps of the calibration work systematically, which included determination of the number of samples to be taken (sample size), selection of the samples, their meticulous preparation, and mathematical formulations.
In this study, the effect of Rayleigh scattering has been accounted for the calculation of effective atomic number and electron density. It was seen through NIST[29] tables that in the atomic range of 11–16, the Rayleigh scattering is about 10% of the total photon attenuation in the energy range of 25–60 keV. It is in this energy range that the bulk of X-ray photon in CT spectrum interacts with the scanned material. Hence, it was absolutely necessary to include the effect of Rayleigh scattering in our calculations.
The exponent x is not a universal constant but depends on the effective atomic number and hence on the substance. Neglect of this dependence of x on Zeff would give rise to HU values which are widely different from those, which are observed. That is why the researchers have tried to determine the values of x and y.
CONCLUSIONS
Our results show that the current method could calculate the effective atomic number and electron density of unknown samples with good accuracy. All the values of effective atomic number and electron density were well within ±5% and ±3%, respectively, of their actual values. It is possible to improve the calibration further by increasing the number of calibration points and reduce the discrepancy between the true value and experimental values. We plan to use this method for in vivo characterization of kidney stones in the patients noninvasively. The preliminary work in this direction has provided us with vital information regarding the stone composition, and therefore, a noninvasive characterization with enough statistical significance seems plausible.
Financial support and sponsorship
Nil.
Conflicts of interest
There are no conflicts of interest.
REFERENCES
- 1.Brooks RA. A quantitative theory of the Hounsfield unit and its application to dual energy scanning. J Comput Assist Tomogr. 1977;1:487–93. doi: 10.1097/00004728-197710000-00016. [DOI] [PubMed] [Google Scholar]
- 2.Euler A, Obmann MM, Szucs-Farkas Z, Mileto A, Zaehringer C, Falkowski AL, et al. Comparison of image quality and radiation dose between split-filter dual-energy images and single-energy images in single-source abdominal CT. Eur Radiol. 2018;28:3405–12. doi: 10.1007/s00330-018-5338-x. [DOI] [PubMed] [Google Scholar]
- 3.Henzler T, Fink C, Schoenberg SO, Schoepf UJ. Dual-energy CT: Radiation dose aspects. AJR Am J Roentgenol. 2012;199:S16–25. doi: 10.2214/AJR.12.9210. [DOI] [PubMed] [Google Scholar]
- 4.Alvarez RE, Macovski A. Energy-selective reconstructions in X-ray computerized tomography. Phys Med Biol. 1976;21:733–44. doi: 10.1088/0031-9155/21/5/002. [DOI] [PubMed] [Google Scholar]
- 5.Landry G, Granton PV, Reniers B, Ollers MC, Beaulieu L, Wildberger JE, et al. Simulation study on potential accuracy gains from dual energy CT tissue segmentation for low-energy brachytherapy monte carlo dose calculations. Phys Med Biol. 2011;56:6257–78. doi: 10.1088/0031-9155/56/19/007. [DOI] [PubMed] [Google Scholar]
- 6.Rutherford RA, Pullan BR, Isherwood I. Measurement of effective atomic number and electron density using an EMI scanner. Neuroradiology. 1976;11:15–21. doi: 10.1007/BF00327253. [DOI] [PubMed] [Google Scholar]
- 7.Millner MR, McDavid WD, Waggener RG, Dennis MJ, Payne WH, Sank VJ, et al. Extraction of information from CT scans at different energies. Med Phys. 1979;6:70–1. doi: 10.1118/1.594555. [DOI] [PubMed] [Google Scholar]
- 8.Saito M. Potential of dual-energy subtraction for converting CT numbers to electron density based on a single linear relationship. Med Phys. 2012;39:2021–30. doi: 10.1118/1.3694111. [DOI] [PubMed] [Google Scholar]
- 9.Goodsitt MM, Christodoulou EG, Larson SC. Accuracies of the synthesized monochromatic CT numbers and effective atomic numbers obtained with a rapid kVp switching dual energy CT scanner. Med Phys. 2011;38:2222–32. doi: 10.1118/1.3567509. [DOI] [PubMed] [Google Scholar]
- 10.Heismann BJ, Leppert J, Stierstorfer K. Density and atomic number measurements with spectral x-ray attenuation method. J Appl Phys. 2003;94:2073–9. [Google Scholar]
- 11.Saito M, Sagara S. A simple formulation for deriving effective atomic numbers via electron density calibration from dual-energy CT data in the human body. Med Phys. 2017;44:2293–303. doi: 10.1002/mp.12176. [DOI] [PubMed] [Google Scholar]
- 12.Ravanfar-Haghighi R, Chatterjee S, Kumar P, Chatterjee V. Numerical Analysis of the Relationship between the Photoelectric Effect and Energy of the X-Ray Photons in CT. Frontiers in Biomedical Technologies. 2015:1. [Google Scholar]
- 13.Mandal SR, Bharati A, Haghighi RR, Arava S, Ray R, Jagia P, et al. Non-invasive characterization of coronary artery atherosclerotic plaque using dual energy CT: Explanation in ex-vivo samples. Physica Medica. 2018;45:52. doi: 10.1016/j.ejmp.2017.12.006. doi: 10.1016/j.ejmp.2017.12.006. [DOI] [PubMed] [Google Scholar]
- 14.Qu M, Ramirez-Giraldo JC, Leng S, Williams JC, Vrtiska TJ, Lieske JC, et al. Dual-energy dual-source CT with additional spectral filtration can improve the differentiation of non-uric acid renal stones: An ex vivo phantom study. AJR Am J Roentgenol. 2011;196:1279–87. doi: 10.2214/AJR.10.5041. [DOI] [PMC free article] [PubMed] [Google Scholar]
- 15.Garcia LI, Azorin JF, Almansa JF. A new method to measure electron density and effective atomic number using dual-energy CT images. Phys Med Biol. 2016;61:265–79. doi: 10.1088/0031-9155/61/1/265. [DOI] [PubMed] [Google Scholar]
- 16.Lalonde A, Bär E, Bouchard H. A bayesian approach to solve proton stopping powers from noisy multi-energy CT data. Med Phys. 2017;44:5293–302. doi: 10.1002/mp.12489. [DOI] [PubMed] [Google Scholar]
- 17.Sakata D, Haga A, Kida S, Imae T, Takenaka S, Nakagawa K, et al. Effective atomic number estimation using kV-MV dual-energy source in LINAC. Phys Med. 2017;39:9–15. doi: 10.1016/j.ejmp.2017.06.010. [DOI] [PubMed] [Google Scholar]
- 18.Bourque AE, Carrier JF, Bouchard H. A stoichiometric calibration method for dual energy computed tomography. Phys Med Biol. 2014;59:2059–88. doi: 10.1088/0031-9155/59/8/2059. [DOI] [PubMed] [Google Scholar]
- 19.Haghighi RR, Chatterjee S, Vyas A, Kumar P, Thulkar S. X-ray attenuation coefficient of mixtures: Inputs for dual-energy CT. Med Phys. 2011;38:5270–9. doi: 10.1118/1.3626572. [DOI] [PubMed] [Google Scholar]
- 20.Agarwal BK. Heidelberg: Springer-Verlag; 1991. X-Ray Spectroscopy: An Introduction. [Google Scholar]
- 21.Johns HE, Cunningham JR. Physics of Radiology. 1983 Springfield: Charles C. Thomas Publisher. [Google Scholar]
- 22.Kulkarni NM, Eisner BH, Pinho DF, Joshi MC, Kambadakone AR, Sahani DV, et al. Determination of renal stone composition in phantom and patients using single-source dual-energy computed tomography. J Comput Assist Tomogr. 2013;37:37–45. doi: 10.1097/RCT.0b013e3182720f66. [DOI] [PubMed] [Google Scholar]
- 23.Boas FE, Fleischmann D. CT Artifacts: Causes and reduction techniques. Imaging Med. 2012;4:229–40. [Google Scholar]
- 24.Ay MR, Shahriari M, Sarkar S, Adib M, Zaidi H. Monte carlo simulation of x-ray spectra in diagnostic radiology and mammography using MCNP4C. Phys Med Biol. 2004;49:4897–917. doi: 10.1088/0031-9155/49/21/004. [DOI] [PubMed] [Google Scholar]
- 25.Boone JM, Seibert JA. An accurate method for computer-generating tungsten anode x-ray spectra from 30 to 140 kV. Med Phys. 1997;24:1661–70. doi: 10.1118/1.597953. [DOI] [PubMed] [Google Scholar]
- 26.Heismann BJ, Mahnken AH. Quantitative CT characterization of body fluids with spectral ρZ projection method. Nuclear Science Symposium Conference Record, IEEE 4. 2006:2079–80. [Google Scholar]
- 27.Lehmann LA, Alvarez RE, Macovski A, Brody WR, Pelc NJ, Riederer SJ, et al. Generalized image combinations in dual KVP digital radiography. Med Phys. 1981;8:659–67. doi: 10.1118/1.595025. [DOI] [PubMed] [Google Scholar]
- 28.Haghighi RR, Chatterjee S, Tabin M, Sharma S, Jagia P, Ray R, et al. DECT evaluation of noncalcified coronary artery plaque. Med Phys. 2015;42:5945–54. doi: 10.1118/1.4929935. [DOI] [PubMed] [Google Scholar]
- 29.Hubbell JH, Seltzer SM. National Inst. of Standards and Technology-PL, Gaithersburg, MD (United States): Ionizing Radiation Div; 1995. [Last assessed on 2018 Aug 14]. Tables of x-Ray Mass Attenuation Coefficients and Mass Energy-Absorption Coefficients 1 keV to 20 MeV for Elements Z= 1 to 92 and 48 Additional Substances of Dosimetric Interest. Available from: http://physics.nist.gov/ PhysRefData/Xcom/html/xcom1.html . [Google Scholar]


