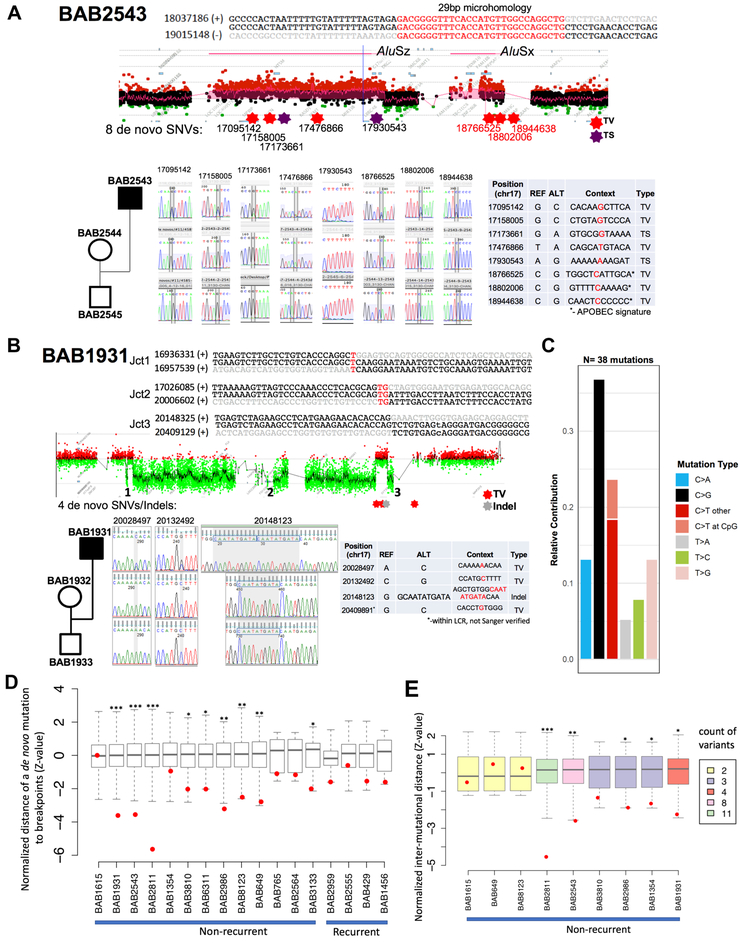
Figure 4-. SNVs and indels accompany SV formation.
A) BAB2543 carries two duplications in an inverted orientation separated with a copy-neutral segment (DUP-NML-DUP/INV). Breakpoint junction (jct) 1 maps to inverted SMSREP LCRs, and evaded sequencing attempts. Breakpoint jct 2 was mediated by inverted Alu repeats and forms an Alu-Alu chimera; junction sequence is characterized by 29 bp of microhomology. Eight de novo mutations have also been characterized within 17p11.2; Sanger sequencing electropherogram confirming each SNV is shown along with the location, genomic context and type. B) BAB1931 carries three deletions interspersed with copy-neutral segments (DEL-NML-DEL-NML-DEL). SV breakpoints display one, two and zero bp of microhomology at the junctions, and jct3 was previously uncharacterized. The four de novo SNVs and indels present in the proband and Sanger sequencing electropherogram confirmation are depicted below. The SNV at 20409881 was not independently confirmed by using a PCR/Sanger sequencing strategy due to its presence within an LCR; however, it was observed in both Illumina and PacBio sequencing data and shown to be de novo in the trio Illumina sequencing data. C) Plot shows the relative contribution of each SNV transition and transversion observed de novo in the non-recurrent individuals. Overall abundance of C>G mutations can be readily observed. D) Enrichment of de novo SNVs in proximity to SV breakpoints was observed in the genomes of 9 out of 13 subjects with non-recurrent SV. This enrichment was not observed for de novo SNVs (N=4) detected in the subjects carrying recurrent SVs. The normalized statistics (Z-value) for each simulation and observation (red dot) is displayed with the box plots. E) Mutational clustering was examined in individuals with more than one de novo SNV. SNV mutations show statically significant clustering in 5 out of 9 NR rearrangements. The normalized statistics (Z-value) for each simulation and the observation (red dot) are plotted. The box plots were colored according to the number of de novo mutations detected in each subject. (*) P ≤ 0.05; (**) P ≤ 0.01; (***) P ≤ 0.001. See also STAR Methods, Figure S2 and Data S1.

