

Abstract
Background
The effect of vitamin D supplementation on postural muscles of the trunk is of particular interest because low 25‐hydroxyvitamin D [25(OH) D] levels are associated with decreased postural balance and increased risk of falls. Understanding the role of vitamin D supplementation plays in trunk muscle function of older adults is necessary, as this is a potentially modifiable factor to improve postural muscle function and decrease the risk of falling of older adults. The objective of this randomized controlled trial was to evaluate the effect of 12 months of vitamin D supplementation compared with placebo, on morphology and function of the trunk muscles of adults aged 50 to 79 years with low serum 25(OH) D levels.
Methods
This was a secondary analysis of a randomized, placebo‐controlled, and double‐blind clinical trial conducted between June 2010 and December 2013 in Tasmania, Australia. The clinical trial was registered with the Australian New Zealand clinical trial registration agency, ClinicalTrials.gov identifier: NCT01176344; Australian New Zealand Clinical Trials Registry: ACTRN 12610000495022. Participants were aged 50–79 years with ongoing symptoms of knee osteoarthritis and with low serum [25(OH) D] (12.5 to 60 nmol/L, 5.2 to 24 ng/mL). Participants were randomly assigned to either monthly 50 000 IU oral vitamin D3 (n = 104) or an identical placebo (n = 113) for 24 months as per clinical trial protocol. The primary outcomes in this pre‐specified secondary analysis were between‐group differences in change in size of rectus abdominis, transversus abdominis, internal oblique, external oblique, and lumbar multifidus muscles and function (assessed by change in thickness on contraction) of these muscles (excepting rectus abdominis) from baseline to 12 months. Muscle size was assessed using ultrasound imaging.
Results
Of 217 participants (mean age 63 years, 48% women), 186 (85.7%) completed the study. There were no significant between‐group differences in change in size or function of the abdominal or multifidus muscles after 12 months of vitamin D supplementation.
Conclusions
A monthly dose of 50 000 IU of vitamin D3 alone for 12 months does not affect the size or ability to contract trunk muscles of independent community‐dwelling older adults with symptomatic knee osteoarthritis and low serum 25(OH) D levels regardless of body mass index status or degree of vitamin D deficiency. An effect of vitamin D supplementation on other aspects of trunk muscle function such as strength, power, or physical function cannot be ruled out.
Keywords: Randomized controlled trial, Vitamin D supplementation, Postural trunk muscles, Muscle size and function, Older adults, Ultrasound imaging
Introduction
Population levels of serum 25‐hydroxyvitamin D [25(OH) D] are variable around the world, but deficiency is common in older adults due to decreased sun exposure, decreased production of vitamin D in the skin, insufficient intake of vitamin D in their diet, and institutionalization.1, 2, 3, 4 Mean population 25(OH) D levels commonly fall below 50 nmol/L (20 ng/mL), which is considered to be the minimum target level for adequate bone health, mineral homeostasis, and muscle function.4, 5, 6
Common clinical presentations of severe vitamin D deficiency include bone pain, gait disturbances, and muscle weakness, especially of proximal muscles of the upper and lower limbs and muscles of the trunk.7 Previous research has found that vitamin D plays a vital role in muscle development and growth.8 The mechanism may be through 1,25(OH)2 binding to a specific vitamin D receptor found in skeletal muscle9, 10 leading to de novo protein synthesis and thus muscle cell proliferation and growth.11, 12 Furthermore, a review of randomized controlled trials (RCTs) has examined the effect of vitamin D supplementation on several aspects of muscle function including lower limb strength, handgrip, postural balance, gait speed, and physical performance (timed‐up‐and‐go test).13 Even though evidence in this review was conflicting, 7 of 11 studies demonstrated beneficial effects, as has another published RCT.14 A more recent systematic review and meta‐analysis of 30 RCTs by Beaudart et al.15 found small but significant positive effects of vitamin D supplementation on lower limb muscle strength, although there were no effects on muscle mass or power. Thus, there is both a biological basis and clinical trial evidence for considering that correcting vitamin D deficiency may improve muscle strength and function.
Muscles of the trunk, particularly the abdominal and lumbar multifidus muscles (MF), are postural muscles tonically active during daily upright activities16 and essential for the stability of the spine, balance, and posture.17, 18, 19 Trunk muscle size is correlated with strength,20, 21 and among older adults, trunk muscle strength has been found to be associated with mobility and falls.22, 23 The effect of vitamin D supplementation on muscles of the trunk is of particular interest because low 25(OH) D levels are associated with decreased postural balance13 and increased risk of falls in older adults.24 Consequently, vitamin D supplementation has the potential to be a relatively cheap intervention to improve postural muscle function and decrease the risk of falling among older adults. Despite this, to our knowledge, the effects of vitamin D supplementation on trunk muscles have not been assessed previously. Therefore, the objective of this RCT was to evaluate the effect of 12 months of vitamin D supplementation compared with placebo, on morphology and function of the trunk muscles of adults aged 50 to 79 years with low serum 25(OH) D levels.
Methods
Trial design
The Vitamin D Effect on Osteoarthritis (VIDEO) study was a randomized, placebo‐controlled, and double‐blind clinical trial conducted between June 2010 and December 2013, with the main objectives of determining if vitamin D supplementation could reduce knee cartilage volume loss, prevent progression of knee structural abnormalities, improve lower limb muscle strength, and alter the progression of knee pain.25, 26 The protocol for VIDEO and its pre‐specified analyses have been published.25 This pre‐specified secondary analysis investigating the effects of vitamin D supplementation on the size of abdominal and lumbar MF muscles over 12 months was undertaken in one of the two VIDEO sites, namely, Hobart, Tasmania, Australia. VIDEO was registered with the Australian New Zealand clinical trial registration agency, ClinicalTrials.gov identifier: NCT01176344; Australian New Zealand Clinical Trials Registry: ACTRN 12610000495022.25 The clinical trial and sub‐studies were conducted following the Note for Guidance on Good Clinical Practice (CPMP/ICH/135/95) and the 2007 Australian National Statement on Ethical Conduct in Human Research.
Participants
Participants were recruited through advertisements in the local media and community groups, and referrals from general practitioners, specialist rheumatologists, and orthopaedic surgeons. Inclusion and exclusion criteria are described in detail in the published clinical trial protocol.25 In brief, participants were people aged 50–79 years, with ongoing symptoms of knee osteoarthritis for at least 6 months with pain levels between 20 and 80 mm on a 100 mm visual analogue scale and serum 25(OH) D levels between 12.5 and 60 nmol/L (5.2 to 24 ng/mL). Exclusion criteria included severe radiographic knee osteoarthritis, severe pain on standing, hypersensitivity to vitamin D, any condition affecting oral drug absorption, and anticipated need for knee or hip surgery within the next 2 years. Ethics approval was received from The Tasmania Health and Human Ethics Committee (reference number H1040). Written informed consent was obtained from all participants.
Randomization and blinding
Participants were randomly assigned to a vitamin D or a placebo group using computer‐generated allocation with a 1:1 ratio. Allocation concealment was ensured by using a central automated process independent of the investigators. Participants, investigators, and research coordinators were all blinded to the treatment allocation. Blinding both for the main study and for the trunk muscle outcomes was maintained until all data were collected, cleaned, and confirmed for accuracy and statistical analyses were completed.
Interventions
Participants in the treatment group were given one 50 000 IU (1.25 mg) vitamin D3 (cholecalciferol) capsule per month, for 24 months. Participants in the control group were given an identical inert placebo. The vitamin D3 compound and inert placebo were acquired from Nationwide Compounding Pharmacy, Melbourne, Australia.25
Outcomes
Primary outcome measures in this pre‐specified secondary analysis were between‐group differences in change in muscle morphology: (i) changes in muscle thickness of the abdominal muscles [rectus abdominis (RA), transversus abdominis (TrA), internal oblique, and external oblique] and the lumbar MF muscles; (ii) changes in cross sectional area (CSA) of the MF muscles; and (iii) changes in muscle thickness with contraction of the abdominal muscles (except RA) and the MF muscles from baseline to 12 months.
Image capture and measurement
Ultrasound muscle images were taken using a Phillips HDI 5000 ultrasound machine (Bothwell, WA, USA) in brightness mode (B‐mode) with a handheld 4–7 MHz broadband curved array transducer. Image capture and measurement of the abdominal wall and MF muscles were undertaken following previously published protocols.27, 28, 29, 30, 31, 32, 33, 34, 35, 36 The ultrasound imaging (USI) assessments were conducted by a physical therapist who undertook 36 h of practical training in USI at the beginning of the project.
Muscles of the abdominal wall were imaged in transverse section. Participants were positioned in supine lying, with a pillow under their knees.28, 30 To elicit a voluntary contraction of the abdominal wall, participants were asked to ‘take a relaxed breath in and out, hold your breath out, and then draw in your lower abdomen without moving your spine’.28 The RA muscles were only imaged at rest, and the transversus abdominis, internal oblique, and external oblique muscles were imaged at rest and on contraction.30
Imaging of the lumbar MF muscles was performed with participants positioned in prone lying, with a pillow placed under their abdomen to reduce lumbar lordosis.31, 32, 34 Images of the lumbar MF muscles were captured both at rest (in the transverse plane) and during contraction (in the parasagittal plane). Instructions for the isometric contraction were ‘take a relaxed breath in and out, hold your breath out and try to slowly “swell” and contract the muscle without moving the spine’.37
Ultrasound images were stored and later analysed offline by a single examiner using a software package (Image J Image Processing and Analysis, version IJ 1.46r, http://imagej.nih.gov/ij/). The thickness of the abdominal muscles was measured as the perpendicular distance between the superior and inferior hyperechoic muscle fascias at approximately the middle of the image identified using the software's Cartesian coordinates.28 The CSA of the MF muscle was measured by tracing around the inner edge of the fascial boundaries of the muscle,27, 31 and the thickness of the MF muscle was measured from the tip of the zygapophyseal joint to the inferior fascial edge of the superior border of the muscle.34 Intraclass correlation coefficients (ICC) for abdominal and MF muscle measurements were ICC = > 0.85 for interrater USI image measurement reliability35 and ICC = 0.74–0.98 for test–retest reliability.36
Other factors
Height was measured by stadiometer to the nearest 0.1 cm (Leicester Height Measure, Invicta Plastics Ltd, Leicester, UK). Weight was measured by calibrated scales (Heine S‐7307, Heine, New Hampshire, USA) and body mass index (BMI) was calculated [weight (kg)/height (m2)]. Knee pain scores were obtained using a visual analogue pain scale in 100 mm, assessing pain during walking, using stairs, in bed, sitting or lying, and standing. The total pain score was calculated as the sum of the five items (range 0–500).38 Total Western Ontario and McMaster Universities Osteoarthritis Index (WOMAC) score was calculated as the sum of the scores in each of its subscales that included pain, stiffness, and physical function. Missing data were managed according to the WOMAC user guide.38 Physical activity was measured using the short version of the International Physical Activity Questionnaire (IPAQ) instrument. Data were collected on vigorous and moderate activity as well as walking and sitting, but data on sitting were not used in the analysis. Total IPAQ scores were calculated according to published guidelines.39, 40 Current low back pain status was assessed by a questionnaire asking ‘do you currently have any pain in your back?’, and pain scores were obtained using a Visual Analogue Scale (0–100 mm). History of back surgery, abdominal surgery, and medications were obtained by questionnaire. Leg strength measures to the nearest kilogram were obtained for both legs simultaneously using a dynamometer (TTM Muscular Meter, Tokyo, Japan) as described by Scott et al.41 This is an isometric strength muscle test, predominantly for the quadriceps and hip extensor muscles. Grip strength was assessed with a Hydraulic hand‐held dynamometer.
25‐Hydroxyvitamin D
Serum 25(OH) D was assayed at screening, 3 and 24 months. Blood samples were centrifuged after standing for 10 min at room temperature and the resultant serum frozen at −80°C until assayed using direct competitive chemiluminescent immunoassays (DiaSorin Inc.). The intraassay and interassay coefficients of variation were 3.2% and 6.0%.26
Sample size
Calculations were based on the standard deviations reported by Rankin et al.30 for the thickness of the abdominal muscles and by Wallwork et al.42 for thickness and CSA of the lumbar multifidus. Correlations between measurements and remeasurement of r = 0.9 for abdominal muscle thickness, r = 0.5 for multifidus thickness, and r = 0.7 for multifidus CSA were observed in our reliability study.36 On that basis, this study of projected size 200 subjects (100 in each arm) would have 80% power to detect between‐group differences of 0.02 to 0.05 cm for change in abdominal muscle thickness, 0.20 to 0.21 cm for change in multifidus thickness, and 0.28 to 0.40 cm2 for change in multifidus CSA.
Statistical analysis
As summary measures of their distributions, means and standard deviations were used for continuous measures, and percentages and frequencies were used for categorical factors. Random intercept linear mixed models were used to estimate the change between baseline and follow‐up in both treatment arms, and the difference in change for the treatment groups, in this intention‐to‐treat analysis. The models included binary terms for side (left or right) in measurements of muscle thickness and CSA and for state (relaxed or contracted) of muscle thickness. Changes in muscle morphology, that is thickness and CSA in the relaxed state, and change in function (assessed by changes in muscle thickness on contraction) were compared for each group of participants. Because there was no statistically significant differences between the two sides for either group, the means of the right and left muscle sizes were used in the analysis. In additional analyses, adjustments were made for age, sex, and BMI (pre‐specified in the protocol) and for additional factors that were potential confounders and for which there was an imbalance between the treatment arms. Only the adjustment for lower limb strength resulted in a marked change in the estimated effect of the intervention (Table 1). To test for interaction by serum 25(OH) D status at baseline, a binary term generated using a serum 25(OH) D cut‐point of 25 nmol/L (10 ng/mL) was included as a covariate and as a component of a product term in the regression model. Similarly, testing for interaction by BMI category [normal (≤25 kg/m2), overweight (>25 to <30 kg/m2), and obese (≥30 kg/m2)] was performed. The step‐down procedure of Holm43 was used to control the family‐wise error rate (Table 3). Statistical analyses were performed using Stata (Version 14.0, Stata Corporation, TX, USA), and a two‐sided P‐value of 0.05 was deemed statistical significance.
Table 1.
Baseline characteristics of vitamin D and placebo groups
| Vitamin D (N = 104) | Placebo (N = 113) | |
|---|---|---|
| Male sex: % (n/N) | 53 (55/104) | 51 (58/113) |
| Age (years) | 63.7 (7.4) | 63.0 (7.3) |
| Weight (kg) | 84.4 (15.5) | 84.4 (15.1) |
| Height (cm) | 169.1 (10.2) | 170.0 (9.7) |
| BMI (kg/m2) | 29.5 (5.3) | 29.5 (4.5) |
| BMI ≤25 kg/m2: % (n/N) | 15 (16/104) | 11 (12/113) |
| BMI >25 to <30 kg/m2: % (n/N) | 47 (49/104) | 43 (49/113) |
| BMI ≥30 kg/m2: % (n/N) | 38 (39/104) | 46 (52/113) |
| 25‐hydroxyvitamin D (nmol/L) | 42.5 (12.0) | 43.9 (12.1) |
| Total knee WOMAC score (0–2400) | 576.3 (394.9) | 571.7 (373.3) |
| Pain (0–500) | 121.3 (88.3) | 122.7 (84.5) |
| Stiffness (0–200) | 52.6 (41.9) | 58.1 (40.5) |
| Function (0–1700) | 402.4 (287.0) | 390.9 (274.7) |
| Physical activity—IPAQ score | 3628.9 (4762.0) | 3057.6 (3054.0) |
| Current low back pain: % (n/N) | 39 (41/104) | 34 (38/113) |
| Current low back pain—VAS score | 28.0 (19.3) | 28.3 (22.0) |
| History of low back surgery: % (n/N) | 6 (6/104) | 11.0 (12/113) |
| History of abdominal surgery: % (n/N) | 55 (57/104) | 50 (56/113) |
| Medication: Statins; % (n/N) | 6.7 (7/104) | 12.0 (13/113) |
| Lower limb strength (kg) | 67.1 (42.9) | 70.0 (44.8) |
| Grip strength: right (kg) | 30.7 (12.3) | 30.8 (11.0) |
| Grip strength: left (kg) | 29.7 (12.0) | 29.7 (11.1) |
All results reported mean (standard deviation) or % (n/N) where indicated. BMI, body mass index; IPAQ, International Physical Activity Questionnaire (MET‐min/week); VAS, visual analogue scale (0–100 where 0 = no pain and 100 = very worst pain); WOMAC, Western Ontario and McMaster Universities Osteoarthritis Index.
Table 3.
Between‐group differences in changes in relaxed abdominal muscle thickness (cm) and in change in muscle thickness with contraction from baseline to follow‐up with and without adjustment for relevant factors
| Adjusted for | |||
|---|---|---|---|
| Muscle | Unadjusted model | Age + Sex + BMI | Age + Sex + BMI + Leg strength |
| RA | 0.007 (−0.015, 0.029) | 0.010 (−0.012, 0.032) | 0.009 (−0.015, 0.032) |
| TrA (relaxed) | −0.007 (−0.027, 0.013) | −0.004 (−0.024, 0.016) | −0.007 (−0.029, 0.014) |
| TrAa | −0.005 (−0.028, 0.019) | −0.004 (−0.028, 0.019) | −0.004 (−0.030, 0.021) |
| IO (relaxed) | −0.017 (−0.058, 0.024) | −0.013 (−0.054, 0.028) | −0.010 (−0.054, 0.034) |
| IOa | −0.024 (−0.068, 0.020) | −0.022 (−0.066, 0.022) | −0.021 (−0.069, 0.026) |
| EO (relaxed) | −0.010 (−0.032, 0.126) | −0.008 (−0.030, 0.015) | −0.010 (−0.034, 0.013) |
| EOa | 0.007 (−0.019, 0.034) | 0.006 (−0.021, 0.034) | 0.011 (−0.017, 0.040) |
All measures are in cm and are reported as mean (confident interval). EO, external oblique; IO, internal oblique; RA, rectus abdominis; TrA, transversus abdominis.
Absolute change in muscle thickness with contraction calculated as (thickness when contracted – thickness when relaxed).
Statistically significant P < 0.05.
Results
Of the 422 potential VIDEO participants screened at the Hobart site, 265 were randomized and assigned to the treatment or placebo groups. Of these, 104 participants in the treatment group (39.3%) and 113 participants in the placebo group (42.6%) had images of their trunk muscles taken at baseline for this sub‐study. Ninety‐five and 91 participants had trunk muscle images taken at follow‐up 1 year later in the treatment and placebo groups, respectively (Figure 1).
Figure 1.
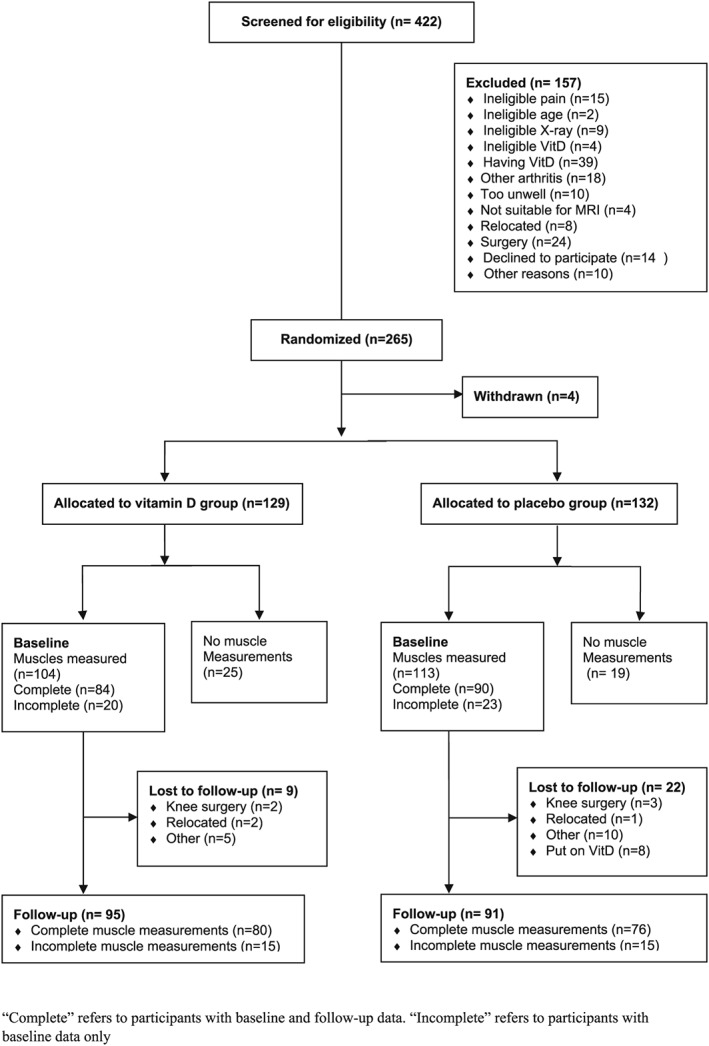
Flowchart of participation.
Table 1 summarizes the baseline characteristics of participants in the treatment and placebo groups in this sub‐study. The groups were reasonably well matched, with some difference in proportions for gender, low back pain, history of abdominal surgery, statins use, and lower limb strength. Overall knee pain scores measured by the WOMAC were in the low ranges (122/500), while physical activity levels measured by the IPAQ were in the higher ranges (>3000 MET‐min/week).40 Mean serum 25(OH) D levels in the vitamin D group increased by 39.3 nmol/L (15.6 ng/mL) and 44.5 nmol/L (18.0 ng/mL) at 3 and 24 months respectively, compared with an initial increase of 17.6 nmol/L (7.2 ng/mL) at 3 months and a total increase of 6.8 nmol/L (2.8 ng/mL) at 24 months in the placebo group. There were no baseline differences between the participants in this sub‐study and the entire VIDEO cohort (n = 413).26 The BMI of the study population was relatively high (over 85% were overweight or obese). In the 172 participants of this USI sub‐study who had serum 25(OH) D measured at 24 months, increase in serum 25(OH) D levels from baseline to 24 months in overweight (>25 to <30 kg/m2) and obese participants (≥30 kg/m2) was 8.7 nmol/L (3.6 ng/mL) and 5.2 nmol/L (2.0 ng/mL) lower, than those participants with normal BMI (≤25 kg/m2). In fact, 76% of the treatment group achieved serum 25(OH) D levels ≥75 nmol/L (≥30 ng/mL) by 24 months compared with only 7% of the placebo group, the former including 25/33 (76%) of obese and 22/33 (67%) of overweight treatment arm participants.
The between‐group treatment effects for trunk muscle size and change in thickness with contraction were small (less than 4% in each muscle), inconsistent in direction, and not statistically significant (Tables 2 and 3). Adjusting for age, sex, and BMI did not change these results (Tables 4 and 5). While additional adjustment for leg strength increased the effect size for multifidus thickness at the L2/L3, L3/L4, and L4/L5 vertebral levels, the only between‐group difference that was statistically significant after controlling for family‐wise error was at the L2/L3 vertebral level and the effect size (3.5%) remained small (Table 5). Results were similar after further adjustments for statin use, current low back pain, and history of abdominal or back surgery. There were not significant within‐group differences in trunk muscle size or function over 12 months in either group. There were no interactions between treatment effect and either baseline 25(OH) D status or BMI in adjusted analyses for any muscle measure (all P < 0.05).
Table 2.
Changes in relaxed abdominal muscle thickness (cm) and in change in muscle thickness with contraction from baseline to follow‐up by intervention group
| Vitamin D group | Placebo Group | Between‐group differences in change | |||||
|---|---|---|---|---|---|---|---|
| Muscle | Baseline | Follow‐up | Change | Baseline | Follow‐up | Change | |
| RA | 0.827 (0.019) | 0.845 (0.019) | 0.017 (0.008) | 0.850 (0.018) | 0.860 (0.018) | 0.010 (0.008) | 0.007 (0.011) |
| TrA (relaxed) | 0.380 (0.011) | 0.390 (0.012) | 0.011 (0.007) | 0.409 (0.011) | 0.427 (0.011) | 0.018 (0.007) | −0.007 (0.010) |
| TrAa | 0.168 (0.009) | 0.187 (0.009) | 0.018 (0.008)* | 0.153 (0.008) | 0.176 (0.009) | 0.023 (0.009)* | −0.005 (0.012) |
| IO (relaxed) | 0.775 (0.024) | 0.752 (0.025) | −0.023 (0.015) | 0.851 (0.023) | 0.845 (0.024) | −0.006 (0.015) | −0.017 (0.021) |
| IOa | 0.221 (0.019) | 0.243 (0.019) | 0.015 (0.016) | 0.203 (0.018) | 0.243 (0.019) | 0.039 (0.016)* | −0.024 (0.022) |
| EO (relaxed) | 0.431 (0.013) | 0.432 (0.013) | 0.001 (0.008) | 0.451 (0.012) | 0.462 (0.013) | 0.011 (0.008) | −0.010 (0.011) |
| EOa | 0.075 (0.009) | 0.091 (0.010) | 0.016 (0.010) | 0.085 (0.009) | 0.093 (0.010) | 0.009 (0.010) | 0.007 (0.014) |
All measures are in cm and are reported as mean (standard error). EO, external oblique; IO, internal oblique; RA, rectus abdominis; TrA, transversus abdominis.
Absolute change in muscle thickness with contraction, calculated as (thickness when contracted – thickness when relaxed).
Statistically significant P < 0.05
Table 4.
Changes in relaxed multifidus muscle thickness (cm), changes in muscle thickness with contraction, and in changes cross sectional area (cm2) from baseline to follow‐up by intervention group
| Vitamin D group | Placebo group | Between‐group differences in change | |||||
|---|---|---|---|---|---|---|---|
| Muscle | Baseline | Follow‐up | Change | Baseline | Follow‐up | Change | |
| Muscle thickness | |||||||
| L2/L3_MF (relaxed) | 2.646 (0.046) | 2.649 (0.047) | 0.003 (0.043) | 2.670 (0.044) | 2.580 (0.047) | −0.090 (0.043) | 0.092 (0.060) |
| L2/L3_MFa | 0.140 (0.018) | 0.115 (0.018) | −0.025 (0.019) | 0.167 (0.017) | 0.142 (0.018) | −0.025 (0.019) | −0.000 (0.026) |
| L3/L4_MF (relaxed) | 2.331 (0.043) | 2.428 (0.044) | 0.097 (0.036)* | 2.339 (0.041) | 2.409 (0.043) | 0.070 (0.036) | 0.027 (0.051) |
| L3/L4_a | 0.134 (0.018) | 0.129 (0.018) | −0.005 (0.021) | 0.145 (0.017) | 0.124 (0.018) | −0.020 (0.021) | 0.015 (0.029) |
| L4/L5_MF (relaxed) | 2.864 (0.048) | 2.817 (0.049) | −0.047 (0.045) | 2.913 (0.046) | 2.842 (0.049) | −0.071 (0.046) | 0.024 (0.064) |
| L4/L5_MFa | 0.168 (0.018) | 0.160 (0.019) | −0.008 (0.019) | 0.184 (0.018) | 0.180 (0.019) | −0.005 (0.019) | −0.003 (0.027) |
| L5/S1_MF (relaxed) | 2.744 (0.049) | 2.863 (0.051) | 0.119 (0.044)* | 2.758 (0.047) | 2.925 (0.050) | 0.167 (0.045)* | −0.048 (0.063) |
| L5/S1_MFa | 0.138 (0.019) | 0.153 (0.020) | 0.015 (0.021) | 0.170 (0.018) | 0.178 (0.020) | 0.008 (0.021) | 0.007 (0.030) |
| Cross sectional area | |||||||
| L2_MF_CSA | 2.670 (0.054) | 2.858 (0.055) | 0.188 (0.027) | 2.654 (0.052) | 2.908 (0.053) | 0.254 (0.027) | −0.066 (0.038) |
| L3_MF_CSA | 3.500 (0.061) | 3.830 (0.062) | 0.330 (0.037) | 3.423 (0.058) | 3.774 (0.060) | 0.350 (0.038) | −0.021 (0.053) |
| L4_MF_CSA | 4.416 (0.068) | 4.831 (0.069) | 0.415 (0.038) | 4.230 (0.065) | 4.708 (0.067) | 0.478 (0.039) | −0.063 (0.054) |
| L5_MF_CSA | 5.211 (0.081) | 5.519 (0.082) | 0.307 (0.048) | 4.979 (0.077) | 5.399 (0.080) | 0.420 (0.049) | −0.112 (0.068) |
All measures are in cm and are reported as mean (standard error). CSA, cross sectional area; MF, multifidus muscle.
Absolute change in muscle thickness with contraction calculated as (thickness when contracted – thickness when relaxed).
Statistically significant P < 0.05.
Table 5.
Between‐group differences in change in relaxed multifidus muscle thickness (cm) and in change in muscle thickness with contraction and cross sectional area (cm2) from baseline to follow‐up with and without adjustment for relevant factors
| Adjusted for | |||
|---|---|---|---|
| Muscle | Unadjusted model | Age + Sex + BMI | Age + Sex + BMI + Leg strength |
| Muscle thickness | |||
| L2/L3_MF (relaxed) | 0.092 (−0.026, 0.211) | 0.115 (−0.004, 0.234) | 0.172 (0.048, 0.296)* |
| L2/L3_MFa | −0.000 (−0.052, 0.051) | −0.115 (−0.054, 0.051) | −0.176 (−0.073, 0.037) |
| L3/L4_MF (relaxed) | 0.027 (−0.073, 0.127) | 0.038 (−0.063, 0.139) | 0.054 (−0.052, 0.161) |
| L3/L4_MFa | 0.015 (−0.042, 0.072) | 0.017 (−0.041, 0.074) | −0.001 (−0.062, 0.060) |
| L4/L5_MF (relaxed) | 0.024 (−0.102, 0.150) | 0.050 (−0.076, 0.176) | 0.089 (−0.045, 0.222) |
| L4/L5_MFa | −0.003 (−0.056, 0.050) | 0.003 (−0.049, 0.056) | 0.025 (−0.054, 0.059) |
| L5/S1_MF (relaxed) | −0.048 (−0.172, 0.076) | −0.028 (−0.152, 0.096) | −0.015 (−0.146, 0.117) |
| L5/S1_MFa | 0.007 (−0.052, 0.066) | 0.015 (−0.043, 0.073) | 0.017 (−0.044, 0.078) |
| Cross sectional area | |||
| L2_MF_CSA | −0.066 (−0.142, 0.009) | −0.059 (−0.135, 0.017) | −0.060 (−0.140, 0.020) |
| L3_MF_CSA | −0.021 (−0.125, 0.083) | −0.016 (−0.120, 0.089) | 0.039 (−0.069, 0.147) |
| L4_MF_CSA | −0.063 (−0.169, 0.043) | −0.062 (−0.168, 0.045) | −0.041 (−0.148, 0.067) |
| L5_MF_CSA | −0.112 (−0.246, 0.022) | −0.129 (−0.260, 0.003) | −0.120 (−0.259, 0.019) |
All measures are in cm, and are reported as mean (standard error). CSA, cross sectional area; MF, multifidus muscle.
Absolute change in muscle thickness with contraction calculated as (thickness when contracted – thickness when relaxed).
Statistically significant P < 0.05.
Adverse events
A description of adverse events for the full clinical trial has been reported previously.26 In this sub‐study, 44 (42%) out of 104 participants in the vitamin D group reported adverse events compared with 30 (27%) out of 113 participants in the placebo group (Table 6). Two cases of hypercalcaemia were reported in each group. One instance of hyperthyroidism and two episodes of renal calculus were reported in the vitamin D group.26
Table 6.
Adverse events
| Vitamin D | (N = 104) | Placebo | (N = 113) | |
|---|---|---|---|---|
| No. of participants | (%) | No. of participants | (%) | |
| Serious adverse events | ||||
| Death | 1 | (1.0) | 0 | (0.0) |
| Malignancy | 2 | (1.9) | 2 | (1.8) |
| Coronary artery disease | 1 | (1.0) | 1 | (0.9) |
| Severe infection | 0 | (0.0) | 1 | (0.9) |
| Major depression | 1 | (1.0) | 0 | (0.0) |
| Nephrolithiasis | 1 | (1.0) | 1 | (0.9) |
| Hospitalization | 1 | (1.0) | 0 | (0.0) |
| Adverse events | ||||
| Hypercalcaemia | 2 | (1.9) | 2 | (1.8) |
| Hyperparathyroidism | 1 | (1.0) | 0 | (0.0) |
| Renal | 2 | (1.9) | 0 | (0.0) |
| Falls | 2 | (1.9) | 0 | (0.0) |
| Musculoskeletal | 1 | (1.0) | 1 | (0.9) |
| Neurological | 1 | (1.0) | 1 | (0.9) |
| Gastrointestinal | 1 | (1.0) | 3 | (2.7) |
| Respiratory | 2 | (1.9) | 1 | (0.9) |
| Ocular | 1 | (1.0) | 1 | (0.9) |
| Infection | 4 | (3.9) | 2 | (1.8) |
| Cardiac arrhythmia | 1 | (1.0) | 0 | (0.0) |
| Chest pain | 4 | (3.9) | 4 | (3.5) |
| Pain | 6 | (5.8) | 2 | (1.8) |
| Allergy/immunology | 0 | (0.0) | 2 | (1.8) |
| Other eventsa | 9 | (8.7) | 6 | (5.3) |
Including headache, lethargy, flu symptoms, and other events.
Discussion
To our knowledge, this is the first RCT investigating the effect of vitamin D supplementation on the morphology of key postural trunk muscles of older adults. Apart from the thickness of the MF muscles at the L2–L3 vertebral level, there were no statistically significant differences in change in muscle thickness or CSA between the vitamin D and placebo groups, and all effect sizes were small and not clinically significant. The results suggest that vitamin D supplementation alone is not an effective means to improve or maintain trunk muscle size over time for adults aged 50–79 years, even for those individuals with moderate to severe deficiency.
The purpose of this study was to determine whether vitamin D supplementation alone had beneficial effects in maintaining or improving trunk muscle size and function. In the present study, the within‐group changes in trunk muscle size and function over time were all very small. Despite there being plausible reasons to hypothesize that vitamin D supplementation could improve trunk muscle size, our results suggest that increases or maintenance of muscle size or function of older adults cannot be expected from vitamin D supplementation alone, at least over the limited timeframe of 1 year. In peripheral muscles, two systematic reviews reported positive effects of vitamin D supplementation on muscle strength in older adults with baseline 25(OH) D < 30 nmol/L (<12 ng/mL).15, 44 However, in our study of trunk muscles, the response to supplementation did not vary between people with moderate to severe deficiency 25(OH) D (<25 nmol/L, <10 ng/mL) at baseline and those with 25(OH) D levels above this level. Thus, even in people with this degree of deficiency, vitamin D supplementation does not improve trunk muscle size or muscle function as assessed by change in muscle thickness during submaximal contraction.
While there is no consensus on the amount of variation in trunk muscle size required to ascertain clinically meaningful changes in these muscles,30 previous studies investigating the effect of exercise programmes on trunk muscles in people with low back pain have found interventions that increased muscle size were associated with decreases in pain.37, 45, 46 The changes in muscle sizes observed in those studies were larger than those seen in our study, for example, being over 5% for measures of the multifidus and transversus abdominis muscles at rest.37, 45 Thus, exercise programmes or a combination of exercise and functional activities that target trunk muscles may be more effective in improving these muscles than vitamin D supplementation alone.
The effects of vitamin D supplementation on peripheral muscle strength, mass, and power have been examined in a systematic review and meta‐analysis.15 The studies in this review administered a wide range of vitamin D doses (as low 300 IU/day, up to intermittent doses equivalent to around 8600 IU/day). For muscle strength, there was a small but statistically significant positive effect of vitamin D supplementation on lower limb muscle strength [19 studies in 2349 people; vitamin D dose range 400–8600 IU; standard mean difference = 0.19 (95% CI 0.05–0.34)]. However, there was no statistically significant effect of vitamin D supplementation neither on grip strength (16 studies, doses 400–8600 IU/day) nor on muscle mass (six studies, n = 538, doses 300–4000 IU/day) or power (five studies, n = 245, doses 400–4000 IU/day). The latter is consistent with the lack of effect on muscle size observed in the current study, but as trunk muscle strength and power were not measured in our study, it remains to be determined whether vitamin D supplements affect strength or power in trunk muscles.
Previous studies have reported improvements in measures of functional mobility (walking test and ‘timed up and go’ test) and reduced risk of falls with vitamin D supplementation of older adults.24, 47 Although the present study did not investigate the effect of vitamin D supplementation on falls or functional mobility, our results suggest that changes to these outcomes are not mediated by trunk muscle size. The effect of vitamin D supplementation on other aspects of trunk muscle function such as strength cannot be ruled out and should be the focus of future research.
Strengths and limitations
The strength of the current investigation is its design. It is a double‐blind RCT, which provides robust evidence regarding the efficacy of vitamin D supplementation for improving trunk muscle size. Participants in this study were community‐dwelling adults with low serum 25(OH) D. This is the sub‐population most likely to benefit from vitamin D supplementation.
It has limitations nevertheless. While the use of random allocation helps to reduce the possibility of imbalance between the treatment arms, in this case randomization did not produce exact balance. However, we collected information that made it possible to adjust for these factors, and the results of the adjusted analyses did not alter the overall conclusions of the study. While the study sample was on average only mildly deficient, there was no interaction between treatment response and vitamin D status at baseline, suggesting that the results are generalizable to both mildly and moderately deficient people. While our sample size was modest, we powered the study appropriately to detect treatment effects that were likely to be clinically meaningful based on existing literature.37, 45, 48 We are therefore unlikely to have failed to detect any clinically important treatment effects. The majority of participants were either overweight or obese, which could have influenced their serum 25(OH) D response to supplementation. However, participants with high BMI still achieved large increases in 25(OH) D and a much higher proportion of these participants reached levels ≥75 nmol/L (≥30 ng/mL) than in the placebo group. Furthermore, there was no interaction between treatment response and BMI, so the impact of being an obese population on our results was minimal. The lack of any interaction also suggests that our result are generalizable to people with osteoarthritis who are of normal weight. It is possible that mobility restrictions from knee osteoarthritis may have affected participants' ability to improve trunk muscle size. Nevertheless, levels of knee pain in the study were relatively low, functional limitations were modest, and physical activity levels were reasonable, which makes this scenario unlikely. We used a DiaSorin immunoassay method to measure serum 25(OH) D, rather than mass spectrometry which is considered the gold standard. However, mass spectrometry is not readily available in clinical practice, which would affect translation into practice, and a recent study found that the DiaSorin immunoassay achieved acceptable performance when compared with mass spectrometry.49 Our only measure of muscle function was change in muscle thickness with contraction, so we cannot rule out effects of vitamin D supplementation on other aspects of muscle function such as strength, power, physical function, or falls.
Conclusions
There is no evidence that a monthly dose of 50 000 IU of vitamin D3 alone has an effect on the size or ability to contract trunk muscles of independent community‐dwelling older adults with symptomatic knee osteoarthritis and low serum 25(OH) D levels regardless of BMI status or degree of vitamin D deficiency. An effect of vitamin D supplementation on other aspects of trunk muscle function such as strength, power, or physical function cannot be ruled out.
Author contributions
T.M.W., G.J., J.A.H., C.D., F.C., and A.W. were responsible for the conception and design of the study. Project management of study during implementation were carried out by T.M.W., C.D., and G.J.; W.A.C. was in charge of data acquisition. Design of data analysis plan were the responsibility of W.A.C., L.B., J.A.H., M.L.C., and T.M.W. Analysis and interpretation of data were performed by W.A.C., L.B., J.A.H., M.L.C., and T.M.W. Drafting and revisions of manuscript were carried out by W.A.C., L.B., J.A.H., M.L.C., G.J., T.M.W., C.D., F.C., and A.W. All authors approved the final version of the manuscript.
Funding
This study was supported by a grant from the Australian National Health and Medical Research Council. The funder of this study had no involvement in study design, collection of data, interpretation of data, or writing of the report. T.M.W. is supported by an Australian National Health and Medical Research Council/Primary Health Care Research Evaluation and Development Program Career Development Fellowship. C.L.B. is supported by a Career Development Fellowship from the Australian National Health and Medical Research Council. G.J. is supported by an Australian National Health and Medical Research Council Practitioner Fellowship. A.E.W. is supported by an Australian National Health and Medical Research Council Career Development Fellowship (Clinical Level 2).
Conflicts of Interest
All authors declare no conflict of interest.
Trial registration
ClinicalTrials.gov identifier: NCT01176344;
Australian New Zealand Clinical Trials Registry: ACTRN12610000495022. (Data S1).
Protocol
Cao Y, Jones G, Cicuttini F, et al. Vitamin D supplementation in the management of knee osteoarthritis: study protocol for a randomized controlled trial. Trials 2012;13:131. (Data S1).
Authorship statement
The authors certify that they comply with the ethical guidelines for authorship and publishing of the Journal of Cachexia, Sarcopenia, and Muscle.50
Supporting information
Data S1. Supporting information
Cuellar, W. A. , Blizzard, L. , Hides, J. A. , Callisaya, M. L. , Jones, G. , Cicuttini, F. , Wluka, A. E. , Ding, C. , and Winzenberg, T. M. (2019) Vitamin D supplements for trunk muscle morphology in older adults: secondary analysis of a randomized controlled trial. Journal of Cachexia, Sarcopenia and Muscle, 10: 177–187. 10.1002/jcsm.12364.
References
- 1. Bischoff H, Stähelin H, Tyndall A, Theiler R. Relationship between muscle strength and vitamin D metabolites: are there therapeutic possibilities in the elderly? Z Rheumatol 2000;59:I39–I41. [DOI] [PubMed] [Google Scholar]
- 2. Holick MF. McCollum Award Lecture, 1994: vitamin D—new horizons for the 21st century. Am J Clin Nutr 1994;60:619–630. [DOI] [PubMed] [Google Scholar]
- 3. MacLaughlin J, Holick M. Aging decreases the capacity of human skin to produce vitamin D3. J Clin Invest 1985;76:1536–1538. [DOI] [PMC free article] [PubMed] [Google Scholar]
- 4. van Schoor NM, Lips P. Worldwide vitamin D status. Best Pract Res Clin Endocrinol Metab 2011;25:671–680. [DOI] [PubMed] [Google Scholar]
- 5. Nowson CA, McGrath JJ, Ebeling PR, Haikerwal A, Daly RM, Sanders KM, et al. Vitamin D and health in adults in Australia and New Zealand: a position statement. Med J Aust 2012;196:686–687. [DOI] [PubMed] [Google Scholar]
- 6. Ross AC, Manson JAE, Abrams SA, Aloia JF, Brannon PM, Clinton SK, et al. The 2011 report on dietary reference intakes for calcium and vitamin D from the Institute of Medicine: what clinicians need to know. J Clin Endocrinol Metab 2011;96:53–58. [DOI] [PMC free article] [PubMed] [Google Scholar]
- 7. Boland R. Role of vitamin D in skeletal muscle function. Endocr Rev 1986;7:434–448. [DOI] [PubMed] [Google Scholar]
- 8. Endo I, Inoue D, Mitsui T, Umaki Y, Akaike M, Yoshizawa T, et al. Deletion of vitamin D receptor gene in mice results in abnormal skeletal muscle development with deregulated expression of myoregulatory transcription factors. Endocrinology 2003;144:5138–5144. [DOI] [PubMed] [Google Scholar]
- 9. Bischoff H, Borchers M, Gudat F, Duermueller U, Theiler R, Stähelin H, et al. In situ detection of 1, 25‐dihydroxyvitamin D receptor in human skeletal muscle tissue. Histochem J 2001;33:19–24. [DOI] [PubMed] [Google Scholar]
- 10. Simpson R, Thomas G, Arnold A. Identification of 1, 25‐dihydroxyvitamin D3 receptors and activities in muscle. J Biol Chem 1985;260:8882–8891. [PubMed] [Google Scholar]
- 11. Bischoff‐Ferrari HA, Dietrich T, Orav EJ, Hu FB, Zhang Y, Karlson EW, et al. Higher 25‐hydroxyvitamin D concentrations are associated with better lower‐extremity function in both active and inactive persons aged≧ 60 y. Am J Clin Nutr 2004;80:752–758. [DOI] [PubMed] [Google Scholar]
- 12. Ceglia L. Vitamin D and its role in skeletal muscle. Curr Opin Clin Nutr Metab Care 2009;12:628–633. [DOI] [PMC free article] [PubMed] [Google Scholar]
- 13. Rejnmark L. Effects of vitamin D on muscle function and performance: a review of evidence from randomized controlled trials. Ther Adv Chronic Dis 2011;2:25–37. [DOI] [PMC free article] [PubMed] [Google Scholar]
- 14. Gupta R, Sharma U, Gupta N, Kalaivani M, Singh U, Guleria R, et al. Effect of cholecalciferol and calcium supplementation on muscle strength and energy metabolism in vitamin D‐deficient Asian Indians: a randomized, controlled trial. Clin Endocrinol (Oxf) 2010;73:445–451. [DOI] [PubMed] [Google Scholar]
- 15. Beaudart C, Buckinx F, Rabenda V, Gillain S, Cavalier E, Slomian J, et al. The effects of vitamin D on skeletal muscle strength, muscle mass, and muscle power: a systematic review and meta‐analysis of randomized controlled trials. J Clin Endocrinol Metabol 2014;99:4336–4345. [DOI] [PubMed] [Google Scholar]
- 16. Ikezoe T, Mori N, Nakamura M, Ichihashi N. Effects of age and inactivity due to prolonged bed rest on atrophy of trunk muscles. Eur J Appl Physiol 2012;112:43–48. [DOI] [PubMed] [Google Scholar]
- 17. Bergmark A. Stability of the lumbar spine. A study in mechanical engineering. Acta Orthop Scand Suppl 1989;60:1–54. [DOI] [PubMed] [Google Scholar]
- 18. Cioni M, Pisasale M, Abela S, Belfiore T, Micale M. Physiological electromyographic activation patterns of trunk muscles during walking. Open Rehabil J 2010;3:136–142. [Google Scholar]
- 19. Granacher U, Gollhofer A, Hortobágyi T, Kressig RW, Muehlbauer T. The importance of trunk muscle strength for balance, functional performance, and fall prevention in seniors: a systematic review. Sports Med 2013;43:1–15. [DOI] [PubMed] [Google Scholar]
- 20. Anderson DE, Bean JF, Holt NE, Keel JC, Bouxsein ML. Computed tomography‐based muscle attenuation and electrical impedance myography as indicators of trunk muscle strength independent of muscle size in older adults. Am J Phys Med Rehabil 2014;93:553–561. [DOI] [PMC free article] [PubMed] [Google Scholar]
- 21. Shahtahmassebi B, Hebert JJ, Hecimovich MD, Fairchild TJ. Associations between trunk muscle morphology, strength and function in older adults. Sci Rep 2017;7:1–10. [DOI] [PMC free article] [PubMed] [Google Scholar]
- 22. Anderson DE, Quinn E, Parker E, Allaire BT, Muir JW, Rubin CT, et al. Associations of computed tomography‐based trunk muscle size and density with balance and falls in older adults. J Gerontol A Biol Sci Med Sci 2015;71:811–816. [DOI] [PMC free article] [PubMed] [Google Scholar]
- 23. Suri P, Kiely DK, Leveille SG, Frontera WR, Bean JF. Trunk muscle attributes are associated with balance and mobility in older adults: a pilot study. PM R 2009;1:916–924. [DOI] [PMC free article] [PubMed] [Google Scholar]
- 24. Bischoff‐Ferrari HA, Dawson‐Hughes B, Willett WC, Staehelin HB, Bazemore MG, Zee RY, et al. Effect of vitamin D on falls: a meta‐analysis. JAMA 2004;291:1999–2006. [DOI] [PubMed] [Google Scholar]
- 25. Cao Y, Jones G, Cicuttini F, Winzenberg T, Wluka A, Sharman J, et al. Vitamin D supplementation in the management of knee osteoarthritis: study protocol for a randomized controlled trial. Trials 2012;13:131. [DOI] [PMC free article] [PubMed] [Google Scholar]
- 26. Jin X, Jones G, Cicuttini F, Wluka A, Zhu Z, Han W, et al. Effect of vitamin d supplementation on tibial cartilage volume and knee pain among patients with symptomatic knee osteoarthritis: a randomized clinical trial. JAMA 2016;315:1005–1013. [DOI] [PubMed] [Google Scholar]
- 27. Hides JA, Cooper DH, Stokes MJ. Diagnostic ultrasound imaging for measurement of the lumbar multifidus muscle in normal young adults. Physiother Theory Pract 1992;8:19–26. [Google Scholar]
- 28. Hides JA, Miokovic T, Belavy DL, Stanton WR, Richardson CA. Ultrasound imaging assessment of abdominal muscle function during drawing‐in of the abdominal wall: an intrarater reliability study. J Orthop Sports Phys Ther 2007;37:480–486. [DOI] [PubMed] [Google Scholar]
- 29. Koppenhaver SL, Hebert JJ, Fritz JM, Parent EC, Teyhen DS, Magel JS. Reliability of rehabilitative ultrasound imaging of the transversus abdominis and lumbar multifidus muscles. Arch Phys Med Rehabil 2009;90:87–94. [DOI] [PubMed] [Google Scholar]
- 30. Rankin G, Stokes M, Newham DJ. Abdominal muscle size and symmetry in normal subjects. Muscle Nerve 2006;34:320–326. [DOI] [PubMed] [Google Scholar]
- 31. Stokes M, Rankin G, Newham D. Ultrasound imaging of lumbar multifidus muscle: normal reference ranges for measurements and practical guidance on the technique. Man Ther 2005;10:116–126. [DOI] [PubMed] [Google Scholar]
- 32. Teyhen DS, George SZ, Dugan JL, Williamson J, Neilson BD, Childs JD. Inter‐rater reliability of ultrasound imaging of the trunk musculature among novice raters. J Ultrasound Med 2011;30:347–356. [DOI] [PubMed] [Google Scholar]
- 33. Teyhen DS, Gill NW, Whittaker JL, Henry SM, Hides JA, Hodges P. Rehabilitative ultrasound imaging of the abdominal muscles. J Orthop Sports Phys Ther 2007;37:450–466. [DOI] [PubMed] [Google Scholar]
- 34. Wallwork TL, Hides JA, Stanton WR. Intrarater and interrater reliability of assessment of lumbar multifidus muscle thickness using rehabilitative ultrasound imaging. J Orthop Sports Phys Ther 2007;37:608–612. [DOI] [PubMed] [Google Scholar]
- 35. Wilson A, Hides JA, Blizzard L, Callisaya M, Cooper A, Srikanth VK, et al. Measuring ultrasound images of abdominal and lumbar multifidus muscles in older adults: a reliability study. Man Ther 2016;23:114–119. [DOI] [PubMed] [Google Scholar]
- 36. Cuellar WA, Blizzard L, Callisaya ML, Hides JA, Jones G, Ding C, et al. Test‐retest reliability of measurements of abdominal and multifidus muscles using ultrasound imaging in adults aged 50‐79 years. Musculoskelet Sci Pract 2017;28:79–84. [DOI] [PubMed] [Google Scholar]
- 37. Hides JA, Stanton WR, McMahon S, Sims K, Richardson CA. Effect of stabilization training on multifidus muscle cross‐sectional area among young elite cricketers with low back pain. J Orthop Sports Phys Ther 2008;38:101–108. [DOI] [PubMed] [Google Scholar]
- 38. Bellamy N. WOMAC Osteoarthritis Index: user guide IV. 2000.
- 39. Craig CL, Marshall AL, Sjostrom M, Bauman AE, Booth ML, Ainsworth BE, et al. International Physical Activity Questionnaire: 12‐country reliability and validity. Med Sci Sports Exerc 2003;35:1381–1395. [DOI] [PubMed] [Google Scholar]
- 40. Committee IR. Guidelines for data processing and analysis of the International Physical Activity Questionnaire (IPAQ)—short and long forms. Retrieved September. 2005;17:2008.
- 41. Scott D, Blizzard L, Fell J, Jones G. Statin therapy, muscle function and falls risk in community‐dwelling older adults. QJM 2009;102:625–633. [DOI] [PubMed] [Google Scholar]
- 42. Wallwork TL, Stanton WR, Freke M, Hides JA. The effect of chronic low back pain on size and contraction of the lumbar multifidus muscle. Man Ther 2009;14:496–500. [DOI] [PubMed] [Google Scholar]
- 43. Holm S. A simple sequentially rejective multiple test procedure. Scand J Stat 1979;6:65–70. [Google Scholar]
- 44. Stockton K, Mengersen K, Paratz J, Kandiah D, Bennell K. Effect of vitamin D supplementation on muscle strength: a systematic review and meta‐analysis. Osteoporos Int 2011;22:859–871. [DOI] [PubMed] [Google Scholar]
- 45. Hosseinifar M, Akbari M, Behtash H, Amiri M, Sarrafzadeh J. The effects of stabilization and McKenzie exercises on transverse abdominis and multifidus muscle thickness, pain, and disability: a randomized controlled trial in nonspecific chronic low back pain. J Phys Ther Sci 2013;25:1541–1545. [DOI] [PMC free article] [PubMed] [Google Scholar]
- 46. Vasseljen O, Fladmark AM. Abdominal muscle contraction thickness and function after specific and general exercises: a randomized controlled trial in chronic low back pain patients. Man Ther 2010;15:482–489. [DOI] [PubMed] [Google Scholar]
- 47. Verhaar H, Samson M, Jansen P, De Vreede P, Manten J, Duursma S. Muscle strength, functional mobility and vitamin D in older women. Aging 2000;12:455. [DOI] [PubMed] [Google Scholar]
- 48. Hides JA, Stanton WR, Wilson SJ, Freke M, McMahon S, Sims K. Retraining motor control of abdominal muscles among elite cricketers with low back pain. Scand J Med Sci Sports 2010;834–842. [DOI] [PubMed] [Google Scholar]
- 49. Freeman J, Wilson K, Spears R, Shalhoub V, Sibley P. Performance evaluation of four 25‐hydroxyvitamin D assays to measure 25‐hydroxyvitamin D2. Clin Biochem 2015;48:1097–1104. [DOI] [PubMed] [Google Scholar]
- 50. von Haehling S, Morley JE, Coats AJS, Anker SD. Ethical guidelines for publishing in the Journal of Cachexia, Sarcopenia and Muscle: update 2017. J Cachexia Sarcopenia Muscle 2017;8:1081–1083. [DOI] [PMC free article] [PubMed] [Google Scholar]
Associated Data
This section collects any data citations, data availability statements, or supplementary materials included in this article.
Supplementary Materials
Data S1. Supporting information