

Abstract
Background
The associations between free‐living physical activity (PA) and sedentary behaviour (SB) and sarcopenia in older people and its determinants are controversial. Self‐reporting, the use of one‐size‐fits‐all cut‐points for intensity categorization when using accelerometers and the absence of a clear sarcopenia definition hampered explorations. The aim of this study is to describe the associations between objectively measured PA patterns and sarcopenia and its determinants.
Methods
Subjects aged >65 with valid accelerometry and sarcopenia‐related measures from Toledo Study of Healthy Aging (TSHA) were included. Muscle mass (MM) was estimated by dual‐energy X‐ray absorptiometry. Handgrip strength (HS) was measured by dynamometry. Physical performance assessment relied on gait speed (GS). Sarcopenia presence was ascertained using Foundation for the National Institutes of Health (FNIH) criteria. PA and SB were estimated by ActiTrainer worn for 1 week and classified into time spent in SB and different PA intensity bands [light PA (LPA) and moderate‐to‐vigorous PA (MVPA)] using age‐specific cut‐points. Different multivariate linear and logistic regression models [(i) single‐parameter, (ii) partition, and (iii) isotemporal substitution models] were used for estimating associations between PA, SB, and sarcopenia determinants and sarcopenia rates, respectively. All models adjusted for age, sex, co‐morbidities (Charlson index), and functional ability (Katz and Lawton indexes).
Results
Five hundred twelve subjects from the TSHA had available data (78.08 ± 5.71 years of age; 54.3% women). FNIH sarcopenia assessment was performed in 497 subjects (23.3% were sarcopenic). In the linear regression, the single‐parameter model showed an association between MVPA and all sarcopenia determinants. In the partition model, MVPA was associated with greater MM and GS. The isotemporal substitution showed that reallocating 1 h/day of MVPA displacing SB was associated with greater values in MM [β = 0.014; 95% confidence interval (CI) = 0.004, 0.024; P < 0.01], GS (β = 0.082; 95% CI = 0.054, 0.110; P < 0.001), and HS (β = 0.888; 95% CI = 0.145, 1.631; P < 0.05). In the logistic regression, the single‐parameter model yielded a significant association between 1 h/day increase in MVPA and sarcopenia reduction [odds ratio (OR) = 0.522; 95% CI = 0.367, 0.726; P < 0.001], as did the partition model (OR = 0.555; 95% CI = 0.376, 0.799; P < 0.01). The reallocation of 1 h/day SB only yielded a significant lower sarcopenia risk by almost 50% when it was substituted with MVPA, whereas the substitution of 15 min/day yielded a significant lower sarcopenia risk by 15% (P < 0.001) but did not show any association when it was substituted with LPA.
Conclusions
An increase in MVPA replacing SB and LPA was associated with a reduction in sarcopenia prevalence and better performance across its determinants (MM, GS, and HS). LPA did not show any significant effect.
Keywords: Sarcopenia, Physical activity, Isotemporal substitution, Accelerometry, Handgrip strength, Gait speed
Introduction
Sarcopenia is an age‐associated syndrome that comprises loss of muscle mass (MM) plus a loss of muscle function (strength and power) and/or physical performance.1 Sarcopenia is a core contributor to frailty, physical limitations, and disability at advanced ages.2 Although primary ageing contributes to sarcopenia, the rate of MM and function loss appears to be modifiable relying upon lifestyle habits, mainly diet and physical activity (PA).3
Structured physical exercise, specifically strength training, has shown to be effective in sarcopenia prevention and reversal.3, 4, 5 However, the associations between walking‐related daily PA and sarcopenia remain to be elucidated. Moreover, the majority of the studies have assessed PA and sedentary behaviour (SB) by either self‐report or using questionnaires, raising potential biases related to failures in subjective recall of past events associated with activities eliciting energy expenditure and social desirability, yielding daily‐living PA overreporting and/or SB underestimation.6, 7
The use of accelerometers has allowed the objective daily living‐related PA estimation through motions derived from ambulation. Studies that aimed to improve the insight into the preventive role of objectively measured PA and health‐related conditions at older ages have applied thresholds validated in healthy young adults for PA intensity categorization.8, 9 This could have led to inaccuracy and misclassification of actual PA behaviours, generating an overestimation of SB10 and underestimation of actual PA,11 due to differences in energy cost of a given activity in older adults, when compared with younger cohorts.12 It has already been demonstrated that using classical younger adults' cut‐points when exploring older adults' PA patterns can artificially decrease PA adherence rates among older adults12, 13 and that PA estimates vary notably depending upon the cut‐points used.14
Recently, isotemporal substitution models were introduced to the analysis of PA data. They take account for the finiteness of the time in which a subject can partake in activities in the different intensity categories of PA. Engaging in activities in a specific level of intensity necessarily involves reducing time in another. Although previous research suggests a beneficial effect of PA on sarcopenia, the analytic methods overlooked the possibility of different effects elicited by the reallocation of time in a given intensity, relying upon the nature of the intensity it displaces. For example, an increase of time in light PA (LPA) is likely to induce different effects on sarcopenia and its determinants whether it displaces SB or moderate‐to‐vigorous PA (MVPA).15
The aim of the current study is to assess the associations between objectively measured PA levels and different sarcopenia‐related variables [MM, gait speed (GS), and handgrip strength (HS)] and sarcopenia prevalence, by using accelerometers that can objectively assess ambulation‐related PA and SB16 and classifying the intensity of activities using age‐specific cut‐off points for older adults in order to classify time into different PA intensity bands and SB.
Our hypothesis is that increasing time spent in SB is inversely associated with MM, GS, and HS and with a higher sarcopenia prevalence whereas greater time spent in LPA and MVPA are associated with higher MM and HS, faster GS, and a lower sarcopenia prevalence. Furthermore, we hypothesize differential effects of increasing time spent in a specific intensity category depending on the intensity nature of the time displaced in the isotemporal substitution model.
Methods
This work describes a cross‐sectional analysis of the data from the Toledo Study of Healthy Aging, a Spanish longitudinal population‐based study, designed for evaluating frailty determinants in individuals older than 65 years.17 The study protocol was approved by the Clinical Research Ethics Committee of the Toledo Hospital, Spain. Participants signed informed consent forms prior to their inclusion in the cohort.
Measurements
Identification of sarcopenia
Muscle mass was measured using dual‐energy X‐ray absorptiometry (DEXA) scan (Hologic, Serie Discovery QDR, Bedford, MA, USA). All DEXA scan tests were analysed using the software Physician's Viewer, APEX System Software Version 3.1.2. (Bedford, USA). Whole‐body scans were made in a supine position, in which the participants were scanned wearing light clothing with no metal and no shoes or jewellery. Body mass index‐adjusted appendicular lean mass (ALM/BMI) was used as marker. Low muscle strength in kilograms was assessed with HG measurement using a JAMAR hydraulic hand dynamometer (J. A. Preston Corporation, Clifton, NJ, USA); three attempts were performed in the dominant hand with the elbow extended while sitting, and the best record was registered. Low physical performance was defined as a low GS, computed by measuring the time (seconds) needed to cover a 3 m path at a usual GS. The best of two measurements was recorded.
Sarcopenia was identified using the Foundation for the National Institutes of Health (FNIH) diagnosis algorithm. According to this algorithm, sarcopenia is present in older adults with a GS < 0.8 m/s in both genders18 plus clinically relevant low MM and weakness. As stated by FNIH report, cut‐points for low MM and HG were an ALM/BMI below 0.789 in men and 0.512 in women and an HS lower than 26 kg for men and lower than 16 kg for women.
Physical activity assessment
Physical activity and SB were estimated using an ActiTrainer accelerometer (ActiGraph, LLC, Fort Walton Beach, FL, USA). All participants were asked to wear a device on the left hip during waking hours for 7 consecutive days and remove them during any bathing or swimming activities. The delivery and reception, as well as the explanation of use, were made in person by trained staff.19 Data were processed using standard methods; Raw ActiTrainer data were converted to counts per minute (CPM), which reflects the acceleration and hence the intensity of PA. The higher the CPM, the higher intensity of movement measured. Data collected from movement were integrated into 60 s increment periods (epochs). PA intensity is typically categorized based on metabolic equivalents (METs), being the unit of the resting metabolic rate (RMR). Each valid wearing‐time minute was classified using CPM‐based thresholds matched to the classical MET‐based transitions between intensity categories: SB (<1.5 METs in lying or sitting position), LPA (1.5–2.99 METs), and MVPA (≥3 METs). In this study, cut‐off points specific to the older adult population were applied to classify minutes per day spent in each intensity band based on the conversion of accelerometer vector magnitude (that integrates the three axes of movement) CPM to MET10, 20 (Table S1). Moderate intensity and vigorous intensity were merged together in an MVPA category.
Non‐wear time was defined as periods of at least 60 consecutive minutes of zero counts, with allowance for 2 min of counts from the accelerometer‐vertical axis between 0 and 100.21 The study included the results from participants with at least four valid days recorded. A valid day was defined as at least 480 min (8 h) of wearing without excessive counts (>20 000 vertical‐axis counts). Minutes spent in each of these activity intensity bands were computed and used as the number of 1 hr intervals per day in the analysis. Also, total activity counts (TAC) was taken as a composite measure of PA, independent of intensity, frequency, and patterns.
Covariates
Age, gender, functional status, and co‐morbidities were registered. Presence of co‐morbidities was ascertained by self‐report and checking the medical history in order to compute the Charlson index score.22 The Katz index and the Lawton index were used to assess the dependence in basic and instrumental activities of daily living, respectively.
Statistical analysis
All analyses were adjusted for age residuals obtained from the linear regression of chronological age on the three levels of PA.23 Student's t‐test was used for between‐groups comparison. Three different linear regression models were used for the associations between PA and SB and sarcopenia determinants: (i) single PA parameter model, (ii) a partition model, and (iii) an isotemporal substitution. For the analysis of the association between PAL levels and sarcopenia, we used logistic regression. All models are adjusted for age residuals, sex, the presence of co‐morbidities (Charlson index), and functional ability (Katz and Lawton indexes). Statistical significance was set at P < 0.05. All analyses were performed in R 3.4.1 (R Core Team, Vienna, Austria).
Results
Five hundred twelve subjects with DEXA and valid accelerometer measures available were included in this analysis. Among them, 497 subjects had available data for sarcopenia diagnosis, and 116 (23.3%) were classified as sarcopenic according to FNIH criteria. Mean age of the whole sample was 78.08 (5.71) years, and 54.3% of subjects were women. Mean MM, GS, and HS were 0.72 (0.1) kg/(kg/h2), 0.77 (0.26) m/s, and 28.01 (7.65) kg for men and 0.51 (0.07), 0.69 (0.25), and 17.53 (5.02) for women, respectively. Participants spent 53.6% of the wearing time in SB, 38.6% in LPA, and 7.8% in MVPA.
In the bivariate comparisons, subjects classified as sarcopenic showed differences with regard to those classified as non‐sarcopenic in the variables related to the criteria of sarcopenia and in those related to PA: longer time in SB (P < 0.01) and shorter time in both LPA (P < 0.01) and MVPA (P < 0.001) (Table 1).
Table 1.
Demographic characteristics stratified by the sarcopenia status according to Foundation for the National Institutes of Health
| Whole sample | Non‐sarcopenic by FNIH | Sarcopenic by FNIH | |
|---|---|---|---|
| N | 512a | 381 | 116 (23.3%) |
| Age (mean/SD) | 78.08 (5.71) | 77.4 (5.83) | 80.21 (4.8)*** |
| Women (n, %) | 278 (54.3%) | 218 (57.2%) | 54 (46.6%) |
| Total wearing time (h, mean/SD) | 84.39 (16.03) | 85.15 (15.86) | 82.66 (15.82) |
| SB, h/day (mean/SD) | 6.98 (1.62) | 6.82 (1.57) | 7.53 (1.63)*** |
| LPA, h/day (mean/SD) | 5.01 (1.5) | 5.15 (1.47) | 4.63 (1.53)** |
| MVPA, h/day (mean/SD) | 1.02 (0.78) | 1.09 (0.79) | 0.76 (0.69)*** |
| TAC/day (mean/SD) | 409 365.62 (180 677.01) | 428 558.64 (179 575.42) | 343 391.76 (167 575.43)*** |
| ALM/BMI (mean/SD) | 0.6 (0.13) | 0.62 (0.14) | 0.56 (0.12)*** |
| Gait speed (m/s, mean/SD) | 0.73 (0.26) | 0.79 (0.25) | 0.52 (0.14)*** |
| Handgrip strength (kg, mean/SD) | 22.26 (8.21) | 24.1 (8.04) | 16.45 (5.2)*** |
| Type 2 diabetes mellitus (n, %) | 117 (22.9%) | 79 (20.7%) | 33 (28.4%)* |
| Hypertension (n, %) | 335 (65.4%) | 242 (63.5%) | 82 (70.7%) |
| Myocardial infarction (n, %) | 23 (4.5%) | 18 (4.7%) | 5 (4.3%) |
| Heart failure (n, %) | 11 (2.1%) | 8 (2.1%) | 3 (2.6%) |
| Charlson index score (mean, SD) | 1.97 (1.75) | 1.77 (1.54) | 2.64 (2.21)*** |
| Dependency for ADL, Katz index (n, %) | 96 (18.8%) | 64 (16.8%) | 29 (25%) |
| Dependency for IADL, Lawton index (n, %) | 278 (54.3%) | 187 (49.1%) | 81 (69.8%)*** |
ADL, activities of daily living; ALM, appendicular lean mass; BMI, body mass index; IADL, instrumental activities of daily living; LPA, light physical activity; MVPA, moderate‐to‐vigorous physical activity; SB, sedentary behaviour; SD, standard deviation; TAC, total activity counts.
Missing data for at least one FNIH sarcopenia determinant in 15 subjects (2.9%).
P < 0.05.
P < 0.01.
P < 0.001.
In the single PA parameter model (Table 2, model A), each 1 h/day increase in MVPA showed a significant association with greater values in MM, GS, and HS, whereas each 1 h/day increase in LPA did so with a higher HS; 1 SD increase in TAC was significantly associated with MM, GS, and HS. In the partition model (Table 2, model B), adding 1 h/day of MVPA to the actual PA and SB patterns was associated with greater MM and GS, whereas adding 1 h/day of LPA was associated with a reduction in GS [β = −0.022; 95% confidence interval (CI) = −0.040, −0.004; P = 0.017]. Isotemporal substitution showed that reallocating 1 h/day of SB by MVPA was significantly associated with greater values in MM, GS, and HS. When this volume of MVPA substituted the same volume of LPA, we found significant associations with greater MM and GS but not with HS (P = 0.312) (Table 2, model C).
Table 2.
Regression coefficients expressing associations between time engaged in physical activity in the different intensity bands and sarcopenia determinants using distinct analysis methods
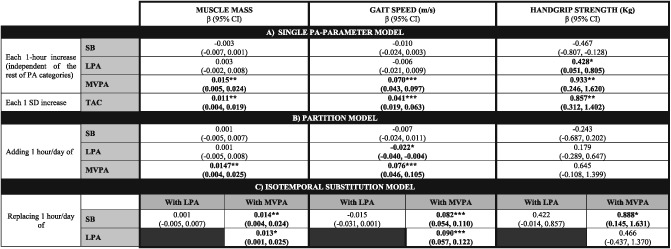
(A) Single PA parameter model, examining the association of each intensity category (SB, LPA, and MVPA) individually (one regression model for each one) with the values of sarcopenia determinants. (B) Partition model, displaying the association of a 1 h increase in each activity, adjusted by time engaged in the rest of activity categories, with the values of sarcopenia determinants. (C) Isotemporal substitution model, considering a finite timeframe, examining the effect replacing 1 h engagement in a given activity with 1 h in a distinct intensity band on sarcopenia determinant values. All models are adjusted by age, sex, the presence of co‐morbidities (Charlson index), and functional ability (Katz and Lawton indexes). β, beta coefficient; CI, confidence interval; LPA, light physical activity; MVPA, moderate‐to‐vigorous physical activity; PA, physical activity; SB, sedentary behaviour; SD, standard deviation; TAC, total activity counts.
P < 0.05.
P < 0.01.
P < 0.001.
In the partition model, we found deviations from linearity when including the second polynomial of time spent in MVPA for GS and HS. Figures 1 and 2 illustrate the associations between MVPA and GS and HS for an average study participant and suggest a saturation of the beneficial effect of increasing MVPA beyond 1.5 h per day.
Figure 1.
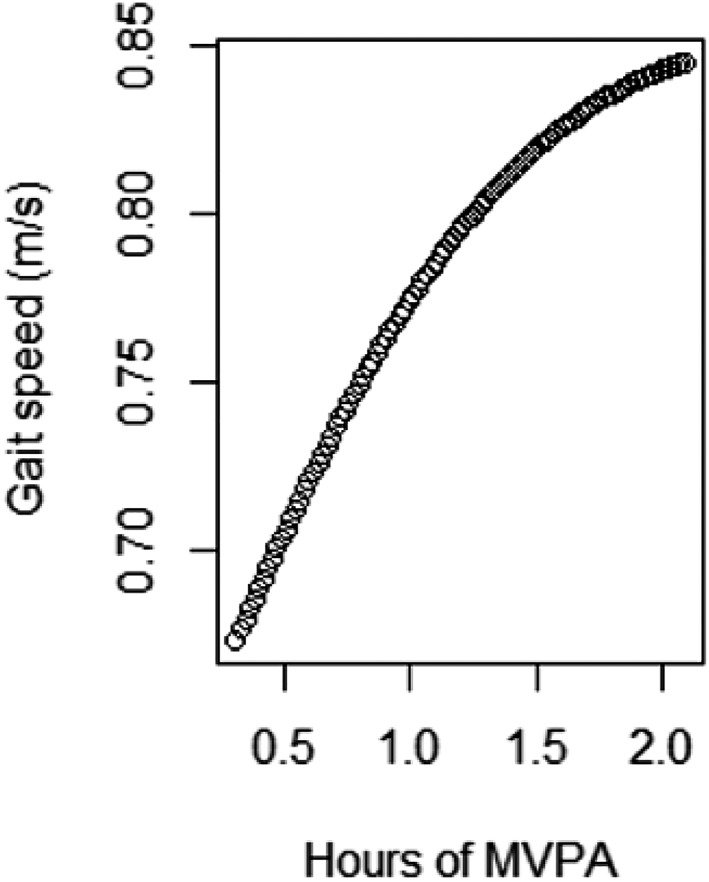
Predicted values for gait speed for an average male participant obtained from fitting a natural cubic spline with 5 degrees of freedom. Created with R 3.4.1 (R Core Team, Vienna, Austria). MVPA, moderate‐to‐vigorous physical activity.
Figure 2.
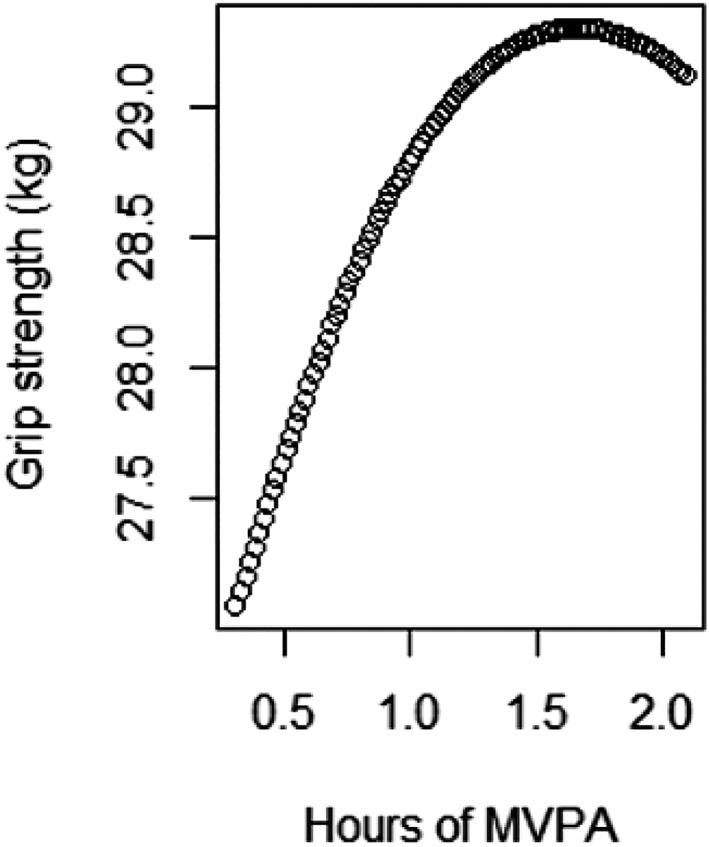
Predicted values for handgrip strength for an average male participant obtained from fitting a natural cubic spline with 5 degrees of freedom. Created with R 3.4.1 (R Core Team, Vienna, Austria). MVPA, moderate‐to‐vigorous physical activity.
Regarding the relationship between PA, SB, and sarcopenia prevalence when we used the single‐parameter model (Table 3, model A), a 1 h/day increase of SB showed an association with higher sarcopenia prevalence and 1 h/day increase of MVPA with lower sarcopenia prevalence, respectively. Additionally, an increase of 1 SD in TAC was significantly associated with lower rate of sarcopenia. In the partition model (Table 3, model B), the inclusion of the time spent in other intensity categories suppressed the association between SB and higher sarcopenia risk, whereas MVPA–sarcopenia rate association remained significant [odds ratio (OR) = 0.555; 95% CI = 0.376, 0.799; P = 0.002]. In the isotemporal substitution model, the reallocation of SB only yielded a significant lower sarcopenia risk when it was substituted with MVPA (OR = 0.520; 95% CI = 0.361, 0.750; P < 0.001). Likewise, a significant risk reduction was observed when displacing LPA with MVPA (OR = 0.557; 95% CI = 0.356, 0.871; P = 0.01). The effect of reducing SB at expenses of increasing LPA on sarcopenia risk pointed into the expected direction but did not reach statistical significance (OR = 0.935; 95% CI = 0.766, 1.141; P = 0.507).
Table 3.
Associations between different physical activity parameters (time in sedentary behaviour, light physical activity and moderate‐to‐vigorous physical activity, and total activity counts) and sarcopenia prevalence, using different analysis approaches
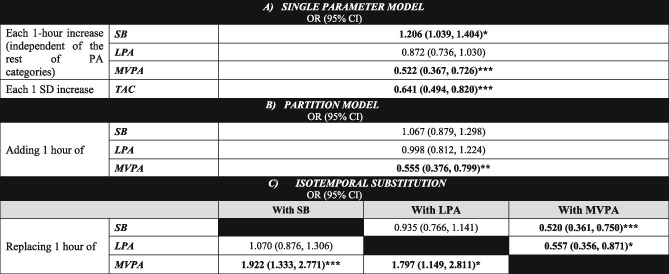
(A) Single PA parameter model, examining the association of each intensity category (SB, LPA, and MVPA) individually (one regression model for each one) with sarcopenia risk. (B) Partition model, displaying the association of a 1 h increase in each activity, adjusted by time engaged in the rest of activity categories, with sarcopenia risk. (C) Isotemporal substitution model, considering a finite timeframe, examining the effect of substituting 1 h engagement in an activity category with 1 h in a distinct intensity band on sarcopenia risk. All models are adjusted by age, sex, the presence of co‐morbidities (Charlson index), and functional ability (Katz and Lawton indexes). CI, confidence interval; LPA, light physical activity; MVPA, moderate‐to‐vigorous physical activity; OR, odds ratio; PA, physical activity; SB, sedentary behaviour; SD, standard deviation; TAC, total activity counts.
P < 0.05.
P < 0.01.
P < 0.001.
As behavioural changes entailing 1 h increments in MVPA are rather unattainable in our population,24 we calculated the effects from the isotemporal substitution model of shorter periods of time at different PA intensities, emulating more feasible modifications in PAL patterns (Table 4).
Table 4.
OR of the isotemporal substitution of different volumes of sedentary behaviour and light physical activity with moderate‐to‐vigorous physical activity
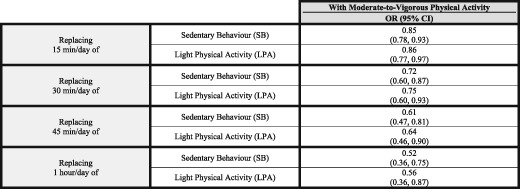
CI, confidence interval; LPA, light physical activity; MVPA, moderate‐to‐vigorous physical activity; OR, odds ratio; SB, sedentary behaviour.
Discussion
This analysis of data from a community‐based cohort of older people revealed that more time engaged in PA is congruently positively associated with better performance of sarcopenia‐related measures (MM, GS, and HS) and with a lower prevalence of sarcopenia, independent of the analytic method and adjustment for age, sex, the presence of co‐morbidities, and the functional ability. Being engaged in MVPA accounts for the major part of this benefit, while engagement in LPA only shows a marginal effect on some of the components related to sarcopenia, without any significant effect on the sarcopenia prevalence. These observations suggest the presence of an intensity threshold under which little benefit is obtained. In this regard, it must be underscored that even little increases in the levels of MVPA could be enough to reduce significantly the prevalence of sarcopenia, replacing either SB or LPA. Although our main analysis is focused in the substitution of 1 h MVPA, of note is the reduction in sarcopenia prevalence associated with only a 15 min/day increase in MVPA at expenses of reducing either SB or LPA (15% or 14%, respectively) (Table 4). This suggests that even little changes in PA patterns, embracing intensity and volume, might have positive effects on sarcopenia.
Focusing on sarcopenia determinants, it appears to be that higher PA engagement improves performance across all sarcopenia determinants. In accordance with our results, previous literature supports the positive association of greater PA levels and MM at old ages,23, 25, 26, 27, 28, 29 but there have been some contradictory findings in this regard.30, 31, 32 With respect to the relationship between PA and performance measures (GS and HS), existing evidence points towards a positive effect of greater levels of PA on performance and maintenance of physical function.26, 30, 33, 34 Our study reinforces these observations. Of note is the trajectory of the association between the amount of PA and HS and GS with increasing MVPA, displaying a probable ceiling effect with values greater than 1.5 h/day of MVPA eliciting modest improvements in HS and GS (Figures 1 and 2). The partition model showed an absence of association between MVPA and HG in our sample. This might be due to the activity registered by the accelerometer (mainly ambulation) having little effect on upper limbs strength. In this sense, it could be interesting to study the relationship between accelerometer‐derived PA and lower limb strength, to explore a possible stronger effect of ambulation‐related activities on strength. Although SB was not significantly associated with any sarcopenia determinants, the direction of the effect was in the expected direction of SB producing worse performance across all of them (MM,35 HS,23, 30 and GS25).
Our results support the accumulating evidence of an inverse association between PA and sarcopenia prevalence, reinforcing the unique role of MVPA on sarcopenia reduction. LPA seems to be insufficient to reduce sarcopenia rates. Mijnarends et al.26 and Tyrovolas et al.31 showed a protective effect of greater accumulation of self‐reported PA on sarcopenia. In contrast, in the study by Hai et al. in community‐dwelling Chinese people aged 60 years and older (mean age 68 years old), no association was found using questionnaires‐based PA assessment.36 Controversy might be caused by differential PA assessment tools and sarcopenia definitions. In fact, the three studies previously cited used self‐reported activity, showing striking differences both in the amount and intensity of PA and their association to sarcopenia. They also used different sarcopenia definitions (European Working Group on Sarcopenia in Older People definition, a body weight‐adjusted Appendicular Skeletal Muscle Index of −2 SDs with respect to a healthy young cohort, Asian Working Group for Sarcopenia criteria). But even if a definition of sarcopenia can be agreed on, different sarcopenia assessment tools for MM [DEXA, bioelectrical impedance analysis (BIA), anthropometry‐based measures], strength (HS, lower extremity strength), and gait performance (GS, up and go test) and the absence of population‐specific cut‐points may lead to discrepancies in the conclusions. Importantly, it should be recognized that the sarcopenia criteria employed may arguably condition the associations. Recent research suggests the need for MM, GS, and HS cut‐points harmonization following the characteristics of the population.37, 38, 39
The role of LPA for MM and function preservation remains controversial. Some previous work has showed an association between light activity (assessed objectively) and HS in men but not women.33 The link between LPA and HS might be explained by the effects of myokines released by the muscle after muscle contraction,40, 41 among other potential explanations.42 In our study, such LPA–HS association was only significant in the single‐parameter approach and faded in both the partition and isotemporal substitution models.
Parameters such as mode, intensity, duration, and volume of and the type of muscle contraction (i.e. aerobic, resistive, concentric, and eccentric) determine the induced homeostasis disruption PA generates and consequently the adaptations obtained through muscle activation. Aerobic and resistance exercise represent extremes on a continuum and elicit markedly different metabolic and structural responses. Whereas aerobic PA (i.e. low‐intensity repetitive contractions) mainly induces adaptations that lead to improved oxygen uptake, transportation, and utilization, resistance exercise (i.e. low‐frequency and high‐resistance demand) is believed to play a role in proteostasis and neuromuscular function.43 The beneficial effect of high‐intensity, explosive resistance training on MM and output, and physical function, maintenance at older ages is clear.44, 45, 46 The LPA captured in our study might be classified as aerobic, having little effect on these outcomes. Conversely, we suggest that activities classified as MVPA (energy expenditure ≥ 3 MET) according to the Compendium of Physical Activities by Ainsworth and colleagues47 and correcting MET values to the mean age of our populations48 constitute a sufficient stimulus to trigger responses that stimulate MM, strength, and physical function. Walking for pleasure (4.375 MET), Tai Chi (5 MET), and recreational swimming (6 MET) are among that type of activities. Considering sarcopenia as one of the biologic substrates of frailty, our group showed similar results when exploring the associations between PA, SB, and frailty status in the same cohort.49
Strengths and limitations
The present study has several strengths. First, this study used an objective tool for SB and PA assessment and involves a population with advanced age (mean age, 78 years). Self‐reported surveillance data overestimate time‐performing PA and underestimate SB50 and are only weakly correlated with objectively assessed PA patterns in older adults.51 Consequently, objective measures are assumed to solve limitations of self‐reported estimation. However, there are important issues to consider when classifying PA behaviours through accelerometry. As stated in the Methods section, ActiGraph monitors typically categorize activities intensity classifying each valid wearing‐time minute into one of the classical intensity bands using count‐based (CPM) thresholds, usually those defined in calibration studies among healthy young cohorts.9, 52 With a lower RMR, the relative energy expenditure (MET value) associated with these CPM thresholds would be greater in older adults in relation to younger counterparts. For instance, the LPA–MVPA transition (3 METs) in a young person (V = 10.5 mL O2/kg/min, assuming an RMR of 3.5 mL O2/kg/min) would imply an exertion of 3.75 METs in an older adult (with an RMR = 2.8 mL O2/kg).53, 54
Despite this limitation, most previous studies objectively measuring PA and SB patterns considered thresholds validated in healthy young adults, systematically assuming similar energy costs across different age groups. In an attempt to solve these problems, Koster et al. calculated a threshold for the SB–LPA transition against a measure deemed a gold standard (ActivPAL accelerometers) among elders. Additionally, they demonstrated an overestimation of time spent in SB by almost 2 h/day among older adults when using the classical cut‐points in the Aging Research Evaluating Accelerometry study.10 Similarly, Barnett et al. determined an age‐specific LPA–MVPA transition threshold in a population of older adults (mean age 70.2), in a calibration study against indirect calorimetry.20 The use of these age‐specific thresholds in our study partially overcomes the previously described shortcomings. Nevertheless, and very importantly, we acknowledge that there could still be bias because of variability in several factors that might influence energy cost, such as sex, fitness, body weight, disability, movement impairment, and illnesses.55
In addition, subjects in our study wore a triaxial accelerometer (ActiTrainer). Triaxial accelerometer data capture motions in all three axes resulting from more complex movements56, 57 and have shown better performance in terms of intensity prediction in laboratory‐based validation studies in relation to uniaxial accelerometry.55
Second, as the time in a day in which a person can partake in PA is finite, engaging in one intensity category inevitably means reducing the time engaged in another. The benefits of different PA intensities depend not only on the specific PA intensity but also on the type of intensity it displaces. This fact has been systematically overlooked in previous research using different statistical models. For example, the single PA parameter model separately examines the associations between an amount of time in each intensity category and its effect on a dependent variable, disregarding the amounts of time spent in other intensities. The partition model accounts for the role of the amount of time in distinct intensity categories but analyses the effect of adding time in the intended PA intensity category to the actual distribution of time in all the intensity bands, instead of accounting for the limited time available. Thus, it is not a realistic approach. Conversely, the use isotemporal substitution might mirror feasible changes in PA patterns by accounting for the finiteness of the time in which a subject can engage in different intensity activities in a given period and captures disparate effects of lifestyle changes in one dominion that affects other behaviours.15 This fact reinforces the external validity of our observations and its suitability for formulating public health recommendations.
Finally, in contrast to the majority of the studies published to date assessing the relationships between PA and sarcopenia, we have used DEXA scans to assess MM, a more reliable and accurate method than the estimations of MM derived from anthropometric measures or bioelectrical impedance analysis.58 Moreover, we used an internationally recognized sarcopenia definition based on MM, HS, and GS (FNIH criteria).
Nevertheless, our work presents some limitations. The cross‐sectional nature of this study hampers exploration of directionality between PA and SB and sarcopenia and its determinants, and reverse causality cannot be ascertained: although we hypothesized that higher PA and lower SB would lead to lower sarcopenia prevalence, lower MM, HS, and GS might also diminish PA and increase SB. In addition, although ActiGraph accelerometers can accurately estimate PA derived from walking, the most popular activity among older people,14 they are unable to capture non‐ambulatory PA like resistance training, swimming, or cycling, activities that have shown a strong association with MM and function.59, 60 In any case, this kind of activities are rather unusual in our population. Furthermore, we could not capture vigorous intensity (corresponding to energy expenditures over 6 METs) because of the absence of cut‐points for this the transition between moderate and vigorous PA intensity categories. Notwithstanding, a very low proportion of older adults regularly reaches vigorous intensities.
Current PA recommendations suggest a minimum MVPA bout duration of 10 min to gain health benefits61 but acknowledge the inconclusive nature of previous evidence62 and the possibility that shorter periods might be valid in sedentary individuals, as those in our cohort.63 Taking this into account, in our analysis, we computed the SB, LPA, and MVPA variables by summing all the minutes within each category, irrespective of the duration of the bout in which they were contained. Hence, we could not evaluate how differences in PA‐bout length contribute to overall PA effect on sarcopenia and its determinants. Considering our observations (as few as 15 min/day of MVPA is good enough to produce some benefit on sarcopenia), this finding does not look to support the need of bouts of a minimum of 10 min to get benefits in terms of MM and muscle function.
Finally, we recognize that although isotemporal substitution might be a more realistic approach, it is not more than a mathematical method for replacing time in one intensity with another and in no case could substitute experimental evidence. Research is guaranteed to explore the potential effects of reducing SB and increasing LPA and MVPA on MM and function through properly designed randomized clinical trials.
To our knowledge, this is the first study in exploring the associations of sarcopenia and objectively estimated PA classified using age‐specific thresholds. In addition, we explored the associations through different analytic methods, among which the isotemporal substitution, that yields more directly interpretable and meaningful results to public health evidence.
In conclusion, our findings, stemming from a study with an accurate assessment of both PA and the presence of sarcopenia, strongly support the hypothesis of the association between higher PA levels, in the form of increments in MVPA and SB reduction, lower sarcopenia rates, and better performance across sarcopenia determinants in older people. LPA appears to have marginal effects on sarcopenia determinants and any on the risk because the substitution of SB by LPA is not significantly associated.
Considering the growing older population in Western countries and the functional and economic burden of sarcopenia,64 improving insight into its aetiology, contributing factors and possible interventions should be a priority for researchers. Appropriately designed longitudinal studies assessing the causal relationships and which of the components of the PA are involved in that association with sarcopenia are needed to design targeted interventions in the older population at risk or suffering sarcopenia.
Ethical issues
The study protocol was approved by the Clinical Research Ethics Committee of the Toledo Hospital, Spain. This work was performed according to the ethical standards laid down in the 1964 Declaration of Helsinki and later amendments. Participants signed informed consent forms prior to their inclusion in the cohort. The authors certify that they comply with the ethical guidelines for authorship and publishing of the Journal of Cachexia, Sarcopenia and Muscle.65
Funding
The present work was funded by grants from the Spanish Ministry of Economy, Industry and Competitiveness, co‐financed by the European Regional Development Funds (RD120001/0043) and the Centro de Investigación Biomédica en Red en Fragilidad y Envejecimiento Saludable—CIBERFES (CB16/10/00464).
Conflict of interest
The authors declare that they have no conflict of interest.
Supporting information
Table S1. Older adults‐specific cut‐off points for classifying PA behaviour.
Sánchez‐Sánchez, J. L. , Mañas, A. , García‐García, F. J. , Ara, I. , Carnicero, J. A. , Walter, S. , and Rodríguez‐Mañas, L. (2019) Sedentary behaviour, physical activity, and sarcopenia among older adults in the TSHA: isotemporal substitution model. Journal of Cachexia, Sarcopenia and Muscle, 10: 188–198. 10.1002/jcsm.12369.
References
- 1. Fielding RA, Vellas B, Evans WJ, Bhasin S, Morley JE, Newman AB, et al. Sarcopenia: an undiagnosed condition in older adults. Current consensus definition: prevalence, etiology, and consequences. International working group on sarcopenia. J Am Med Dir Assoc 2011;12:249–256. [DOI] [PMC free article] [PubMed] [Google Scholar]
- 2. Cesari M, Landi F, Vellas B, Bernabei R, Marzetti E. Sarcopenia and physical frailty: two sides of the same coin. Front Aging Neurosci 2014;6:192. [DOI] [PMC free article] [PubMed] [Google Scholar]
- 3. Martone AM, Marzetti E, Calvani R, Picca A, Tosato M, Santoro L, et al. Exercise and protein intake: a synergistic approach against sarcopenia. Biomed Res Int 2017;2017:2672435. [DOI] [PMC free article] [PubMed] [Google Scholar]
- 4. Fiatarone MA, O'Neill EF, Ryan ND, Clements KM, Solares GR, Nelson ME, et al. Exercise training and nutritional supplementation for physical frailty in very elderly people. N Engl J Med 1994;330:1769–1775. [DOI] [PubMed] [Google Scholar]
- 5. Montero‐Fernández N, Serra‐Rexach JA. Role of exercise on sarcopenia in the elderly. Eur J Phys Rehabil Med 2013;49:131–143. [PubMed] [Google Scholar]
- 6. Sallis JF, Saelens BE. Assessment of physical activity by self‐report: status, limitations, and future directions. Res Q Exerc Sport 2000;71:S1–S14. [PubMed] [Google Scholar]
- 7. Atkin AJ, Gorely T, Clemes SA, Yates T, Edwardson C, Brage S, et al. Methods of measurement in epidemiology: sedentary behaviour. Int J Epidemiol 2012;41:1460–1471. [DOI] [PMC free article] [PubMed] [Google Scholar]
- 8. Loyen A, Clarke‐Cornwell AM, Anderssen SA, Hagströmer M, Sardinha LB, Sundquist K, et al. Sedentary time and physical activity surveillance through accelerometer pooling in four European countries. Sports Med 2017;47:1421–1435. [DOI] [PMC free article] [PubMed] [Google Scholar]
- 9. Freedson PS, Melanson E, Sirard J. Calibration of the Computer Science and Applications, Inc. accelerometer. Med Sci Sports Exerc 1998;30:777–781. [DOI] [PubMed] [Google Scholar]
- 10. Koster A, Shiroma EJ, Caserotti P, Matthews CE, Chen KY, Glynn NW, et al. Comparison of sedentary estimates between activPAL and hip‐ and wrist‐worn ActiGraph. Med Sci Sports Exerc 2016;48:1514–1522. [DOI] [PMC free article] [PubMed] [Google Scholar]
- 11. Hall KS, Howe CA, Rana SR, Martin CL, Morey MC. METs and accelerometry of walking in older adults: standard versus measured energy cost. Med Sci Sports Exerc 2013;45:574–582. [DOI] [PMC free article] [PubMed] [Google Scholar]
- 12. Aspvik NP, Viken H, Zisko N, Ingebrigtsen JE, Wisløff U, Stensvold D. Are older adults physically active enough—a matter of assessment method? The Generation 100 study. PLoS ONE 2016;11:e0167012. [DOI] [PMC free article] [PubMed] [Google Scholar]
- 13. Jefferis BJ, Sartini C, Lee I‐M, Choi M, Amuzu A, Gutierrez C, et al. Adherence to physical activity guidelines in older adults, using objectively measured physical activity in a population‐based study. BMC Public Health 2014;14:382. [DOI] [PMC free article] [PubMed] [Google Scholar]
- 14. Copeland JL, Esliger DW. Accelerometer assessment of physical activity in active, healthy older adults. J Aging Phys Act 2009;17:17–30. [DOI] [PubMed] [Google Scholar]
- 15. Mekary RA, Willett WC, Hu FB, Ding EL. Isotemporal substitution paradigm for physical activity epidemiology and weight change. Am J Epidemiol 2009;170:519–527. [DOI] [PMC free article] [PubMed] [Google Scholar]
- 16. Trost SG, O'Neil M. Clinical use of objective measures of physical activity. Br J Sports Med 2014;48:178–181. [DOI] [PubMed] [Google Scholar]
- 17. Garcia‐Garcia FJ, Gutierrez Avila G, Alfaro‐Acha A, Amor Andres MS, De Los Angeles De La Torre Lanza M, Escribano Aparicio MV, et al. The prevalence of frailty syndrome in an older population from Spain. The Toledo Study for Healthy Aging. J Nutr Health Aging 2011;15:852–856. [DOI] [PubMed] [Google Scholar]
- 18. McLean RR, Shardell MD, Alley DE, Cawthon PM, Fragala MS, Harris TB, et al. Criteria for clinically relevant weakness and low lean mass and their longitudinal association with incident mobility impairment and mortality: the Foundation for the National Institutes of Health (FNIH) sarcopenia project. J Gerontol A Biol Sci Med Sci 2014;69:576–583. [DOI] [PMC free article] [PubMed] [Google Scholar]
- 19. Matthews CE, Hagströmer M, Pober DM, Bowles HR. Best practices for using physical activity monitors in population‐based research. Med Sci Sports Exerc 2012;44:S68–S76. [DOI] [PMC free article] [PubMed] [Google Scholar]
- 20. Barnett A, van den Hoek D, Barnett D, Cerin E. Measuring moderate‐intensity walking in older adults using the ActiGraph accelerometer. BMC Geriatr 2016;16:211. [DOI] [PMC free article] [PubMed] [Google Scholar]
- 21. Colley R, Connor Gorber S, Tremblay MS. Quality control and data reduction procedures for accelerometry‐derived measures of physical activity. Health Rep 2010;21:63–69. [PubMed] [Google Scholar]
- 22. Charlson M, Szatrowski TP, Peterson J, Gold J. Validation of a combined comorbidity index. J Clin Epidemiol 1994;47:1245–1251. [DOI] [PubMed] [Google Scholar]
- 23. Foong YC, Chherawala N, Aitken D, Scott D, Winzenberg T, Jones G. Accelerometer‐determined physical activity, muscle mass, and leg strength in community‐dwelling older adults. J Cachexia Sarcopenia Muscle 2016;7:275–283. [DOI] [PMC free article] [PubMed] [Google Scholar]
- 24. Hallal PC, Andersen LB, Bull FC, Guthold R, Haskell W, Ekelund U, et al. Global physical activity levels: surveillance progress, pitfalls, and prospects. Lancet 2012;380:247–257. [DOI] [PubMed] [Google Scholar]
- 25. Ryu M, Jo J, Lee Y, Chung Y‐S, Kim K‐M, Baek W‐C. Association of physical activity with sarcopenia and sarcopenic obesity in community‐dwelling older adults: the Fourth Korea National Health and Nutrition Examination Survey. Age Ageing 2013;42:734–740. [DOI] [PubMed] [Google Scholar]
- 26. Mijnarends DM, Koster A, Schols JMGA, Meijers JMM, Halfens RJG, Gudnason V, et al. Physical activity and incidence of sarcopenia: the population‐based AGES‐Reykjavik Study. Age Ageing 2016;45:614–620. [DOI] [PMC free article] [PubMed] [Google Scholar]
- 27. Park H, Park S, Shephard RJ, Aoyagi Y. Yearlong physical activity and sarcopenia in older adults: the Nakanojo Study. Eur J Appl Physiol 2010;109:953–961. [DOI] [PubMed] [Google Scholar]
- 28. Raguso CA, Kyle U, Kossovsky MP, Roynette C, Paoloni‐Giacobino A, Hans D, et al. A 3‐year longitudinal study on body composition changes in the elderly: role of physical exercise. Clin Nutr 2006;25:573–580. [DOI] [PubMed] [Google Scholar]
- 29. Kim G‐S, Im E, Rhee J‐H. Association of physical activity on body composition, cardiometabolic risk factors, and prevalence of cardiovascular disease in the Korean population (from the fifth Korea national health and nutrition examination survey, 2008–2011). BMC Public Health 2017;17:275. [DOI] [PMC free article] [PubMed] [Google Scholar]
- 30. Aggio DA, Sartini C, Papacosta O, Lennon LT, Ash S, Whincup PH, et al. Cross‐sectional associations of objectively measured physical activity and sedentary time with sarcopenia and sarcopenic obesity in older men. Prev Med 2016;91:264–272. [DOI] [PMC free article] [PubMed] [Google Scholar]
- 31. Tyrovolas S, Koyanagi A, Olaya B, Ayuso‐Mateos JL, Miret M, Chatterji S, et al. Factors associated with skeletal muscle mass, sarcopenia, and sarcopenic obesity in older adults: a multi‐continent study. J Cachexia Sarcopenia Muscle 2016;7:312–321. [DOI] [PMC free article] [PubMed] [Google Scholar]
- 32. Volpato S, Bianchi L, Cherubini A, Landi F, Maggio M, Savino E, et al. Prevalence and clinical correlates of sarcopenia in community‐dwelling older people: application of the EWGSOP definition and diagnostic algorithm. J Gerontol A Biol Sci Med Sci 2014;69:438–446. [DOI] [PMC free article] [PubMed] [Google Scholar]
- 33. Bann D, Hire D, Manini T, Cooper R, Botoseneanu A, McDermott MM, et al. Light intensity physical activity and sedentary behavior in relation to body mass index and grip strength in older adults: cross‐sectional findings from the Lifestyle Interventions and Independence for Elders (LIFE) study. PLoS ONE 2015;10:e0116058. [DOI] [PMC free article] [PubMed] [Google Scholar]
- 34. Dodds R, Kuh D, Aihie Sayer A, Cooper R. Physical activity levels across adult life and grip strength in early old age: updating findings from a British birth cohort. Age Ageing 2013;42:794–798. [DOI] [PMC free article] [PubMed] [Google Scholar]
- 35. Gianoudis J, Bailey CA, Daly RM. Associations between sedentary behaviour and body composition, muscle function and sarcopenia in community‐dwelling older adults. Osteoporos Int 2015;26:571–579. [DOI] [PubMed] [Google Scholar]
- 36. Hai S, Cao L, Wang H, Zhou J, Liu P, Yang Y, et al. Association between sarcopenia and nutritional status and physical activity among community‐dwelling Chinese adults aged 60 years and older. Geriatr Gerontol Int 2017;17:1959–1966. [DOI] [PubMed] [Google Scholar]
- 37. Alonso Bouzón C, Carnicero JA, Turín JG, García‐García FJ, Esteban A, Rodríguez‐Mañas L. The standardization of Frailty Phenotype criteria improves its predictive ability: the Toledo Study for Healthy Aging. J Am Med Dir Assoc 2017;18:402–408. [DOI] [PubMed] [Google Scholar]
- 38. Lourenço RA, Pérez‐Zepeda M, Gutiérrez‐Robledo L, García‐García FJ, Rodríguez Mañas L. Performance of the European Working Group on Sarcopenia in Older People algorithm in screening older adults for muscle mass assessment. Age Ageing 2015;44:334–338. [DOI] [PubMed] [Google Scholar]
- 39. Davies B, García F, Ara I, Artalejo FR, Rodriguez‐Mañas L, Walter S. Relationship between sarcopenia and frailty in the Toledo Study of Healthy Aging: a population based cross‐sectional study. J Am Med Dir Assoc 2018;19:282–286. [DOI] [PubMed] [Google Scholar]
- 40. Donnelly JE, Honas JJ, Smith BK, Mayo MS, Gibson CA, Sullivan DK, et al. Aerobic exercise alone results in clinically significant weight loss for men and women: midwest exercise trial 2. Obesity (Silver Spring) 2013;21:E219–E228. [DOI] [PMC free article] [PubMed] [Google Scholar]
- 41. Crane JD, Macneil LG, Tarnopolsky MA. Long‐term aerobic exercise is associated with greater muscle strength throughout the life span. J Gerontol A Biol Sci Med Sci 2013;68:631–638. [DOI] [PubMed] [Google Scholar]
- 42. Cooper R, Mishra GD, Kuh D. Physical activity across adulthood and physical performance in midlife: findings from a British birth cohort. Am J Prev Med 2011;41:376–384. [DOI] [PMC free article] [PubMed] [Google Scholar]
- 43. Egan B, Zierath JR. Exercise metabolism and the molecular regulation of skeletal muscle adaptation. Cell Metab 2013;17:162–184. [DOI] [PubMed] [Google Scholar]
- 44. Cadore EL, Casas‐Herrero A, Zambom‐Ferraresi F, Idoate F, Millor N, Gómez M, et al. Multicomponent exercises including muscle power training enhance muscle mass, power output, and functional outcomes in institutionalized frail nonagenarians. Age (Dordr) 2014;36:773–785. [DOI] [PMC free article] [PubMed] [Google Scholar]
- 45. Cadore EL, Izquierdo M. Muscle power training: a hallmark for muscle function retaining in frail clinical setting. J Am Med Dir Assoc 2018;19:190–192. [DOI] [PubMed] [Google Scholar]
- 46. Lopez P, Pinto RS, Radaelli R, Rech A, Grazioli R, Izquierdo M, et al. Benefits of resistance training in physically frail elderly: a systematic review. Aging Clin Exp Res 2018;30:889–899. [DOI] [PubMed] [Google Scholar]
- 47. Ainsworth BE, Haskell WL, Herrmann SD, Meckes N, Bassett DR, Tudor‐Locke C, et al. 2011 Compendium of Physical Activities: a second update of codes and MET values. Med Sci Sports Exerc 2011;43:1575–1581. [DOI] [PubMed] [Google Scholar]
- 48. Harris JA, Benedict FG. A biometric study of human basal metabolism. Proc Natl Acad Sci U S A 1918;4:370–373. [DOI] [PMC free article] [PubMed] [Google Scholar]
- 49. Mañas A, Del Pozo‐Cruz B, Guadalupe‐Grau A, Marín‐Puyalto J, Alfaro‐Acha A, Rodríguez‐Mañas L, et al. Reallocating accelerometer‐assessed sedentary time to light or moderate‐ to vigorous‐intensity physical activity reduces frailty levels in older adults: an isotemporal substitution approach in the TSHA Study. J Am Med Dir Assoc 2018;19:185.e1–185.e6. [DOI] [PubMed] [Google Scholar]
- 50. Steene‐Johannessen J, Anderssen SA, van der Ploeg HP, Hendriksen IJM, Donnelly AE, Brage S, et al. Are self‐report measures able to define individuals as physically active or inactive? Med Sci Sports Exerc 2016;48:235–244. [DOI] [PMC free article] [PubMed] [Google Scholar]
- 51. Hekler EB, Buman MP, Haskell WL, Conway TL, Cain KL, Sallis JF, et al. Reliability and validity of CHAMPS self‐reported sedentary‐to‐vigorous intensity physical activity in older adults. J Phys Act Health 2012;9:225–236. [DOI] [PMC free article] [PubMed] [Google Scholar]
- 52. Troiano RP, Berrigan D, Dodd KW, Mâsse LC, Tilert T, McDowell M. Physical activity in the United States measured by accelerometer. Med Sci Sports Exerc 2008;40:181–188. [DOI] [PubMed] [Google Scholar]
- 53. Miller NE, Strath SJ, Swartz AM, Cashin SE. Estimating absolute and relative physical activity intensity across age via accelerometry in adults. J Aging Phys Act 2010;18:158–170. [DOI] [PMC free article] [PubMed] [Google Scholar]
- 54. Kwan M, Woo J, Kwok T. The standard oxygen consumption value equivalent to one metabolic equivalent (3.5 ml/min/kg) is not appropriate for elderly people. Int J Food Sci Nutr 2004;55:179–182. [DOI] [PubMed] [Google Scholar]
- 55. Zisko N, Carlsen T, Salvesen Ø, Aspvik NP, Ingebrigtsen JE, Wisløff U, et al. New relative intensity ambulatory accelerometer thresholds for elderly men and women: the Generation 100 study. BMC Geriatr 2015;15:97. [DOI] [PMC free article] [PubMed] [Google Scholar]
- 56. Sun F, Norman IJ, While AE. Physical activity in older people: a systematic review. BMC Public Health 2013;13:449. [DOI] [PMC free article] [PubMed] [Google Scholar]
- 57. Santos‐Lozano A, Santín‐Medeiros F, Cristi‐Montero C, Jaén‐Jiménez R, Casajús JA, Garatachea N. GT1M, GT3X and ActiTrainer counts comparison during standardized activities in young, adults and older adults. Nutr Hosp 2016;33:280. [DOI] [PubMed] [Google Scholar]
- 58. Kim J, Wang Z, Heymsfield SB, Baumgartner RN, Gallagher D. Total‐body skeletal muscle mass: estimation by a new dual‐energy X‐ray absorptiometry method. Am J Clin Nutr 2002;76:378–383. [DOI] [PubMed] [Google Scholar]
- 59. Peterson MD, Sen A, Gordon PM. Influence of resistance exercise on lean body mass in aging adults: a meta‐analysis. Med Sci Sports Exerc 2011;43:249–258. [DOI] [PMC free article] [PubMed] [Google Scholar]
- 60. Van Abbema R, De Greef M, Crajé C, Krijnen W, Hobbelen H, Van Der Schans C. What type, or combination of exercise can improve preferred gait speed in older adults? A meta‐analysis. BMC Geriatr 2015;15:72. [DOI] [PMC free article] [PubMed] [Google Scholar]
- 61. Garber CE, Blissmer B, Deschenes MR, Franklin BA, Lamonte MJ, Lee I‐M, et al. American College of Sports Medicine position stand. Quantity and quality of exercise for developing and maintaining cardiorespiratory, musculoskeletal, and neuromotor fitness in apparently healthy adults: guidance for prescribing exercise. Med Sci Sports Exerc 2011;43:1334–1359. [DOI] [PubMed] [Google Scholar]
- 62. Murphy MH, Blair SN, Murtagh EM. Accumulated versus continuous exercise for health benefit: a review of empirical studies. Sports Med 2009;39:29–43. [DOI] [PubMed] [Google Scholar]
- 63. Lee IM, Sesso HD, Paffenbarger RS. Physical activity and coronary heart disease risk in men: does the duration of exercise episodes predict risk? Circulation 2000;102:981–986. [DOI] [PubMed] [Google Scholar]
- 64. Janssen I, Shepard DS, Katzmarzyk PT, Roubenoff R. The healthcare costs of sarcopenia in the United States. J Am Geriatr Soc 2004;52:80–85. [DOI] [PubMed] [Google Scholar]
- 65. von Haehling S, Morley JE, Coats AJS, Anker SD. Ethical guidelines for publishing in the journal of cachexia, sarcopenia and muscle: update 2017. J Cachexia Sarcopenia Muscle 2017;8:1081–1083. [DOI] [PMC free article] [PubMed] [Google Scholar]
Associated Data
This section collects any data citations, data availability statements, or supplementary materials included in this article.
Supplementary Materials
Table S1. Older adults‐specific cut‐off points for classifying PA behaviour.