Abstract
Background
Cancer cachexia is an insidious process characterized by muscle atrophy with associated motor deficits, including diaphragm weakness and respiratory insufficiency. Although neuropathology contributes to muscle wasting and motor deficits in many clinical disorders, neural involvement in cachexia‐linked respiratory insufficiency has not been explored.
Methods
We first used whole‐body plethysmography to assess ventilatory responses to hypoxic and hypercapnic chemoreflex activation in mice inoculated with the C26 colon adenocarcinoma cell line. Mice were exposed to a sequence of inspired gas mixtures consisting of (i) air, (ii) hypoxia (11% O2) with normocapnia, (iii) hypercapnia (7% CO2) with normoxia, and (iv) combined hypercapnia with hypoxia (i.e. maximal chemoreflex response). We also tested the respiratory neural network directly by recording inspiratory burst output from ligated phrenic nerves, thereby bypassing influences from changes in diaphragm muscle strength, respiratory mechanics, or compensation through recruitment of accessory motor pools.
Results
Cachectic mice demonstrated a significant attenuation of the hypoxic tidal volume (0.26mL±0.01mL vs 0.30mL±0.01mL; p<0.05), breathing frequency (317±10bpm vs 344±6bpm; p<0.05) and phrenic nerve (29.5±2.6% vs 78.8±11.8%; p<0.05) responses. On the other hand, the much larger hypercapnic tidal volume (0.46±0.01mL vs 0.46±0.01mL; p>0.05), breathing frequency (392±5bpm vs 408±5bpm; p>0.05) and phrenic nerve (93.1±8.8% vs 111.1±13.2%; p>0.05) responses were not affected. Further, the concurrent hypercapnia/hypoxia tidal volume (0.45±0.01mL vs 0.45±0.01mL; p>0.05), breathing frequency (395±7bpm vs 400±3bpm; p>0.05), and phrenic nerve (106.8±7.1% vs 147.5±38.8%; p>0.05) responses were not different between C26 cachectic and control mice.
Conclusions
Breathing deficits associated with cancer cachexia are specific to the hypoxic ventilatory response and, thus, reflect disruptions in the hypoxic chemoafferent neural network. Diagnostic techniques that detect decompensation and therapeutic approaches that support the failing hypoxic respiratory response may benefit patients at risk for cancer cachectic‐associated respiratory failure.
Keywords: Breathing, Cancer, Chemoreflex and hypoxia
Introduction
Cancer cachexia‐associated motor deficits signify greater morbidity and mortality risk in patients suffering from lung, colon, and pancreatic cancers, among others.1, 2 Despite the growing prevalence of cancer and associated cachexia in the ageing population, the aetiology is not fully understood. Previous work has focused on tumour and/or host‐derived factors that promote muscle catabolism, apoptosis, and/or impair muscle regeneration.3, 4, 5 Efforts to combat several proposed inflammatory factors have successfully limited muscle protein degradation but have yet to improve lifespan in patients with cancer cachexia.6 Similarly, attempts to address catabolism through nutrient supplementation have stabilized weight loss but have not significantly improved mortality outcomes.7 Whereas curing the primary cancer does resolve cachexia and improve patient prognosis, this is not practical in many patients whose condition may be too fragile to tolerate chemotherapy, radiotherapy, or surgical therapy.8, 9 Thus, identifying mechanisms underlying cachexia‐linked motor deficits is an important therapeutic goal for managing cachexia and resolving some forms of cancer.
Although respiratory insufficiency contributes significantly to cachexia‐associated morbidity and mortality,10, 11 little is known concerning cachexia‐linked breathing deficits. Respiratory muscle wasting is a likely contributor,11 but this does not rule out possible neural mechanisms. While neuropathology contributes to cancer‐associated anorexia12 and pain hypersensitivity,13 links between neuropathology and cancer cachexia‐associated motor deficits (respiratory or otherwise) have not been adequately explored.
Here we advance our understanding concerning the aetiology of cancer cachexia‐associated respiratory insufficiency in a murine model: mice inoculated with the C26 colon adenocarcinoma cell line. Using whole‐body plethysmography, we show that cachectic mice retain full capacity to increase ventilation when challenged with hypercapnic or maximal (hypercapnia with hypoxia) chemoreflex activation but do not appropriately increase ventilation to isolated hypoxia. Using neurophysiological recordings of inspiratory phrenic nerve activity, we show that the phrenic response to hypercapnia is fully retained, but the smaller hypoxic response is selectively impaired in proportion to tumour burden. Together, these data provide the first evidence that cancer cachexia impairs neural elements of respiratory control in a way that is unique to hypoxic vs. hypercapnic chemoreflex responses. These findings provide important new insights concerning the pathogenesis of cancer cachexia‐associated respiratory insufficiency and suggest that treatment strategies that address neuronal pathology, in addition to muscle disease, may be needed to preserve breathing control.
Materials and methods
Animals
The University of Florida Animal Care and Use Committee approved all experimental procedures. Mature 7‐week‐old male CD2F1 mice from Charles River Laboratories (Wilmington, MA, USA) weighing ~20 g were used for all experiments. Mice were maintained in a temperature and humidity controlled facility with a 12 h light–dark cycle. Water and standard diet were provided ad libitum.
Cancer inoculation
C26 cells were obtained from the National Cancer Institute Tumor Repository (Frederick, MD, USA) and cultured in RPMI 1640 (Mediatech, Herndon, VA, USA) supplemented with 10% fetal bovine serum, 100 U/mL penicillin, and 100 g/mL streptomycin at 37°C in a 5% CO2 humidified atmosphere. To induce cancer cachexia, 5 × 10⁵ C26 cells were injected subcutaneously into each flank (bilaterally; below the diaphragmatic wall) of mice within the cancer cachexia group. This approach does not constrain ventilation mechanics.11 Mice in the control group received an equal volume injection of phosphate‐buffered saline (PBS) into each flank location.
We favoured the C26 model for three primary reasons: (i) it is a non‐metastatic model of cancer cachexia, lowering the potential for a cancer lesion to invade the central nervous system and indirectly impair breathing control through structural interruption of the neural network; (ii) this same model was used by Roberts et al.,11 the first report of breathing deficits in cancer cachexia; and (iii) the C26 model has a consistent disease progression, making it advantageous in ‘staging’ our observations on breathing.
Plethysmography
Plethysmography protocols were based on previous studies of respiratory control in cachectic mice11, 14; six mice were used for each group, for a total of 12 mice. Each mouse was studied in a longitudinal manner at day 0 (baseline; before inoculation or control injection), day 14 (early disease, no cachexia), or day 25 (end stage, severe cachexia). Mice were first placed into plexiglass plethysmography chambers for 30 min while breathing room air (21% O2, balance N2; flushed at 0.5 L/min) to allow for chamber acclimation. Datum was gathered in 10 s bins throughout plethysmography studies. Following establishment of baseline, a sequential protocol consists of 5 min hypercapnia (7% CO2, 21% O2, balance N2; 0.5 L/min), 1 min hypoxia (10% O2, balance N2; 0.5 L/min), and 1 min maximal chemoreflex response (i.e. hypoxia/hypercapnia; 7% CO2, 10% O2, balance N2; 0.5 L/min); each challenge was separated by 10 min of room air breathing (21% O2, balance N2; 0.5 L/min) and a return of ventilation back to baseline levels as confirmed through pressure recordings. A pressure calibration signal, plethysmograph temperature, mouse body temperature, ambient and chamber pressures, and body mass were used to calculate breath‐by‐breath tidal volume (TV; 14, 15), respiratory frequency (f; breaths per min), and minute ventilation (TV/f). Minute ventilation and TV were normalized to body mass (per 10 g). Data were rejected if there was evidence of pressure fluctuations caused by gross body movements or sniffing behaviour. Prior to and at the conclusion of the study (immediately post‐hypercapnia/hypoxia challenge), mice were removed from the chambers, and their body temperatures recorded; we did not observe consistent changes in body temperature between groups, within individual mice studied during a single protocol, or across time points.
Neurophysiology
Adult male CD2F1 mice (n = 20; Charles River Laboratories) were anaesthetized with intraperitoneal urethane (1.0–1.6 mg/kg i.p.; Sigma, St. Louis, MO, USA) given over 10 min. Full anaesthesia was ensured by monitoring for the absence of a respiratory and heart rate increase to a toe pinch test. This was repeated throughout the surgical protocol and recording sequence to ensure the mouse was appropriately anaesthetized. Body temperature was maintained at 37.5°C using a closed‐loop controlled heating pad (TC‐1000; CWE, Ardmore, PA, USA). Haemoglobin saturation (SaO2) was measured with pulse oximetry (MouseOx; STARR Life Science, Oakmont, PA, USA). The trachea was cannulated for mechanical ventilation (MicroVent; Harvard Apparatus, Holliston, MA, USA), and end tidal carbon dioxide (ETCO2; MicroCapStar; CWE) was set and maintained at 28 ± 3 mmHg PaCO2 through adjustments to breathing frequency (140–160 breaths/min). Tidal volume was set to 0.008 mL × body mass (g). Mice were bilaterally vagotomized to prevent ventilator entrainment, and the carotid artery was catheterized (FunnelCath; Instech Laboratories, Plymouth Meeting, PA, USA) for blood pressure measurements (Statham P‐10EZ pressure transducer and TA‐100 Transducer Amplifier; CWE) and serum blood sampling. Pancuronium bromide (2.5 mg/kg; Hospira, Lake Forest, IL, USA) was delivered intraperitoneally to paralyze respiratory muscles. The phrenic nerve was cut, and efferent activity was recorded using monopolar tungsten suction electrodes (×1000 amplification, model 1700; A‐M Systems, Carlsborg, WA, USA) before processing the signal through bandpass filtering (0.01–10 KHz). Raw neurograms were integrated using a 100 ms time constant (MA‐1000; CWE), digitized (CED Power 1401; Cambridge Electronic Design, Cambridge, UK), and recorded (Spike2 software; Cambridge Electronic Design). To maintain appropriate blood gas and pH homeostasis, a 50:50 sodium bicarbonate:saline solution was administered intraperitoneally (0.1 mL) at 15 min intervals as previously published.15 The integrated phrenic signal was calculated as the peak‐to‐peak raw amplitude obtained from the extracellular recording (volts) before normalizing relative to baseline output. Inspiratory burst frequency was taken as absolute frequency (breaths/min). There were no significant differences of baseline nerve amplitude or frequency between the individual groups (data not shown). Using analysis of variance, no difference in physiology variables (Table S2) or phrenic amplitude was observed between PBS‐injected mice at day 0, day 14, or day 25. Thus, all PBS‐injected mice were combined into a single ‘control group’.
Statistical analyses
Statistics were performed using SigmaStat v12.0 software. Two‐way repeated measures analysis of variance were used with Tukey post hoc comparisons to detect statistically significant changes between and within individual groups. The statistical significance threshold was P < 0.05. Linear regression analysis was performed using SigmaStat with correlation coefficient and P‐value used to signify the extent and significance of the association.
Results
Tidal volume
Control and C26 inoculated mice were observed longitudinally for 25 days with plethysmography measurements at day 0 (before inoculation), day 14 (early disease), and day 25 (end stage). Control and C26 mice exhibited a progressive increase in eupneic (air) tidal volumes over the month long recording period, with no significant difference between the two groups (P = 1.000; Figure 1A). While the control and C26 groups demonstrated an appropriate hypoxic tidal volume response at day 0 and early disease time points, the hypoxic tidal volume response was absent within end‐stage C26 mice. Specifically, there was no difference in C26 hypoxic tidal volumes relative to C26 eupneic volumes (P = 0.182), and C26 hypoxic tidal volumes were lower than weight‐adjusted and age‐matched controls (#; P = 0.008; Figure 1B).
Figure 1.
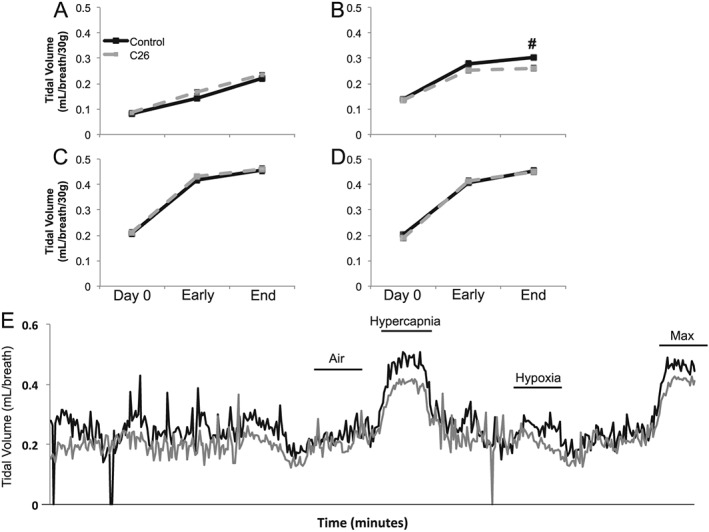
Plethysmography tidal volume measurements. Tidal volume during (A) air, (B) hypoxia, (C) hypercapnia, and (D) maximum respiratory challenges at day 0, early disease (day 14), and end‐stage disease (day 25) time points of control (black solid) and C26 (grey dash) mice. All tidal volumes are weight adjusted. # denotes significant difference between control and C26 mice (P < 0.05). (E) Representative traces for control (black) and C26 (grey) mice demonstrating tidal volumes during normoxia (air), hypercapnia, hypoxia, and maximum respiratory challenges. Represent trace tidal volumes are not weight adjusted.
Control and C26 mice had similar tidal volume responses at all time points during hypercapnia (P > 0.05; Figure 1C) and maximal chemoreflex activation (P > 0.05; Figure 1D). There was no significant difference between the hypercapnic and maximal chemoreflex tidal volume responses at any time in either group (P > 0.05). Both the hypercapnic and maximal chemoreflex tidal volume responses were considerably greater than the tidal volumes generated when breathing room air or isolated hypoxia (P < 0.05), demonstrating that end‐stage C26 mice are capable of increasing their tidal volume during isolated hypercapnic and concurrent hypercapnic/hypoxic conditions. Figure 1E shows representative non‐weight normalized tidal volume traces for control and end‐stage C26 mice.
Breathing frequency
When breathing air (normoxia and normocapnia), breathing frequency was similar between the two groups until end stage, when C26 mice exhibited a higher frequency (#; P < 0.001; Figure 2A). While C26 and control mice showed similar hypoxic breathing frequencies at day 0 and end stage (P > 0.05), early‐stage C26 mice exhibited a reduced hypoxic frequency response vs. age‐matched controls (#; P = 0.048; Figure 2B). Although end‐stage C26 hypoxic breathing frequency was similar to hypoxic frequency in age‐matched controls (P > 0.05), the C26 hypoxic frequency response at end stage was not different from C26 mice breathing air (P = 0.985), signifying an absent respiratory response to hypoxia. Control and C26 mice had similar hypercapnic breathing frequencies (P > 0.05; Figure 2C) that were significantly above room air breathing frequencies at all times (P < 0.05). The frequency response to maximal chemoreflex activation was also similar between the control and C26 mice (P > 0.05; Figure 2D), and both were significantly above air breathing frequencies at all time (P < 0.05).
Figure 2.
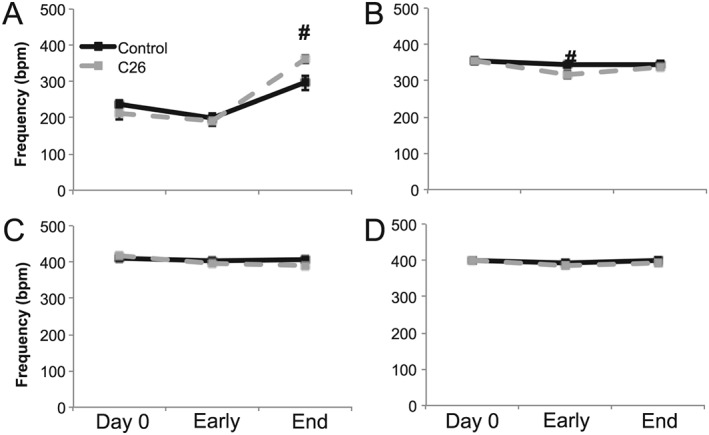
Plethysmography frequency measurements. Breathing frequency during (A) air, (B) hypoxia, (C) hypercapnia, and (D) maximum respiratory challenges at day 0, early disease (day 14), and end‐stage disease (day 25) time points of control (black solid) and C26 (grey dash) mice. # denotes significant difference between control and C26 mice (P < 0.05).
Minute ventilation
At end stage, minute ventilation during air breathing was significantly higher in C26 vs. control mice (#; P = 0.006; Figure 3A). Hypoxia elicited a limited minute ventilation response in C26 mice that was lower than age‐matched control mice at early and late disease stages (P < 0.05). Further, the hypoxic minute ventilation response in end‐stage C26 mice was not significantly different from minute ventilation during room air breathing in C26 mice (P > 0.05). C26 and control mice exhibited similar minute ventilation responses to hypercapnic (P > 0.05) and maximal chemoreflex challenges (P > 0.05), with both significantly elevated from minute ventilation during air breathing (P < 0.05).
Figure 3.
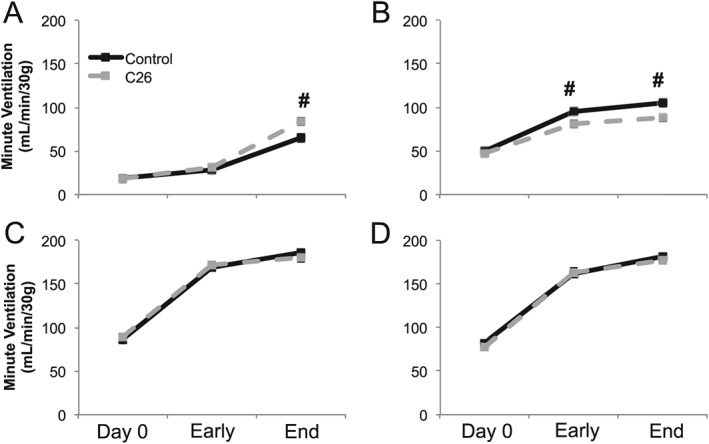
Plethysmography minute ventilation measurements. Weight‐adjusted minute ventilation during (A) air, (B) hypoxia, (C) hypercapnia, and (D) maximum respiratory challenges at day 0, early disease (day 14), and end‐stage disease (day 25) time points of control (black solid) and C26 (grey dash) mice. # denotes significant difference between control and C26 mice (P < 0.05).
Impaired phrenic hypoxic response in end‐stage C26 mice
Because C26 mice had a selective deficit in the hypoxic respiratory response, without a significant impact on the hypercapnic or maximal respiratory responses, we suggest that muscle atrophy alone cannot fully explain C26 cachexia‐associated respiratory deficits; muscle atrophy (with intact neural control) would limit breathing efforts independent of the chemoreflex stimulus. Thus, we hypothesized that a deficit in neural pathways giving rise to the hypoxic chemoreflex response (vs. isolated muscle pathology) must be present.
In anaesthetized, paralyzed, and mechanically ventilated mice, we measured neural respiratory function by recording directly from ligated phrenic nerves. During hypoxia, end‐stage C26 mice exhibited limited hypoxia inspiratory burst amplitude responses vs. control mice, despite similar baseline phrenic burst amplitudes. Specifically, C26 mice's inspiratory burst amplitude during hypoxia was not different from C26 mice breathing room air (P = 0.159; Figure 4A) and was significantly lower than the hypoxic amplitude response observed in control mice (P = 0.020; Figure 4A). There was a negative correlation between tumour size and the hypoxic phrenic response. Mice with larger tumours had smaller hypoxic phrenic responses (R 2 = −0.625; P = 0.001; Figure 4B).
Figure 4.
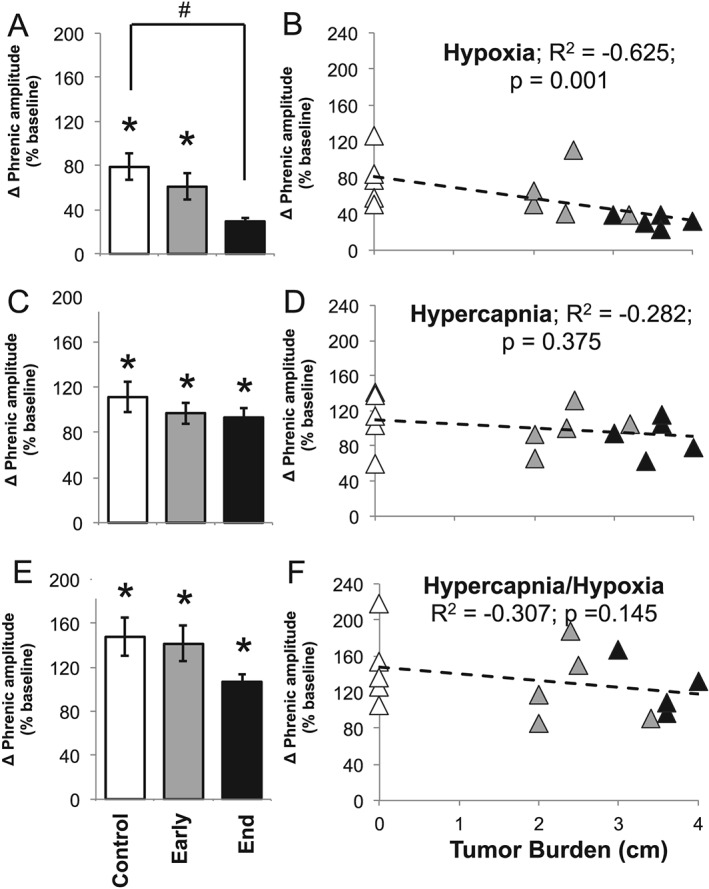
Neurophysiology: phrenic nerve amplitude. Relative (baseline) change of phrenic nerve amplitude during (A) hypoxia, (C) hypercapnia, and (E) maximum respiratory challenges within control, early disease (day 14), and end‐stage disease (day 25) mice. * denotes significant difference from starting baseline (P < 0.05), and # denotes significant difference from control group (P < 0.05). Linear regression analysis of tumour burden and phrenic amplitude during (B) hypoxia, (D) hypercapnia, and (F) hypercapnia/hypoxia (maximum) respiratory challenges within control (white triangle), early disease (grey triangle), and end‐stage (black triangle) mice.
Conversely, hypercapnia and maximal phrenic burst amplitudes were not significantly different between control and C26 mice at early‐stage or end‐stage disease (P > 0.05; Figure 4C and 4E). Further, hypercapnia and hypercapnia phrenic burst responses were significantly above baseline phrenic burst amplitude (P < 0.05; Figure 4C and 4E). Thus, the blunted hypoxic phrenic burst response was not attributable to an inability to increase phrenic motor output during hypoxic challenges. Finally, there was no significant correlation between tumour size and hypercapnia or maximal chemoreflex activation responses (P > 0.05; Figure 4D and 4F).
Neural respiratory frequency was unaffected by cancer cachexia
In contrast to the observed deficits in the phrenic hypoxic amplitude response, there were no significant differences in hypoxia firing frequency recorded from the phrenic nerve at any disease stage (P > 0.05; Figure 5A and 5B). Further, there was no difference in neural firing frequency during hypercapnia or maximal chemoreflex activation (P > 0.05; Figure 5C–5F).
Figure 5.
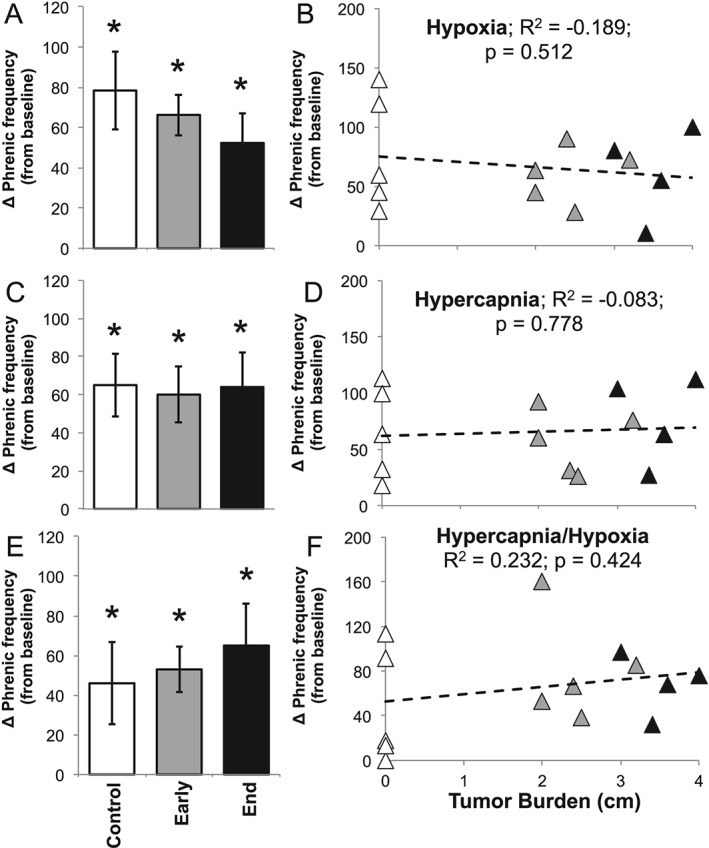
Neurophysiology: phrenic nerve frequency. Absolute phrenic nerve frequency during (A) hypoxia, (C) hypercapnia, and (E) maximum respiratory challenges within control, early disease (day 14), and end‐stage disease (day 25) mice. * denotes significant difference from starting baseline (P < 0.05). Linear regression analysis of tumour burden and phrenic frequency during (B) hypoxia, (D) hypercapnia, and (F) hypercapnia/hypoxia (maximum) respiratory challenges within control (white triangle), early disease (grey triangle), and end‐stage (black triangle) mice.
Discussion
Advances in understanding of cancer pathogenesis have led to the development of targeted therapies for improved patient outcomes,16 yet attempts to address the morbidity and mortality related to cancer cachexia have made minimal progress.4 Current gaps concerning the aetiology and pathophysiology of cancer cachexia‐associated motor deficits have likely constrained progress. Here, we identify selective neural deficits as a potential contributor to respiratory insufficiency in a murine model of cancer cachexia. Using the well‐studied C26 cachectic mouse model, we demonstrate that cancer cachexia selectively impairs neural mechanisms giving rise to the hypoxic respiratory response, with minimal impact on the considerably larger reflex responses to hypercapnic or maximal hypercapnic/hypoxic stimuli. Although the specific site of impairment in the hypoxic chemoreflex is not known, it must be proximal to the site of convergence with the hypercapnic chemoreflex. Thus, cachexia likely impairs the carotid body chemoreceptors or integrative sites of their chemoafferent neurons in the medullary nucleus of the solitary tract. Future studies concerning the site/mechanism of this neural deficit may help identify novel approaches for preserving breathing function and prolonging ventilator independence for those suffering from incurable cancer cachexia.
While previous studies of cachexia‐associated respiratory deficits focused on the prominent molecular and functional signs of muscle dysfunction,11 the present study adds to our understanding by identifying central neural deficits as an central contributing factor. These observations do not necessarily conflict with the earlier report of Roberts et al.11 but provide a more complete explanation of physiological deficits observed in both studies. Specifically, Roberts et al. report a decrease in the hypoxic respiratory frequency response in cachectic C26 vs. control mice, similar to our findings in this study. Despite the strong correlation of muscle atrophy and respiratory insufficiency, because frequency arises from neurogenic mechanisms, impaired frequency responses to hypoxia do not support primary muscle limitations. Breathing frequency is determined by central neural mechanisms of rhythm generation modified by mechanosensory and chemosensory feedback. Once established, frequency is projected through respiratory pre‐motor and motor neurons to the respiratory muscles. In other words, breathing frequency is largely independent of muscle properties, except in cases of direct neuromuscular blockade, which would present as non‐selective frequency deficits. Our data and the findings reported by Roberts et al. are consistent with the present conclusion that cachexia impairs neural mechanisms uniquely associated with the hypoxic ventilatory response, thus leading to respiratory insufficiency.
Using similar plethysmography techniques to Roberts et al.,11 we confirmed that cancer cachexia impairs the hypoxic respiratory response (Figure 1). Specifically, neither tidal volume nor frequency appropriately increased in response to hypoxia. In the present study, we extended this finding by investigating respiratory responses to more potent chemosensory stimuli: hypercapnia and maximal chemoreflex activation. The ample tidal volume responses observed during isolated hypercapnia and maximal activation challenges were unaffected by cachexia and were both greater than responses observed during hypoxia alone. Thus, cachectic mice retain full capacity to increase breathing frequency and tidal volume during hypoxic conditions (hypercapnia with hypoxia), despite an absent response to selective hypoxia.
We further confirmed a neural deficit unique to the hypoxic chemoreflex by directly recording inspiratory burst activity from ligated phrenic nerves. Similar to the spontaneously breathing mice studied with plethysmography, phrenic nerve activity during hypercapnia and maximal chemoreflex activation was comparable between cachectic and control mice, demonstrating minimal (if any) impairment in common neural pathways of the hypercapnic phrenic response (e.g. ventral respiratory group, phrenic motor neurons) with respiratory muscles being removed from the equation in this experimental preparation (Figure 6). We conclude that suppression of the hypoxic response (i.e. hypoxic respiratory insufficiency) is due to neuropathology, either primary neuropathology directly from cachectic initiated processes or secondary from muscle‐mediated pathology (e.g. muscle inflammation).
Figure 6.
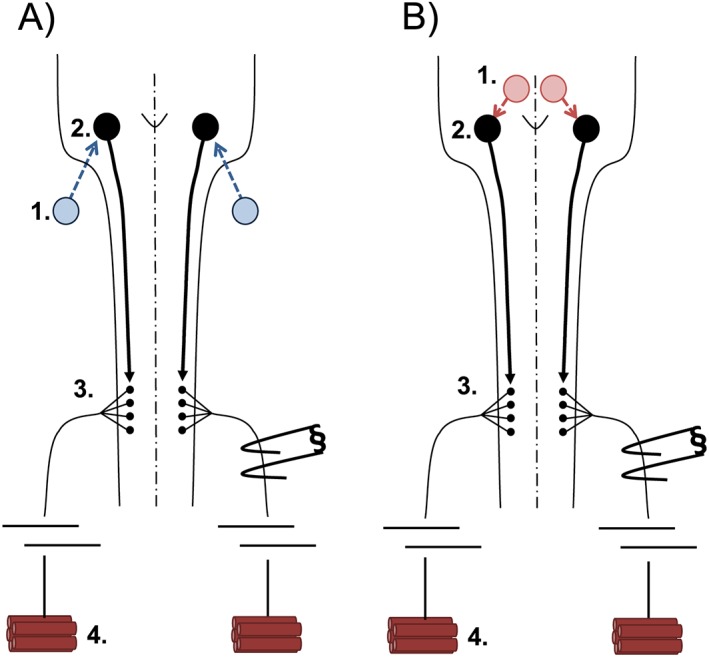
Diagram of the afferent–efferent neural control network. (A) The hypoxic respiratory response begins at peripheral carotid bodies (1) that synapse onto central respiratory modulators of the medullary brainstem (2). Brainstem neurons project to respiratory spinal motor neurons (3) that exit the central nervous system to synapse onto respiratory muscle fibres of the diaphragm (4). (B) The hypercapnia respiratory response begins at central chemoreceptors (1) that synapse onto central respiratory modulators of the medullary brainstem (2). Brainstem neurons project to respiratory spinal motor neurons (3) that exit the central nervous system to synapse onto respiratory muscle fibres of the diaphragm (4).
Potential sites of deficits in the hypoxic chemoreflex
Chemoreflex‐induced respiratory changes require (i) chemosensation, (ii) chemoafferent transmission to or within the central nervous system, (iii) recruitment of spinal respiratory motor neurons, and (iv) respiratory muscle activation.17, 18 Hypoxic and hypercapnic chemoreflexes share common elements, including brainstem neurons of the ventral respiratory group, spinal respiratory motor neurons, and respiratory muscles. On the other hand, neuronal elements upstream from respiratory pre‐motor neurons diverge considerably in these chemoreflexes. For example, hypoxic sensory perception occurs predominantly in peripheral, carotid body chemoreceptors17, 19 that project through the glossopharyngeal nerve to the nucleus of the solitary tract; there, they are processed en route to the ventral respiratory group.20 Conversely, hypercapnic chemoreflexes are dominated by CO2 sensitive chemoreceptors distributed throughout the brainstem, including the retrotrapezoid nucleus, nucleus of the solitary tract, raphe nuclei, and locus coeruleus.21 Each ultimately projects to the ventral respiratory group, providing pre‐motor inputs to spinal respiratory motor neurons. Although we cannot discern the specific site(s) of functional impairment in the hypoxic chemoreflex based on experimental observations made here, we suggest it likely arises from direct actions on carotid body chemoreceptors, their chemoafferent neurons, and/or integrative sites in the nucleus of the solitary tract, thus enabling selective deficits in the hypoxic response with retained hypercapnic respiratory drive.
Selective mechanistic deficits in the hypoxic chemoreflex
Systemic catabolism is a hallmark feature of cancer cachexia2 and may account for observed respiratory deficits. For example, hypoxia deceases the metabolic rate in rodents (such as mice) by reducing body temperature and secondarily blunting the hypoxic ventilatory chemoreflex.22, 23 Within the present study, temperature monitoring during plethysmography and closed‐loop temperature regulation during neurophysiology experiments ensured that changes in body temperature did not account for the results of these studies. Further, we assessed arterial O2 saturations and expiratory CO2 levels during neurophysiology experiments to ensure comparable blood gas and acid–base values between cachectic and control mice (Table S2). Because blunted hypoxic responses persisted despite careful regulation of relevant variables, primary metabolic influences are unlikely to account for the observed breathing deficits in C26 mice. Further, because the hypoxic chemoreflex was diminished while the hypercapnia and max plethysmography ventilation responses were left relatively intact, muscle pathology would not be sufficient to explain the observed pattern of stimulus selective respiratory insufficiency.
Alternatively, neurochemical modulation of afferent reflexes differs among respiratory stimuli and may account for the selective hypoxic respiratory deficits. For example, knockout mice deficient in nitric oxide synthase‐1, an important source of nitric oxide, exhibit augmented hypoxic responses with minimal impact on the hypercapnic ventilatory response.24 In addition, systemic inflammation can elicit long‐lasting changes in carotid body sensitivity that manifests as altered neural respiratory responses to hypoxia.20, 25 Given the broad variability in tumour‐derived inflammatory signals,6 the exact mechanism of cancer cachexia‐induced respiratory insufficiency is likely to differ among cancer types.
Significance
Our study provides the first clear evidence that neural pathology contributes to cancer cachexia‐associated respiratory insufficiency and that this deficit is specific to elements giving rise to the hypoxic response. While the exact mechanistic basis of this impairment has not been identified, this study lays a foundation for future investigations concerning the pathogenesis of neural respiratory insufficiency in cancer cachexia. This is an important conceptual advance with clinical implications. Given the robust capacity for compensation in respiratory motor control,26, 27 subtle deficits are often masked until late in disease progression, at which point rehabilitation may not be effective.9 Therefore, targeted diagnostic techniques are needed to identify early signs of neuronal decompensation to enable timely intervention prior to respiratory failure and ventilator dependence. Further work is still needed to identify the best approach for supporting patients with cancer cachexia‐associated respiratory insufficiency.
Conflict of Interest
The authors have no conflicts of interest to declare.
Supporting information
Supplemental Table 1: Respiratory values during plethysmography studies. Values are expressed as mean ± SEM.
Supplemental Table 2: Physiological variables during neurophysiology studies. No significant difference was observed within expiratory carbon dioxide, oxygen (O2) saturation at baseline, or oxygen (O2) saturation during hypoxic challenge. Similar oxygen saturations were observed during hypoxic and hypercapnia/hypoxia challenges (not recorded). Values are expressed as mean ± SEM.
Acknowledgements
We acknowledge support from the UF McKnight Brain Institute, NIH HL105511 (G.S.M.), NIH 2R01HD052682‐06A1 (D.D.F.), and NIH R01AR060209 (A.R.J.). D.P.F. was supported by NIH F30HL126351, the University of Wisconsin Medical Scientist Training Program (T32GM008692), and a UNCF/Merck graduate research fellowship. The authors certify that they comply with the ethical guidelines for authorship and publishing of the Journal of Cachexia, Sarcopenia and Muscle.28
Fields, D. P. , Roberts, B. M. , Simon, A. K. , Judge, A. R. , Fuller, D. D. , and Mitchell, G. S. (2019) Cancer cachexia impairs neural respiratory drive in hypoxia but not hypercapnia. Journal of Cachexia, Sarcopenia and Muscle, 10: 63–72. 10.1002/jcsm.12348.
References
- 1. Aoyagi T, Terracina KP, Raza A, Matsubara H, Takabe K. Cancer cachexia, mechanism and treatment. World J Gastroint Oncol 2015;7:17–29. [DOI] [PMC free article] [PubMed] [Google Scholar]
- 2. Fearon K, Strasser F, Anker SD, Bosaeus I, Bruera E, Fainsinger RL, et al. Definition and classification of cancer cachexia: an international consensus. Lancet Oncol 2011;12:489–495. [DOI] [PubMed] [Google Scholar]
- 3. Argilés JM, Busquets S, Toledo M, López‐Soriano FJ. The role of cytokines in cancer cachexia. Curr Opin Support Palliat Care 2009;3:263–268. [DOI] [PubMed] [Google Scholar]
- 4. Aversa Z, Costelli P, Muscaritoli M. Cancer‐induced muscle wasting: latest findings in prevention and treatment. Ther Adv Med Oncol 2017;9:369–382. [DOI] [PMC free article] [PubMed] [Google Scholar]
- 5. Zhou X, Wang JL, Lu J, Song Y, Kwak KS, Jiao Q, et al. Reversal of cancer cachexia and muscle wasting by ActRIIB antagonism leads to prolonged survival. Cell 2010;142:531–543. [DOI] [PubMed] [Google Scholar]
- 6. Coussens LM, Werb Z. Inflammation and cancer. Nature 2002;420:860–867. [DOI] [PMC free article] [PubMed] [Google Scholar]
- 7. Gullet NP, Mazurak VC, Hebbar G, Ziegler TR. Nutritional interventions for cancer‐induced cachexia. Curr Probl Cancer 2011;35:58–90. [DOI] [PMC free article] [PubMed] [Google Scholar]
- 8. Prado CM, Baracos VE, McCargar LJ, Mourtzakis M, Mulder KE, Reiman T, et al. Body composition as an independent determinant of 5‐fluorouracil‐based chemotherapy toxicity. Clin Cancer Res 2007;13:3264–3268. [DOI] [PubMed] [Google Scholar]
- 9. Ali R, Baracos VE, Sawyer MB, Bianchi L, Roberts S, Assenat E, et al. Lean body mass as an independent determinant of dose‐limiting toxicity and neuropathy in patients with colon cancer treated with FOLFOX regiments. Cancer Med 2016;5:607–616. [DOI] [PMC free article] [PubMed] [Google Scholar]
- 10. Feathers LS, Wilcock A, Manderson C, Weller R, Tattersfield AE. Measuring inspiratory muscle weakness in patients with cancer and breathlessness. J Pain Symptom Manage 2003;25:305–306. [DOI] [PubMed] [Google Scholar]
- 11. Roberts BM, Ahn B, Smuder AJ, Al‐Rajhi M, Gill LC, Beharry AW, et al. Diaphragm and ventilator dysfunction during cancer cachexia. FASEB J 2013;27:2600–2610. [DOI] [PMC free article] [PubMed] [Google Scholar]
- 12. Utech AE, Tadros EM, Hayes TG, Garcia JM. Predicting survival in cancer patients: the role of cachexia and hormonal, nutritional and inflammatory markers. J Cachexia Sarcopenia Muscle 2012;3:245–251. [DOI] [PMC free article] [PubMed] [Google Scholar]
- 13. Mantyh PW. Cancer pain and its impact on diagnosis, survival and quality of life. Nature Rev Neuro 2006;7:797–809. [DOI] [PubMed] [Google Scholar]
- 14. Drorbaugh JE, Fenn WO. A barometric method for measuring ventilation in newborn infants. Pediatrics 1955;16:81–87. [PubMed] [Google Scholar]
- 15. Turner SM, Elallah MK, Hoyt AK, Greer JJ, Fuller DD. Ampakine CX717 potentiates intermittent hypoxia‐induced hypoglossal long‐term facilitation. J Neurophysiol 2016;116:1232–1238. [DOI] [PMC free article] [PubMed] [Google Scholar]
- 16. Fearon K, Arends J, Baracos V. Understanding the mechanisms and treatment options in cancer cachexia. Nat Rev Clin Oncol 2013;10:90–99. [DOI] [PubMed] [Google Scholar]
- 17. Prabhakar NR. Sensing hypoxia: physiology, genetics and epigenetics. J Physiol 2013;591:2245–2257. [DOI] [PMC free article] [PubMed] [Google Scholar]
- 18. Hodges MR, Richerson GB. Medullary serotonin neurons and their roles in central respiratory chemoreception. Respir Physiol Neurobiol 2010;173:256–263. [DOI] [PMC free article] [PubMed] [Google Scholar]
- 19. Pamenter ME, Powell FL. Time domains of the hypoxic ventilator response and the molecular basis. Compr Physiol 2016;6:1345–1385. [DOI] [PMC free article] [PubMed] [Google Scholar]
- 20. Kumar P, Prabhakar NR. Peripheral chemoreceptors: function and plasticity of the carotid body. Compr Physiol 2012;2:141–219. [DOI] [PMC free article] [PubMed] [Google Scholar]
- 21. Guyenet PG, Bayliss DA. Neural control of breathing and CO2 homeostasis. Neuron 2015;87:946–961. [DOI] [PMC free article] [PubMed] [Google Scholar]
- 22. Saiki C, Matsuoka T, Mortola JP. Metabolic‐ventilatory interaction in conscious rats: effect of hypoxia and ambient temperature. J Appl Physiol 1994;76:1594–1599. [DOI] [PubMed] [Google Scholar]
- 23. Morgan BJ, Adrian R, Bates ML, Dopp JM, Dempsey JA. Quantifying hypoxia‐induced chemoreceptor sensitivity in the awake rodent. J Appl Physiol 2014;117:816–824. [DOI] [PMC free article] [PubMed] [Google Scholar]
- 24. Kline DD, Tang T, Huang PL, Prabhakar NR. Altered respiratory responses to hypoxia in mutant mice deficient in neuronal nitric oxide synthase. J Physiol 1998;511:273–287. [DOI] [PMC free article] [PubMed] [Google Scholar]
- 25. Huxtable AG, Vinit S, Windelborn JA, Crader SM, Guenther CH, Watters JJ, et al. Systemic inflammation impairs respiratory chemoreflexes and plasticity. Respir Physiol Neurobiol 2011;178:482–489. [DOI] [PMC free article] [PubMed] [Google Scholar]
- 26. Nichols NL, Van Dyke J, Nashold L, Satriotomo I, Suzuki M, Mitchell GS. Ventilatory control in ALS. Respir Physiol Neurobiol 2013;189:429–437. [DOI] [PMC free article] [PubMed] [Google Scholar]
- 27. Fields DP, Mitchell GS. Spinal metaplasticity in respiratory motor control. Front Neural Circuits 2015;9:2. [DOI] [PMC free article] [PubMed] [Google Scholar]
- 28. von Haehling S, Morley JE, Coats AJS, Anker SD. Ethical guidelines for publishing in the Journal of Cachexia, Sarcopenia and Muscle: update 2017. J Cachexia Sarcopenia Muscle 2017;8:1081–1083. [DOI] [PMC free article] [PubMed] [Google Scholar]
Associated Data
This section collects any data citations, data availability statements, or supplementary materials included in this article.
Supplementary Materials
Supplemental Table 1: Respiratory values during plethysmography studies. Values are expressed as mean ± SEM.
Supplemental Table 2: Physiological variables during neurophysiology studies. No significant difference was observed within expiratory carbon dioxide, oxygen (O2) saturation at baseline, or oxygen (O2) saturation during hypoxic challenge. Similar oxygen saturations were observed during hypoxic and hypercapnia/hypoxia challenges (not recorded). Values are expressed as mean ± SEM.


