

Abstract
Background
Despite several muscle mass measures being used in the current definitions of sarcopenia, their usefulness is uncertain because of limited data on their association with health outcomes. The aim of the study was to compare the performance of different muscle mass measures for predicting incident osteoporosis in postmenopausal women.
Methods
This study included data from 149 166 participants (aged 60.3 ± 5.5 years) as part of the UK Biobank cohort. Body composition was assessed using bioelectrical impedance. The muscle mass measures included were total body skeletal muscle mass (SMM) and appendicular SMM (aSMM) divided by height squared (ht2), derived residuals, SMM, SMM adjusted for body mass (SMM/bm × 100), and aSMM normalized for body mass index (aSMM/BMI). Diagnoses of the events were confirmed by primary care physicians and coded according to the World Health Organization's International Classification of Diseases 10th Revision (ICD‐10: M80‐M82).
Results
Over a median follow‐up of 6.75 (5th to 95th percentile interval, 1.53 to 8.37) years, 394 newly diagnosed cases of osteoporosis occurred, with 40 (10.2%) cases being associated with a pathological fracture. SMM/ht2, aSMM/ht2 residual, and SMM were lower in postmenopausal women with osteoporosis compared with women without (all P < 0.0001), while SMM/bm × 100 (P = 0.003), but not aSMM/BMI (P = 0.59), was higher in the osteoporosis group. The unadjusted rates of osteoporosis increased with decreasing quintiles for SMM/ht2, aSMM/ht2, residuals, and SMM (all P trend <0.0001), while the incidence of osteoporosis increased with increasing SMM/bm × 100 (P trend =0.001), but not for aSMM/BMI (P = 0.45). After minimally adjusting for age and after full adjustment, SMM/ht2, aSMM/ht2, and SMM were the only measure that consistently predicted osteoporosis in the total group of postmenopausal women [hazard ratio (HR) 0.65–0.67, all P ≤ 0.0001], in lean women (HR 0.62–0.68; all P ≤ 0.001), and women with increased adiposity (HR 0.64–0.68; all P ≤ 0.01). In fully adjusted models, the changes in the R 2 statistic were 13.4%, 11.6%, and 15.3% for the SMM/ht2 (aSMM/ht2), residual, and SMM, but only 4.9% and 1.3% for SMM/bm × 100 and aSMM/BMI.
Conclusions
Muscle mass measures adjusted for height only (SMM/ht2, aSMM/ht2) appear to be better muscle‐relevant risk factors for incident osteoporosis in postmenopausal women, including when stratified into lean participants and participants with increased adiposity.
Keywords: Muscle mass measures, Osteoporosis, Postmenopausal women, Skeletal muscle mass, Appendicular skeletal muscle mass
Introduction
Menopause is accompanied by pronounced changes in body composition including loss of bone (osteoporosis) and muscle (sarcopenia), often in the presence of increased adiposity and fat redistribution towards central‐type obesity.1, 2, 3 Osteoporosis, a skeletal disease characterized by low bone mass and microarchitectural deterioration of bone tissue, predisposes to skeletal fragility and increases fracture risk.2 It is typically diagnosed on the basis of a bone mineral density (BMD) T‐score ≤ −2.5, as assessed by dual‐energy X‐ray absorptiometry (DXA).2 Because of its association with fractures, osteoporosis is a significant cause of morbidity and mortality and results in substantial burden for both individuals and healthcare systems.4 Current estimates suggest that approximately 50% of women over 50 years old are at risk of osteoporotic fractures.5
In contrast to osteoporosis, sarcopenia remains poorly defined, with lack of consensus about its operational definition.6 Nevertheless, it is especially common in postmenopausal women, with prevalence reaching up to 30% depending on the definition and population used.3 Thus far, proposed definitions are based on muscle mass alone7, 8, 9 or combined with muscle function (e.g. grip strength) and/or physical performance (e.g. gait speed).10, 11, 12, 13 Further perplexing the current debate, a number of muscle mass measures and different threshold for these measures have been suggested. These include total body or appendicular muscle mass adjusted for height only,7, 8, 11 height and fat mass,9 or body size [i.e. body mass index (BMI)13 or body mass12]. Despite the plethora of muscle mass measures, there is scarcity of data on their association with health outcomes.
Some previous studies that explored the relationship between osteoporosis and sarcopenia have yielded mixed results.14, 15, 16, 17, 18 Studies are limited by small sample size,14, 15, 17, 18 or cross‐sectional design,14, 15, 16, 17, 18 making extrapolation to the general population challenging. Appendicular muscle mass adjusted for height is the most widely used measure of sarcopenia14, 15, 16, 17, 18; however, there is a lack of comparative data using other available measures of muscle mass in relation to bone health outcomes. This is particularly important for population groups susceptible to poor musculoskeletal health such as postmenopausal women.
We, therefore, compared muscle mass measures as predictors of osteoporosis with or without pathological fracture in a large cohort of postmenopausal women. A secondary goal was to explore the performance of the muscle mass measures in predicting incident osteoporosis in postmenopausal women, when stratified into lean and with increased adiposity.
Methods
Study population
UK Biobank is an ongoing, prospective cohort of 502 635 participants (5.5% response rate) aged 40–69 years. All participants were recruited between 2006 and 2010 and attended one of the 22 assessment centres across UK, where they provided sociodemographic, lifestyle, and health information and underwent physical and medical assessments.19 The UK Biobank protocol complied with the Declaration of Helsinki and was approved by the North West Multi‐Centre Research Ethics Committee. Participants provided their informed consent on the touchscreen before taking part. The UK Biobank protocol is available online (http://www.ukbiobank.ac.uk/wp‐content/uploads/2011/11/UK‐Biobank‐Protocol.pdf). Additional details of the UK Biobank have been published elsewhere.19 For the present analysis, we excluded all men (n = 229 172), premenopausal women (n = 64 091), postmenopausal women with a prior diagnosis of osteoporosis at baseline, or missing information (n = 60 206). Thus, the number of participants statistically analysed totalled 149 166.
Measurements at baseline
Sociodemographic and lifestyle characteristics
Postmenopausal women completed a touchscreen questionnaire (available online: http://www.ukbiobank.ac.uk/resources/) including questions on sociodemographic characteristics, health status, and lifestyle habits. Participants self‐reported their age, sex, and ethnicity. Ethnicity was categorized as White or other (mixed, Asian, Black, Chinese, and other). A Townsend deprivation score was computed for all participants using information about employment, car and home ownership, and household overcrowding.20 A higher Townsend deprivation score is indicative of greater levels of an area's socio‐economic deprivation.20 Participants reported their smoking status (never, previous, or current) and their alcohol intake (never, previous, or current). Data on physical activity including frequency (number of days in a typical week that participants performed 10 min or more of walking, moderate, and vigorous physical activity) and duration (minutes spent on each activity category on a typical day) were collected by asking questions similar to those included in the International Physical Activity Questionnaire.21 For each activity category, the frequency was multiplied by the duration and the metabolic equivalent value (3.3 for walking, 4.0 for moderate physical activity, and 8.0 for vigorous physical activity), which were then summed to generate a score of metabolic equivalent minutes of physical activity per week for each participant.
Medical history and current medications
Self‐reported data on medical conditions were collected at baseline by asking participants whether a doctor has diagnosed any cancer or diabetes. Participants reported if they had undergone bilateral oophorectomy or hysterectomy or were on hormone replacement therapy (HRT). Self‐reported data on fracture occurrence (yes or no) over the past 5 years were also collected. Information on X‐ray verification was unavailable.
Quantitative heel ultrasound
Quantitative ultrasound of the heel was performed using the Sahara Clinical Sonometer (Hologic, Bedford, Massachusetts) according to a standardized protocol. Trained staff checked if participants were able to undertake both left and right heel ultrasound measurement. Those with open wounds, breaks or sores around the heel, or metal parts (such as pins) in the heel did not undertake measurement of that heel. Each centre used the same machine model, and quality control was performed with a phantom on a daily basis as per manufacturer's instructions. The mean values for BMDs (g/cm2) and BMD T‐scores for the left and right heel were computed.
Anthropometric and bioelectrical impedance measurements
Height was measured using the SECA 240 height measure (SECA, Hamburg, Germany). Participants removed their socks and footwear and stood flat footed with their heels against a back plate. Body mass was measured to the nearest 0.1 kg using a segmental body composition analyser (Tanita BC‐418MA, Tokyo, Japan). Height and weight were used to calculate BMI as weight (kg) divided by height squared (m2). Waist circumference was measured at the level of the umbilicus using a tape measure. All these measurements were performed by trained staff.
Skeletal muscle mass (SMM) was calculated using the bioelectrical impedance analysis (BIA) equation published previously by Janssen and colleagues22:
where ht2 = height in centimetres squared; R = resistance in ohms; for gender, men = 1 and women = 0; and age is in years.
Appendicular SMM (aSMM), representing the sum of SMM in arms and legs, was calculated using the equation provided by Wang et al.23: aSMM = SMM/1.33.
Muscle mass measures
For the purpose of the present analysis, we included five muscle mass measures previously used in sarcopenia definitions.7, 8, 9, 10, 11, 12, 13 Unadjusted SMM was also considered for comparisons. Specifically, SMM and aSMM were divided by height squared (SMM/ht2 and aSMM/ht2).7, 8, 10, 11 Based on the definition proposed by Delmonico et al.9 and previously published methods,24 the relationship between appendicular fat‐free mass on height (m) and fat mass (kg) was modelled using linear regression analysis and the standardized residuals of the regression were computed. Muscle mass was also adjusted for body size; aSMM was divided by BMI (aSMM/BMI),13 and SMM was divided by body mass and multiplied by 100 (SMM/bm × 100).12, 25
Assessment of outcome
Via the Health and Social Care Information Centre for English and Welsh participants and the Information Services Department for Scottish participants, we ascertained the diagnosis of osteoporosis with or without a pathological fracture until 31 January 2016 for England and Wales and 30 November 2015 for Scotland. Diagnoses of the events were confirmed by primary care physicians and coded according to the World Health Organization's International Classification of Diseases 10th Revision (ICD‐10: M80‐M82).
Statistical analysis
For database management and statistical analysis, we used SAS software, version 9.4 (SAS Institute Inc., Cary, NC, USA). We compared means and proportions by the standard normal z‐test and the χ2 statistic. Statistical significance was set at a level of 0.05 on two‐sided tests.
We analysed the prognostic significance of the muscle mass measures by means of both categorical and continuous analysis. In categorical analysis, we plotted unadjusted incidence rates by quintiles of the muscle mass measures' distribution. For the continuous analysis, we used Cox proportional hazard regression to calculate standardized relative hazard ratios while initially adjusting for age and then allowing for additional covariables and potential confounders in the total group and in groups stratified by BMI (<25 and ≥25 kg·m−2), waist circumference (<88 and ≥88 cm), and whole body fat percentage (<35 and ≥35%).26, 27
Using the forward stepwise procedure, we included baseline age, ethnicity, physical activity, use of HRT, self‐reported smoking and alcohol use, and self‐reported diagnosed cancer and diabetes as covariables. We checked the proportional hazards assumption by the Kolmogorov‐type supremum test, as implemented in the PROC PHREG procedure of the SAS package. Finally, we applied the generalised R 2 statistic to assess the risks explained in Cox regression28 by adding the different muscle mass measures separately to models already including the previously mentioned covariables.
Results
Baseline characteristics
The baseline characteristics of the postmenopausal women with and without osteoporosis are presented in Table 1. The women with diagnosed osteoporosis were older (P < 0.0001) and had lower fat mass (P < 0.0001), SMM (P < 0.0001), and aSMM (P < 0.0001) compared with those without osteoporosis. There were no difference in physical activity between the groups (P = 0.80). Mean heel BMD at baseline was lower in the osteoporosis group (P < 0.0001) and had experienced more fractures in the previous 5 years (P < 0.0001). SMM/ht2, aSMM/ht2, residuals, and SMM were lower in the osteoporosis group (all P < 0.0001), while SMM/bm × 100 (P = 0.003), but not aSMM/BMI (P = 0.59), was higher in the osteoporosis group (Table 2).
Table 1.
Baseline characteristics of postmenopausal women with and without osteoporosis
| Without osteoporosis (n = 148772) | Osteoporosis (n = 394) | P | |
|---|---|---|---|
| Demographics | |||
| Age (years) | 60.3 ± 5.5 | 62.6 ± 4.9 | <0.0001 |
| Age at menopause (years) | 49.7 ± 5.1 | 48.1 ± 6.2 | <0.0001 |
| Relative deprivation | −1.46 ± 2.98 | −1.45 ± 2.89 | 0.97 |
| Ethnicity | 0.57 | ||
| European, n (%) | 133098 (89.5) | 356 (90.4) | |
| Other, n (%) | 15674 (10.5) | 38 (9.6) | |
| Anthropometry | |||
| Body weight (kg) | 70.9 ± 13.3 | 64.9 ± 11.2 | <0.0001 |
| Body height (cm) | 161.9 ± 6.2 | 160.6 ± 6.2 | <0.0001 |
| BMI (kg/m2) | 27.1 ± 5.0 | 25.2 ± 4.3 | <0.0001 |
| Waist circumference (cm) | 85.0 ± 12.2 | 81.8 ± 11.3 | <0.0001 |
| Fat mass (kg) | 27.1 ± 9.7 | 23.4 ± 7.8 | <0.0001 |
| SMM (kg) | 17.1 ± 2.64 | 16.0 ± 2.20 | <0.0001 |
| aSMM (kg) | 12.8 ± 1.6 | 12.0 ± 1.7 | <0.0001 |
| Lifestyle, bone, and health | |||
| Physical activity (MET‐min/week) | 1534 (212–8849) | 1511 (200–8241) | 0.80 |
| Alcohol use | 0.028 | ||
| Never, n (%) | 8952 (6.0) | 32 (8.1) | |
| Previous, n (%) | 5551 (3.7) | 22 (5.6) | |
| Current, n (%) | 134157 (90.2) | 340 (86.3) | |
| Smoking | 0.50 | ||
| Never, n (%) | 85494 (57.5) | 234 (59.4) | |
| Previous, n (%) | 50498 (33.9) | 124 (31.5) | |
| Current, n (%) | 12187 (8.2) | 36 (9.1) | |
| Bone and health | |||
| Heel BMD (g/cm2) | 0.50 ± 0.12 | 0.41 ± 0.10 | <0.0001 |
| Heel BMD T‐score (SD) | −0.72 ± 1.06 | −1.50 ± 0.93 | <0.0001 |
| Fractures in last 5 years, n (%) | 16834 (11.3) | 121 (30.7) | <0.0001 |
| HRT, n (%) | 70015 (47.1) | 220 (55.8) | 0.0006 |
| Bilateral oophorectomy, n (%) | 8161 (5.5) | 34 (8.6) | 0.006 |
| Hysterectomy, n (%) | 17312 (11.6) | 64 (16.2) | 0.005 |
| Self‐reported cancer, n (%) | 15636 (10.5) | 81 (20.6) | <0.0001 |
| Self‐reported diabetes, n (%) | 6017 (4.0) | 15 (3.8) | 0.81 |
Values are arithmetic mean ± SD, geometric mean (5th to 95th percentile interval), or number of subjects (%). aSMM: appendicular skeletal muscle mass; BMD, bone mineral density; BMI: body mass index; HRT, hormone‐replacement therapy; MET, metabolic equivalent of task; SD, standard deviation; SMM: skeletal muscle mass.
Table 2.
Comparison of muscle mass measures based on muscle mass at baseline in postmenopausal women with and without osteoporosis
| Without osteoporosis (n = 148772) | Osteoporosis (n = 394) | P | |
|---|---|---|---|
| Muscle mass measures | |||
| SMM/ht2 (kg/m2) | 6.51 ± 0.71 | 6.19 ± 0.71 | <0.0001 |
| aSMM/ht2 (kg/m2) | 4.89 ± 0.53 | 4.66 ± 0.53 | <0.0001 |
| Residual | −0.018 ± 0.76 | −0.254 ± 0.75 | <0.0001 |
| SMM (kg) | 17.1 ± 2.64 | 16.0 ± 2.20 | <0.0001 |
| aSMM/bm × 100 (%) | 24.5 ± 3.35 | 25.0 ± 3.14 | 0.003 |
| aSMM/BMI (m2) | 0.48 ± 0.08 | 0.49 ± 0.08 | 0.59 |
aSMM/ht2, appendicular skeletal muscle mass divided by height squared; bm, body mass; BMI, body mass index; SMM/ht2, skeletal muscle mass divided by height squared. Residual is the appendicular skeletal muscle mass adjusted for height and fat mass using multiple regression analysis.
Risk prediction by muscle mass measures
Median follow‐up was 6.75 (5th to 95th percentile interval, 1.53 to 8.37) years. There were 394 newly diagnosed cases of diagnosed osteoporosis that included 40 (10.2%) cases associated with a pathological fracture.
As aSMM was calculated from SMM, only SMM/ht2 is reported in the subsequent results. The unadjusted rates for osteoporosis (Figure 1; Table S1) increased with decreasing quintiles of SMM/ht2 and SMM (both P < 0.0001), while SMM/bm × 100 increased with increasing quintiles (P = 0.001). No relationship existed for SSM/BMI (P = 0.45). The rate of osteoporosis for the residual measure of sarcopenia also increased with decreasing quintiles (P < 0.0001). After minimally adjusting for age, the predictive value of the muscle mass measures in the total group, and separately in lean participants and those with increased adiposity (Figure 2, Table S2), the sarcopenia measure including SMM and height (SMM/ht2) or SMM alone, was consistently predictive of osteoporosis (P ≤ 0.01) in the total group and in participants with a BMI above and below 25 kg/m2, waist circumference above and below 88 cm, and body fat percentage above and below 35%. The residuals were not predictive in participants with increased adiposity as presented by BMI (P ≤ 0.11) and waist circumference (P = 0.076), while SMM/bm × 100 and aSMM/BMI showed mixed results. In fully adjusted models (Table 3), these results remained unchanged after accounting for age, ethnicity, self‐reported smoking and alcohol use, physical activity, use of HRT, and self‐reported diagnosed cancer and diabetes as covariates. In addition, these results remained unchanged even after excluding 40 participants diagnosed with osteoporosis associated with a pathological fracture (Table 3).
Figure 1.

Rates of newly diagnosed osteoporosis by quintiles of muscle mass measures in 149 116 postmenopausal women. aSMM/ht2, appendicular skeletal muscle mass divided by height squared; bm, body mass; BMI, body mass index; SMM/ht2, skeletal muscle mass divided by height squared. Residual is the appendicular skeletal muscle mass adjusted for height and fat mass using multiple regression analysis. ^, similar to aSMM/ht2.
Figure 2.
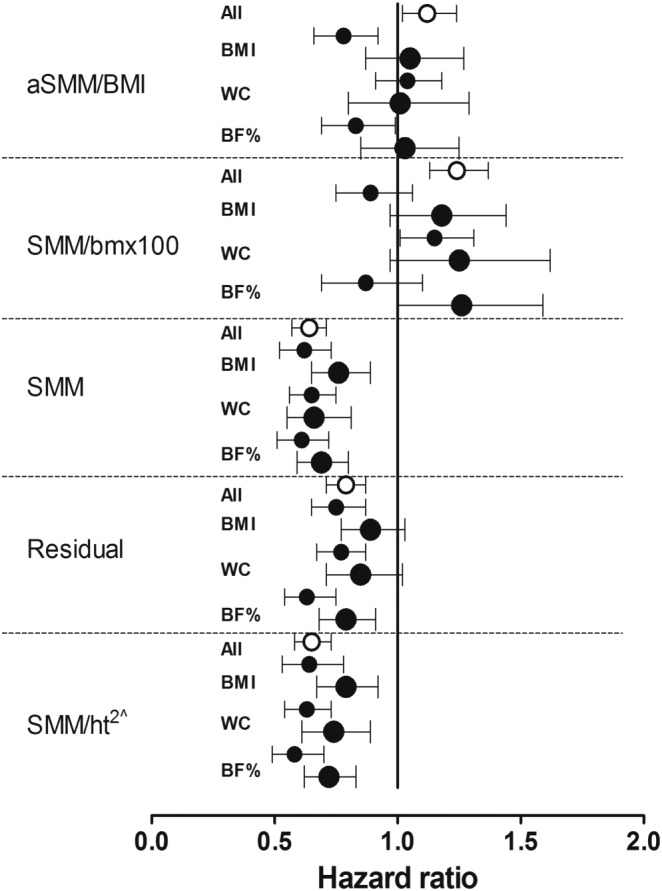
Standardised hazard ratios for osteoporosis adjusted for age in relation to the different muscle mass measures in the total group, in those with a body mass index (BMI) above and below 25 kg/m2, above and below a waist circumference (WC) of 88 cm, and a body fat percentage (%) above and below 35%. Hazard ratios given with 95% confidence intervals express the risk associated with a 1‐SD increase in the explanatory variables. aSMM/ht2, appendicular skeletal muscle mass divided by height squared; bm, body mass; SMM/ht2, skeletal muscle mass divided by height squared. Residual is the appendicular skeletal muscle mass adjusted for height and fat mass using multiple regression analysis. Open and filled circles represent the total and lean groups, respectively, while the larger filled circles represent those with increased adiposity. ^, similar to aSMM/ht2.
Table 3.
Adjusted standardized hazard ratios for osteoporosis in relation to measures for sarcopenia in lean and in participants with increased adiposity
| Anthropometric measures | Muscle mass measures | ||||
|---|---|---|---|---|---|
| SMM/ht2 (kg/m2)a | Residual | SMM (kg) | SMM/bm × 100 (%) | aSMM/BMI (m2) | |
| Hazard ratios (95% CI) | |||||
| Total group | 0.67 (0.59–0.75)**** | 0.81 (0.72–0.90)*** | 0.65 (0.58–0.73)**** | 1.25 (1.12–1.39)**** | 1.13 (1.01–1.25)* |
| BMI <25 kg/m2 | 0.68 (0.56–0.83)*** | 0.79 (0.67–0.92)** | 0.64 (0.54–0.77)**** | 0.91 (0.76–1.10) | 0.79 (0.67–0.94)** |
| BMI ≥25 kg/m2 | 0.78 (0.66–0.93)** | 0.89 (0.76–1.04) | 0.77 (0.65–0.91)** | 1.19 (0.96–1.48) | 1.07 (0.87–1.31) |
| WC <88 cm | 0.66 (0.57–0.78)**** | 0.81 (0.70–0.92)** | 0.67 (0.58–0.78)**** | 1.18 (1.02–1.36)* | 1.05 (0.92–1.20) |
| WC ≥88 cm | 0.71 (0.57–0.87)*** | 0.83 (0.68–0.99)* | 0.64 (0.52–0.80)**** | 1.25 (0.94–1.65) | 1.02 (0.79–1.31) |
| Body fat <35% | 0.62 (0.52–0.76)**** | 0.68 (0.57–0.81)**** | 0.63 (0.53–0.76)**** | 0.92 (0.72–1.17) | 0.84 (0.69–1.02) |
| Body fat ≥35% | 0.71 (0.61–0.83)**** | 0.78 (0.67–0.92)** | 0.69 (0.59–0.80)**** | 1.25 (0.97–1.61) | 1.02 (0.83–1.25) |
| After excluding 44 participants diagnosed with osteoporosis associated with a pathological fracture | |||||
| Total group | 0.54 (0.45–0.65)**** | 0.74 (0.64–0.87)*** | 0.82 (0.77–0.87)**** | 1.08 (1.04–1.12)**** | 1.17 (1.04–1.30)** |
| BMI <25 kg/m2 | 0.57 (0.43–0.77)*** | 0.72 (0.58–0.90)** | 0.81 (0.75–0.89)**** | 0.97 (0.92–1.03) | 0.79 (0.66–0.95)* |
| BMI ≥25 kg/m2 | 0.70 (0.54–0.92)** | 0.86 (0.69–1.08) | 0.89 (0.82–0.97)** | 1.07 (0.99–1.15) | 1.13 (0.91–1.42) |
| WC <88 cm | 0.54 (0.43–0.69)**** | 0.74 (0.61–0.90)** | 0.84 (0.78–0.90)**** | 1.06 (1.01–1.10)* | 1.08 (0.94–1.25) |
| WC ≥88 cm | 0.61 (0.45–0.84)** | 0.78 (0.59–1.03) | 0.82 (0.74–0.91)*** | 1.08 (0.99–1.18) | 1.04 (0.79–1.37) |
| Body fat <35% | 0.51 (0.39–0.68)**** | 0.59 (0.46–0.76)**** | 0.82 (0.75–0.89)**** | 0.97 (0.90–1.05) | 0.85 (0.69–1.03) |
| Body fat ≥35% | 0.59 (0.46–0.75)**** | 0.69 (0.56–0.87)** | 0.83 (0.77–0.90)**** | 1.08 (0.99–1.17) | 1.04 (0.83–1.30) |
The Cox models accounted for baseline age, ethnicity, self‐reported smoking and alcohol use, physical activity, use of hormone replacement therapy, and self‐reported diagnosed cancer and diabetes as covariates. Hazard ratios given with 95% confidence intervals (CI) express the risk associated with a 1‐SD increase in the muscle mass measures. Residual is the appendicular skeletal muscle mass adjusted for height and fat mass using multiple regression analysis. aSMM/ht2, appendicular skeletal muscle mass divided by height squared; bm, body mass; BMI, body mass index; SMM/ht2, skeletal muscle mass divided by height squared; WC, waist circumference. Significance of the hazard ratios:
Similar to aSMM/ht2.
P ≤ 0.05;
P ≤ 0.01;
P ≤ 0.001; and
P ≤ 0.0001.
Lastly, by adding each measure of muscle mass to the respective models already containing the previously mentioned covariates, the changes in the R 2 statistic were 13.4%, 11.6%, and 15.3% for SMM/ht2, residual, and SMM, but only 4.9% and 1.3% for SMM/bm × 100 and aSMM/BMI.
Discussion
Our prospective study in postmenopausal women showed that SMM and aSMM adjusted for height squared and SMM alone were better and more consistent muscle‐relevant risk factors for osteoporosis compared with measures adjusted for fat mass, body mass, or BMI. This was evident in both lean women and women with increased adiposity. These results remained significant following adjustments for covariables and potential confounders. Taken together, our findings suggest that SMM/ht2 and/or aSMM/ht2 can be universally used as measures of muscle mass when identifying postmenopausal women with increased osteoporotic risk, while measures including body mass or fat appear to be less consistent.
In our analysis in the total group, although all muscle mass measures were predictive of incident osteoporosis, SMM/ht2 and SMM explained 13.4% and 15.3% of the variability in the incident osteoporosis, whereas the SMM/bm × 100 and aSMM/BMI explained only 4.9% and 1.3%, respectively. Several, although not all,14, 18 studies have demonstrated a positive association between height‐adjusted appendicular lean body mass (assessed by DXA) and BMD or osteoporosis in postmenopausal women or in a mixed population of men and women.15, 16, 17 Other muscle mass measures utilized in current sarcopenia definitions are poorly characterized in relation to incident osteoporosis thus far, with our present longitudinal data extending the literature in this area and suggesting that SMM adjusted for fat mass, body mass, or BMI are less closely associated with this bone health‐related outcome.
These results were confirmed in subgroup analyses, in which the postmenopausal women were stratified into lean and those with increased adiposity. SMM/ht2, aSMM/ht2, and SMM alone were consistently predictive of incident osteoporosis, while the prognostic significance of the residuals were less consistent across subgroups and mostly absent for SMM/bm × 100 and aSMM/BMI. Previous studies have explored the combined effects of increased adiposity and muscle mass or strength on osteoporosis.29, 30, 31, 32 By identifying sarcopenic individuals as those fulfilling at least two of the following three criteria with specific cut‐offs, that is, low aLM/ht2, gait velocity, and grip strength, Huo et al.29 demonstrated in 680 elderly men and women (mean age: 79 ± 9 years, 65% female) that sarcopenic obesity was significantly associated with a lower hip BMD compared with non‐sarcopenic obesity (T‐score −1.39 ± 1.24 vs. −0.79 ± 1.33; P < 0.01). Similarly, osteoporosis has been reported to be more prevalent in sarcopenic and sarcopenic obese women compared with non‐sarcopenic, non‐obese women.31, 32 Conversely, after 5 years of follow‐up, Scott et al. reported no difference in total hip BMD when they compared sarcopenic obese with non‐sarcopenic, non‐obese men.30 These results were indifferent when two sarcopenia definitions were tested based on aLM/BMI and grip strength or aLM/ht2 and grip strength and/or gait speed.
The limited performance of the SMM measures adjusted for fat mass, body mass, or BMI on incident osteoporosis in the sub‐analyses of the current study may reflect an equally important role of lean mass and fat mass on bone health of postmenopausal women, which may have synergistic or opposing effects on BMD.15, 16, 18, 33, 34 Indeed, both muscle mass and fat mass impose mechanical loading in the weight‐bearing skeletal sites.35 Additional non‐mechanical benefits of muscle mass on bone may be because muscle and bone share genetic, endocrine, and lifestyle determinants.36 The effects of fat mass on bone formation and resorption are mechanistically mediated by bone active hormones, which originate from pancreatic β cell (i.e. insulin, amylin) or adipocytes (i.e. oestrogens, leptin, and adiponectin), with these effects reported to be positive or negative.37 Furthermore, increased fat mass commonly results in increased levels of pro‐inflammatory cytokines (interleukin‐6, tumour necrosis factor‐alpha), which promote bone resorption and subsequent bone loss.37
We showed between 22% and 29% lower risk for incident osteoporosis for each SD increase in SSM/ht2 (and aSMM/ht2) among postmenopausal women with increased adiposity when classification into subgroups was based on BMI, and WC or total body fat percentage. These associations appeared to be less prominent when BMI was utilized to stratify the women into lean and those with increased adiposity, compared with waist circumference and body fat percentage. These findings support previous suggestions that body fat percentage and waist circumference may be more appropriate than BMI, when assessing sarcopenic obesity in relation to health outcomes,38, 39 given that the latter fails to unravel the amount and distribution of fat and muscle mass.40 This is critical for ageing individuals who may experience an increase in fat mass and ectopic fat deposition in muscle and bone,38 therefore making it difficult to accurately determine the status of the SMM of a person. Indeed, in the present study, muscle mass measures that involved fat resulted in mixed results as both parts of the measure can vary as a ratio (e.g. aSMM and BMI). Conversely, when utilizing SMM/ht2 or aSMM/ht2, the focus is placed upon muscle mass as height is constant. Similar associations were observed for SMM alone.
Strengths of our study include the prospective design, the large sample size, and the wide age range of postmenopausal women (40–70 years) from the general population. We chose not to utilize available cut‐offs, but to test these muscle mass measures as continuous variables, overcoming the inherent limitation of the cut‐off approach, which is generally not recommended for continuously distributed variables.41 Furthermore, available cut‐offs for muscle mass measures have been established in reference populations with different baseline characteristics (i.e. age, ethnicity, and disease status) from those characteristics of our cohort or by using DXA to determine body composition. The limitations of the study should also be acknowledged. We used BIA to assess body composition, which may be less accurate than imaging techniques such as DXA, magnetic resonance imaging, and computed tomography.42 BIA is, however, an established option for detecting sarcopenia by the European Working Group on Sarcopenia in Older People3 and the Asian Working Group on Sarcopenia43; it is inexpensive and it can be easily included in geriatric assessments. Estimations of SMM and aSMM were based on equations; therefore, some degree of over or underestimation is possible, albeit constant. Importantly, SMM and aSMM represent SMM only, whereas BIA output variables of fat‐free mass additionally include masses of the liver, kidneys, heart, bone, and connective tissue44 and, therefore, have been suggested to the relationship between muscle mass and BMD.45 In this study, the focus was placed upon muscle mass measures, rather than measures of muscle strength or performance, which require exploration in follow‐up studies. Lastly, our findings were in community‐based postmenopausal women only and cannot necessarily apply to postmenopausal women in nursing homes, those with advanced illness or men.
Conclusions
In summary, our comparative approach of published muscle mass measures used in available sarcopenia definitions suggest that more ‘pure’ measures of skeletal muscle (SMM/ht2, aSMM/ht2, and SMM alone) may be better muscle‐relevant risk factors for osteoporosis as opposed to measures including fat mass, body mass, and BMI, irrespective of the level of adiposity, at least in postmenopausal women. These findings have implications for the detection of sarcopenia and sarcopenic obesity in this clinically relevant population at high risk of musculoskeletal diseases. Future studies are required to investigate the association between muscle mass measures and bone health in elderly men with varying degrees of adiposity.
Conflicts of interest
All authors have no conflicts of interest to declare.
Supporting information
Table S1. Rates of newly diagnosed osteoporosis by quintiles of muscle mass measures in 149116 postmenopausal women.
Table S2. Standardized hazard ratios for osteoporosis adjusted for age in relation to muscle mass measures in lean participants and those with increased adiposity.
Acknowledgements
All authors certify that they comply with the ethical guidelines for publishing in the Journal of Cachexia, Sarcopenia, and Muscle: update 2017.46 This research has been conducted using the UK Biobank Resource under Application Number 23183.
Papageorgiou, M. , Sathyapalan, T. , and Schutte, R. (2019) Muscle mass measures and incident osteoporosis in a large cohort of postmenopausal women. Journal of Cachexia, Sarcopenia and Muscle, 10: 131–139. 10.1002/jcsm.12359.
Contributor Information
Maria Papageorgiou, Email: m.papageorgiou@hull.ac.uk.
Rudolph Schutte, Email: rudolph.schutte@anglia.ac.uk.
References
- 1. Ley CJ, Lees B, Stevenson JC. Sex‐ and menopause‐associated changes in body‐fat distribution. Am J Clin Nutr 1992;55:950–954. [DOI] [PubMed] [Google Scholar]
- 2. Kanis JA, McCloskey EV, Johansson H, Cooper C, Rizzoli R, Reginster JY, et al. European guidance for the diagnosis and management of osteoporosis in postmenopausal women. Osteoporos Int 2013;24:23–57. [DOI] [PMC free article] [PubMed] [Google Scholar]
- 3. Cruz‐Jentoft AJ, Landi F, Schneider SM, Zúñiga C, Arai H, Boirie Y, et al. Prevalence of and interventions for sarcopenia in ageing adults: a systematic review. Report of the International Sarcopenia Initiative (EWGSOP and IWGS). Age Ageing 2014;43:748–759. [DOI] [PMC free article] [PubMed] [Google Scholar]
- 4. Curtis EM, Moon RJ, Harvey NC, Cooper C. The impact of fragility fracture and approaches to osteoporosis risk assessment worldwide. Bone 2017;104:29–38. [DOI] [PMC free article] [PubMed] [Google Scholar]
- 5. Eastell R, O'Neill TW, Hofbauer LC, Langdahl B, Reid IR, Gold DT, et al. Postmenopausal osteoporosis. Nat Rev Dis Primers 2016;2:16069. [DOI] [PubMed] [Google Scholar]
- 6. Dupuy C, Lauwers‐Cances V, Guyonnet S, Gentil C, Abellan Van Kan G, Beauchet O, et al. Searching for a relevant definition of sarcopenia: results from the cross‐sectional EPIDOS study. J Cachexia Sarcopenia Muscle 2015;6:144–154. [DOI] [PMC free article] [PubMed] [Google Scholar]
- 7. Baumgartner RN, Koehler KM, Gallagher D, Romero L, Heymsfield SB, Ross RR, et al. Epidemiology of sarcopenia among the elderly in New Mexico. Am J Epidemiol 1998;147:755–763. [DOI] [PubMed] [Google Scholar]
- 8. Delmonico MJ, Harris TB, Lee JS, Visser M, Nevitt M, Kritchevsky SB, et al. Alternative definitions of sarcopenia, lower extremity performance, and functional impairment with aging in older men and women. J Am Geriatr Soc 2007;55:769–774. [DOI] [PubMed] [Google Scholar]
- 9. Delmonico MJ, Harris TB, Visser M, Park SW, Conroy MB, Velasquez‐Mieyer P, et al. Longitudinal study of muscle strength, quality, and adipose tissue infiltration. Am J Clin Nutr 2009;90:1579–1585. [DOI] [PMC free article] [PubMed] [Google Scholar]
- 10. Cruz‐Jentoft AJ, Baeyens JP, Bauer JM, Boirie Y, Cederholm T, Landi F, et al. Sarcopenia: European consensus on definition and diagnosis: Report of the European Working Group on Sarcopenia in Older People. Age Ageing 2010;39:412–423. [DOI] [PMC free article] [PubMed] [Google Scholar]
- 11. Fielding RA, Vellas B, Evans WJ, Bhasin S, Morley JE, Newman AB, et al. Sarcopenia: an undiagnosed condition in older adults. Current consensus definition: prevalence, etiology, and consequences. International working group on sarcopenia. J Am Med Dir Assoc 2011;12:249–256. [DOI] [PMC free article] [PubMed] [Google Scholar]
- 12. Muscaritoli M, Anker SD, Argilés J, Aversa Z, Bauer JM, Biolo G, et al. Consensus definition of sarcopenia, cachexia and pre‐cachexia: joint document elaborated by Special Interest Groups (SIG) ‘cachexia‐anorexia in chronic wasting diseases’ and ‘nutrition in geriatrics’. Clin Nutr Clin Nutr 2010;29:154–159. [DOI] [PubMed] [Google Scholar]
- 13. Studenski SA, Peters KW, Alley DE, Cawthon PM, McLean RR, Harris TB, et al. The FNIH sarcopenia project: rationale, study description, conference recommendations, and final estimates. J Gerontol A Biol Sci Med Sci 2014;69:547–558. [DOI] [PMC free article] [PubMed] [Google Scholar]
- 14. Walsh MC, Hunter GR, Livingstone MB. Sarcopenia in premenopausal and postmenopausal women with osteopenia, osteoporosis and normal bone mineral density. Osteoporos Int 2006;17:61–67. [DOI] [PubMed] [Google Scholar]
- 15. Sherk VD, Palmer IJ, Bemben MG, Bemben DA. Relationships between body composition, muscular strength, and bone mineral density in estrogen‐deficient postmenopausal women. J Clin Densitom 2009;12:292–298. [DOI] [PubMed] [Google Scholar]
- 16. He H, Liu Y, Tian Q, Papasian CJ, Hu T, Deng HW. Relationship of sarcopenia and body composition with osteoporosis. Osteoporos Int 2016;27:473–482. [DOI] [PubMed] [Google Scholar]
- 17. Sjoblom S, Suuronen J, Rikkonen T, Honkanen R, Kroger H, Sirola J. Relationship between postmenopausal osteoporosis and the components of clinical sarcopenia. Maturitas 2013;75:175–180. [DOI] [PubMed] [Google Scholar]
- 18. Gillette‐Guyonnet S, Nourhashemi F, Lauque S, Grandjean H, Vellas B. Body composition and osteoporosis in elderly women. Gerontology 2000;46:189–193. [DOI] [PubMed] [Google Scholar]
- 19. Sudlow C, Gallacher J, Allen N, Beral V, Burton P, Danesh J, et al. UK biobank: an open access resource for identifying the causes of a wide range of complex diseases of middle and old age. PLoS Med 2015;12:e1001779. [DOI] [PMC free article] [PubMed] [Google Scholar]
- 20. Townsend P. Deprivation. Deprivation J Soc Policy 1987;16:125–146. [Google Scholar]
- 21. Craig CL, Marshall AL, Sjöström M, Bauman AE, Booth ML, Ainsworth BE, et al. International physical activity questionnaire: 12‐country reliability and validity. Med Sci Sports Exerc 2003;35:1381–1395. [DOI] [PubMed] [Google Scholar]
- 22. Janssen I, Heymsfield SB, Baumgartner RN, Ross R. Estimation of skeletal muscle mass by bioelectrical impedance analysis. J Appl Physiol (1985) 2000;89:465–471. [DOI] [PubMed] [Google Scholar]
- 23. Wang ZM, Visser M, Ma R, Baumgartner RN, Kotler D, Gallagher D, et al. Skeletal muscle mass: evaluation of neutron activation and dual‐energy X‐ray absorptiometry methods. J Appl Physiol (1985) 1996;80:824–831. [DOI] [PubMed] [Google Scholar]
- 24. Newman AB, Kupelian V, Visser M, Simonsick E, Goodpaster B, Nevitt M, et al. Sarcopenia: alternative definitions and associations with lower extremity function. J Am Geriatr Soc 2003;51:1602–1609. [DOI] [PubMed] [Google Scholar]
- 25. Janssen I, Heymsfield SB, Ross R. Low relative skeletal muscle mass (sarcopenia) in older persons is associated with functional impairment and physical disability. J Am Geriatr Soc 2002;50:889–896. [DOI] [PubMed] [Google Scholar]
- 26. Romero‐Corral A, Somers VK, Sierra‐Johnson J, Thomas RJ, Collazo‐Clavell ML, Korinek J, et al. Accuracy of body mass index in diagnosing obesity in the adult general population. Int J Obes (Lond) 2008;32:959–966. [DOI] [PMC free article] [PubMed] [Google Scholar]
- 27. World health Organisation Organization (WHO) . Physical status: the use and interperation of anthropometry. Report of a WHO Expert Committee. World Health Organ Tech Rep Ser 1995;854:1–452. [PubMed] [Google Scholar]
- 28. Use of generalized R‐squared in Cox regression. 2006. (Accessed August 15, 2017, at http://apha.confex.com/apha/134am/techprogram/paper_135906.html).
- 29. Huo YR, Suriyaarachchi P, Gomez F, Curcio CL, Boersma D, Gunawardene P, et al. Phenotype of sarcopenic obesity in older individuals with a history of falling. Arch Gerontol Geriatr 2016;65:255–259. [DOI] [PubMed] [Google Scholar]
- 30. Scott D, Seibel M, Cumming R, Naganathan V, Blyth F, Le Couteur DG, et al. Sarcopenic obesity and its temporal associations with changes in bone mineral density, incident falls, and fractures in older men: the concord health and ageing in men project. J Bone Miner Res 2017;32:575–583. [DOI] [PubMed] [Google Scholar]
- 31. Waters DL, Hale L, Grant AM, Herbison P, Goulding A. Osteoporosis and gait and balance disturbances in older sarcopenic obese New Zealanders. Osteoporos Int 2010;21:351–357. [DOI] [PubMed] [Google Scholar]
- 32. Chung JH, Hwang HJ, Shin HY, Han CH. Association between sarcopenic obesity and bone mineral density in middle‐aged and elderly Korean. Ann Nutr Metab 2016;68:77–84. [DOI] [PubMed] [Google Scholar]
- 33. Ho‐Pham LT, Nguyen UD, Nguyen TV. Association between lean mass, fat mass, and bone mineral density: a meta‐analysis. J Clin Endocrinol Metab 2014;99:30–38. [DOI] [PubMed] [Google Scholar]
- 34. Dolan E, Swinton PA, Sale C, Healy A, O'Reilly J. Influence of adipose tissue mass on bone mass in an overweight or obese population: systematic review and meta‐analysis. Nutr Rev 2017;75:858–870. [DOI] [PubMed] [Google Scholar]
- 35. Wang MC, Bachrach LK, Van Loan M, Hudes M, Flegal KM, Crawford PB. The relative contributions of lean tissue mass and fat mass to bone density in young women. Bone 2005;37:474–481. [DOI] [PubMed] [Google Scholar]
- 36. Tagliaferri C, Wittrant Y, Davicco MJ, Walrand S, Coxam V. Muscle and bone, two interconnected tissues. Ageing Res Rev 2015;21:55–70. [DOI] [PubMed] [Google Scholar]
- 37. Reid IR. Relationships between fat and bone. Osteoporos Int 2008;19:595–606. [DOI] [PubMed] [Google Scholar]
- 38. Zamboni M, Mazzali G, Fantin F, Rossi A, Di Francesco V. Sarcopenic obesity: a new category of obesity in the elderly. Nutr Metab Cardiovasc Dis 2008;18:388–395. [DOI] [PubMed] [Google Scholar]
- 39. Ilich JZ, Kelly OJ, Inglis JE, Panton LB, Duque G, Ormsbee MJ. Interrelationship among muscle, fat, and bone: connecting the dots on cellular, hormonal, and whole body levels. Ageing Res Rev 2014;15:51–60. [DOI] [PubMed] [Google Scholar]
- 40. Romero‐Corral A, Lopez‐Jimenez F, Sierra‐Johnson J, Somers VK. Differentiating between body fat and lean mass‐how should we measure obesity? Nat Clin Pract Endocrinol Metab 2008;4:322–323. [DOI] [PubMed] [Google Scholar]
- 41. Naggara O, Raymond J, Guilbert F, Roy D, Weill A, Altman DG. Analysis by categorizing or dichotomizing continuous variables is inadvisable: an example from the natural history of unruptured aneurysms. Am J Neuroradiol 2011;32:437–440. [DOI] [PMC free article] [PubMed] [Google Scholar]
- 42. Gonzalez MC, Heymsfield SB. Bioelectrical impedance analysis for diagnosing sarcopenia and cachexia: what are we really estimating? J Cachexia Sarcopenia Muscle 2017;8:187–189. [DOI] [PMC free article] [PubMed] [Google Scholar]
- 43. Chen LK, Liu LK, Woo J, Assantachai P, Auyeung TW, Bahyah KS, et al. Sarcopenia in Asia: consensus report of the Asian Working Group for Sarcopenia. J Am Med Dir Assoc 2014;15:95–101. [DOI] [PubMed] [Google Scholar]
- 44. Muller MJ, Geisler C, Pourhassan M, Gluer CC, Bosy‐Westphal A. Assessment and definition of lean body mass deficiency in the elderly. Eur J Clin Nutr 2014;68:1220–1227. [DOI] [PubMed] [Google Scholar]
- 45. Baumgartner RN, Stauber PM, Koehler KM, Romero L, Garry PJ. Associations of fat and muscle masses with bone mineral in elderly men and women. Am J Clin Nutr 1996;63:365–672. [DOI] [PubMed] [Google Scholar]
- 46. von Haehling S, Morley JE, Coats AJS, Anker SD. Ethical guidelines for publishing in the journal of cachexia, sarcopenia and muscle: update 2017. J Cachexia Sarcopenia Muscle 2017;8:1081–1083. [DOI] [PMC free article] [PubMed] [Google Scholar]
Associated Data
This section collects any data citations, data availability statements, or supplementary materials included in this article.
Supplementary Materials
Table S1. Rates of newly diagnosed osteoporosis by quintiles of muscle mass measures in 149116 postmenopausal women.
Table S2. Standardized hazard ratios for osteoporosis adjusted for age in relation to muscle mass measures in lean participants and those with increased adiposity.