Abstract
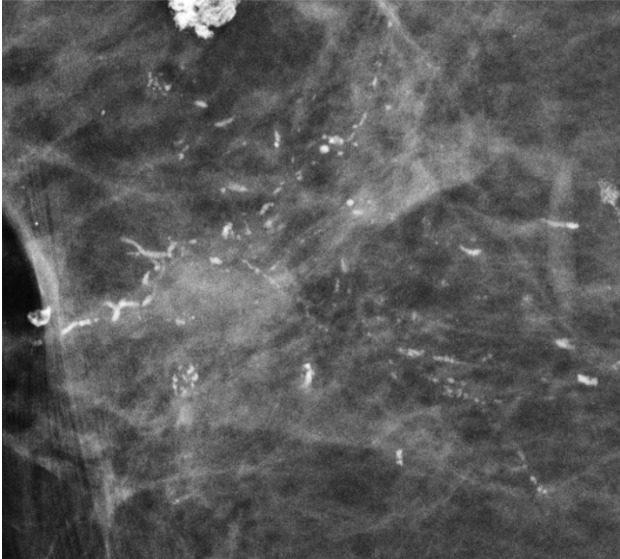
Full-field digital mammography (FFDM), the standard of care for breast cancer screening, has some limitations. With the advent of digital breast tomosynthesis (DBT), improvements including decreased recall rates and increased cancer detection rates have been observed. The quasi–three-dimensional capability of DBT reduces breast tissue overlap, a significant limitation of FFDM. However, early studies demonstrate that a few cancers detected at FFDM may not be diagnosed at DBT-only screening, and lesions with calcifications as the dominant feature may look less suspicious at DBT or not be visible at all. These findings support the use of combined FFDM and DBT protocols to optimize screening performance. However, this combination would approximately double the patient’s radiation exposure. The development of computer algorithms that generate two-dimensional synthesized mammography (SM) views from DBT has improved calcification conspicuity and sensitivity. Therefore, SM may substitute for FFDM in screening protocols, reducing radiation exposure. DBT plus SM demonstrates significantly better performance than that of FFDM alone, although there are reports of missed malignant calcifications. Thus, some centers continue to perform FFDM with DBT. Use of DBT in breast imaging has also necessitated the development of DBT-guided biopsy. DBT-guided biopsy may have a higher success rate than that of stereotactic biopsy, with a shorter procedure time. While DBT brings substantial improvements to breast cancer imaging, it is important to be aware of its strengths and limitations regarding detection of calcifications. This article reviews the imaging appearance of breast calcifications at DBT, discusses calcification biopsy techniques, and provides an overview of the current literature.
Online supplemental material is available for this article.
©RSNA, 2019
An earlier incorrect version of this article appeared online. This article was corrected on February 13, 2019.
SA-CME LEARNING OBJECTIVES
After completing this journal-based SA-CME activity, participants will be able to:
■ Describe the differences among FFDM, DBT, and SM for evaluation of calcifications.
■ Recognize the imaging appearances of benign and suspicious calcifications at FFDM and DBT.
■ List the advances made in breast cancer diagnosis by the use of DBT-guided biopsy.
Introduction
Screening mammography reduces breast cancer mortality by up to 30% through the early detection of breast cancer (1). Morbidity caused by disease and treatment is also reduced with early diagnosis (2). Compared with screen-film mammography, full-field digital mammography (FFDM) enables digital archiving and radiation-dose optimization with similar cancer detection rates and has demonstrated greater diagnostic accuracy in women under 50 years of age, women with dense breasts, and women who are premenopausal or perimenopausal (3–6). Thus, until recently, FFDM was considered the standard imaging modality for breast cancer screening. The challenge of FFDM is that its accuracy may be limited owing to breast tissue overlap, especially in patients with dense glandular parenchyma, which may lead to delayed cancer diagnosis (7).
Digital breast tomosynthesis (DBT) is a novel technique currently used in many breast imaging services around the world. DBT represents an improvement to FFDM and has the capability of reducing overlap of normal breast parenchyma and improving lesion conspicuity by acquiring images over multiple projections at different angles (8). Therefore, DBT may depict additional cancers that would otherwise be occult at conventional screening (9).
Nevertheless, there are some limitations to DBT that may impair visualization of a few cancers (10). Lesions that have calcifications as the dominant feature may occasionally not be seen at DBT, while some may appear more or less suspicious than they would at FFDM (11). These findings raise concerns about using DBT as a substitute for FFDM in breast cancer screening. Recent advances in technology have improved the visualization of calcifications at DBT and reduced the chance of missing malignant calcifications at screening (9–12).
In this article, we review (a) techniques for performing DBT, (b) the role of DBT in breast cancer screening, (c) the relationship between breast calcifications and cancer, (d) types of breast calcifications, (e) clinical performance of DBT in the detection of malignant calcifications, and (f) DBT-guided biopsy procedures.
DBT and Synthesized Mammography
DBT uses a quasi–three-dimensional (3D) technique. Central to the technique is the creation of multiple angled projections of the breast by an x-ray tube moving in an arc. The projection views render structures within the focal plane to be in focus while blurring structures deeper or superficial relative to that focal position (9). A sequence of images with varying focuses creates a computational simulated 3D study that can provide greater lesion conspicuity and enable radiologists to scroll through the breast parenchyma (13).
DBT protocols currently involve radiation doses comparable to or greater than those used at FFDM (14). The range of the breast radiation dose at DBT may be slightly lower than to more than double that used at FFDM and is dependent on the equipment used, imaging protocol, and breast thickness (8). Furthermore, the U.S. Food and Drug Administration approved the use of DBT equipment for screening only in combination with two-dimensional (2D) mammography (FFDM or synthesized) (15,16). DBT plus FFDM may more than double the amount of radiation per examination compared with that of FFDM-only screening (17).
Synthesized mammography (SM) may serve as a substitute for FFDM in screening protocols (18). Synthesized mammograms are created from DBT projections. First, portions of the DBT image acquisition are selected and combined. Second, computational algorithms generate a 2D image that simulates an FFDM view (10). A reduction of approximately 40%–50% in radiation dose is observed with DBT plus SM compared with that of the DBT plus FFDM screening protocol (12,17). Examination time is also reduced at DBT plus SM, as the FFDM acquisition time is no longer necessary (10).
DBT for Screening
Initial studies demonstrate that a number of lesions could be better depicted at DBT than at FFDM. The use of DBT for breast cancer screening improves the sensitivity and specificity of mammography, mainly owing to the improved evaluation of masses, asymmetries, and architectural distortions compared to those seen at FFDM (9,19). More recent studies show that the main diagnostic contribution of DBT relies on the detection of small spiculated masses and architectural distortions, although some additional false-positive lesions may also be detected (13,20–22). In regard to the detection of malignant calcifications, however, a significant improvement has not been observed (23,24). On the other hand, some malignant calcifications may not be detected at FFDM but are visible on DBT images (25,26).
Screening Protocols
After the advent of DBT, a number of screening protocols were proposed. Initial studies compared traditional FFDM screening alone with single- or two-view DBT plus FFDM or with DBT alone (24,26–29). The best performance was achieved with two-view DBT plus FFDM, despite the higher radiation dose than that of DBT alone (28,29).
With the development of SM, later studies evaluated the accuracy of using DBT plus SM in substitution for FFDM alone or DBT plus FFDM protocols. While there are some conflicting results, most studies demonstrate that DBT plus SM has a higher sensitivity compared with that of FFDM alone and similar or higher accuracy compared with DBT plus FFDM for the detection of breast cancer (12,17,30).
Diagnostic Performance of DBT in the Detection of Breast Cancer
The combined use of DBT and FFDM increases the sensitivity and specificity of breast cancer screening (24–26,31,32). In the Oslo Tomosynthesis Screening Trial, a significant increase in specificity (97.5% vs 96.4%, P < .001) and the number of cancers detected per 1000 women (9.3 vs 6.3, P < .001) was observed with DBT plus FFDM when compared with FFDM alone (31). A nonsignificant increase in sensitivity with the addition of DBT was also observed (80.8% vs 76.2%, P = .151).
In the TOMMY trial (A Comparison of Tomosynthesis with Digital Mammography in the UK National Health Service Breast Screening Program), an increase in sensitivity did not reach statistical significance (89% vs 87%, P = .06), while a significant increase in specificity (69% vs 58%, P <. 001) was observed for DBT plus FFDM when compared with FFDM alone (24). This increase was greater for masses, architectural distortions, and asymmetries than for microcalcifications. Lastly, the STORM (Screening with Tomosynthesis or Standard Mammography) trial evaluated 7292 screening studies with DBT plus FFDM and FFDM alone, and 59 cancers were diagnosed (25,26). In this dataset, there were 20 (34%) cancers detected only at DBT, including three cases of malignant calcifications.
Improved screening performance was also observed in studies evaluating SM as a substitute for FFDM. In the STORM-2 trial, 90 cancers were detected at screening in 9672 patients (30). The cancer detection rate was significantly higher for DBT plus SM (8.8 per 1000 screenings) and for DBT plus FFDM (8.5 per 1000 screenings) compared with that of FFDM alone (6.3 per 1000 screenings, P <.0001 for both comparisons).
In a large screening study with 16 666 patients by Caumo et al (17), a significant increase in cancer detection rates was found: 9.3 per 1000 with DBT plus SM, compared with 5.4 per 1000 with FFDM alone (P < .0001). Finally, a study by Zuley et al (33) measured mean areas under the curve for SM alone, FFDM alone, SM plus DBT, and FFDM plus DBT and found comparable performances between FFDM and SM in the different protocols (33). These results support using DBT plus SM as a substitute for FFDM alone for breast cancer screening, which may improve overall cancer detection.
Calcifications and Breast Cancer
Breast cancers can have a variety of appearances at mammography and may manifest with calcifications (34). Invasive and in situ breast cancers can manifest with calcium deposits that vary in number, size, and density (35). Invasive tumors detected on the basis of the presence of calcifications at mammography may have worse prognostic factors than those of noncalcified cancers, which highlights the importance of early diagnosis of malignant calcifications (36,37). While DBT brings substantial improvements to breast cancer imaging, it is important to be aware of its strengths and limitations regarding detection of calcifications.
Types of Breast Calcifications
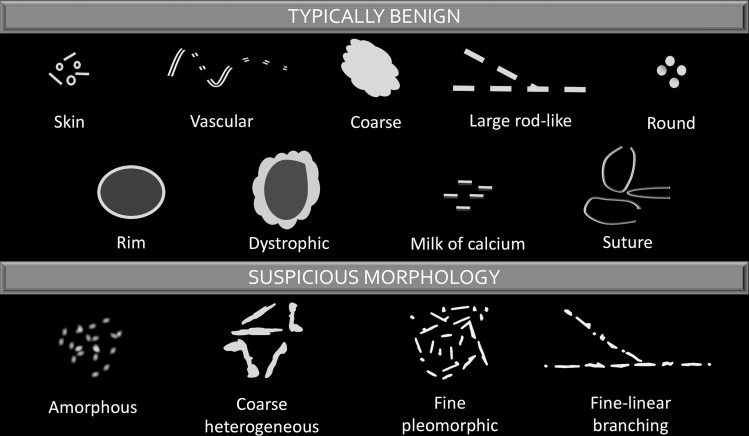
Calcifications are described by their morphology and distribution according to the Breast Imaging Reporting and Data System (BI-RADS) lexicon (38). Calcification morphology is classified as typically benign or suspicious (Fig 1). While the imaging appearance of calcifications at DBT and SM is comparable to that at FFDM, there are specific features that may be more conspicuous at DBT, influencing imaging interpretation.
Figure 1.
Chart categorizes and illustrates the various types of calcification morphology depicted at mammography. Calcification morphology is classified as typically benign or suspicious. (Descriptors are from reference 38.)
Benign Calcifications
Benign calcifications tend to be larger, more regular, and easier to detect at mammography than malignant calcifications. Typically benign calcifications (BI-RADS category 2) include skin, vascular, coarse (popcornlike), large rodlike, round, rim, dystrophic, milk-of-calcium, and suture calcifications (38). The visualization of some benign calcifications is facilitated with DBT.
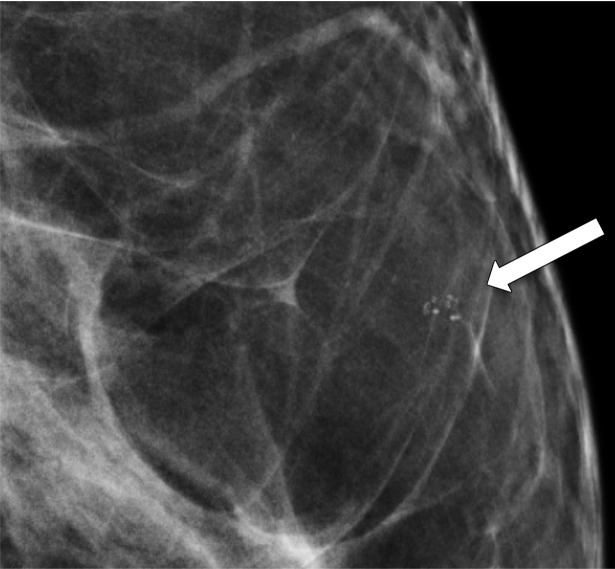
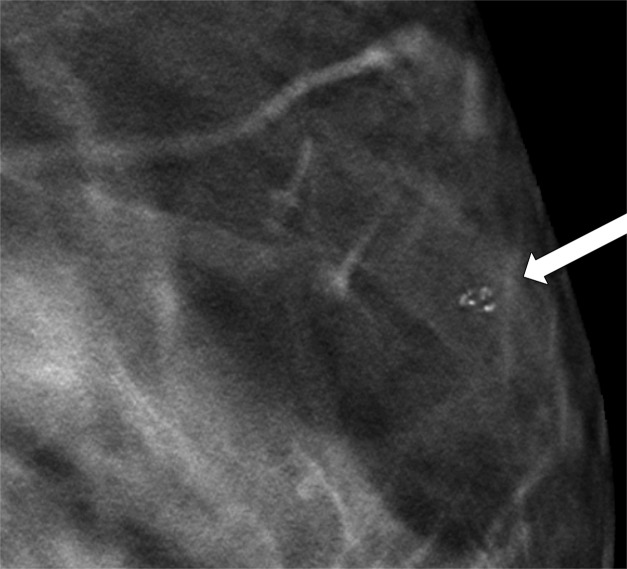
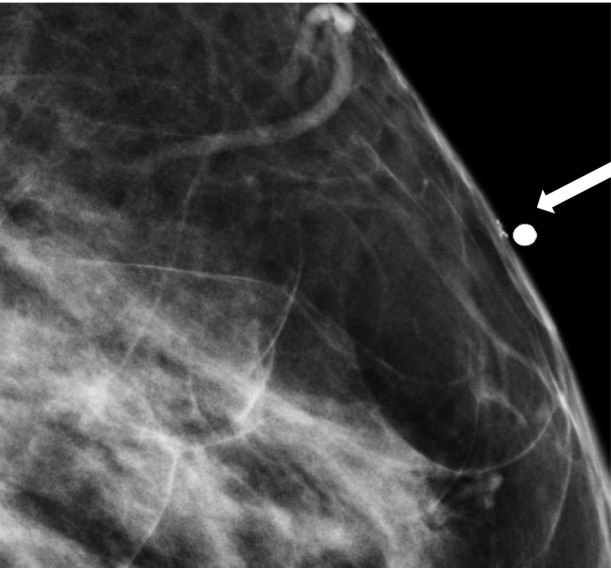
Skin calcifications frequently have a radiolucent center and appear in small groups. Occasionally they may mimic suspicious calcifications at mammography. The quasi–3D feature of DBT can make it easier to identify calcifications within the skin. The skin at DBT usually appears on the first and last three images of the DBT sequence where the skin is touching the compression paddle or detector (9,39). Parts of the skin that are not touching the equipment will not appear on the first and last images; thus, obtaining a tangential view may be necessary to depict calcifications within the skin (Fig 2).
Figure 2a.
Skin calcifications. Mediolateral oblique (MLO) full-field digital mammogram (a), MLO DBT image (b) (image number 7 out of 40), and FFDM tangential view (c) show calcifications (arrow) within the skin. Skin calcifications may not appear on the first or last three DBT images if the skin containing the calcifications is not touching the equipment, and additional imaging may be required.
Figure 2b.
Skin calcifications. Mediolateral oblique (MLO) full-field digital mammogram (a), MLO DBT image (b) (image number 7 out of 40), and FFDM tangential view (c) show calcifications (arrow) within the skin. Skin calcifications may not appear on the first or last three DBT images if the skin containing the calcifications is not touching the equipment, and additional imaging may be required.
Figure 2c.
Skin calcifications. Mediolateral oblique (MLO) full-field digital mammogram (a), MLO DBT image (b) (image number 7 out of 40), and FFDM tangential view (c) show calcifications (arrow) within the skin. Skin calcifications may not appear on the first or last three DBT images if the skin containing the calcifications is not touching the equipment, and additional imaging may be required.
Moreover, equipment characteristics may cause skin calcifications to not appear on the first or last three images. When a flexible compression paddle is used, skin calcifications within the anterior thinner part of the breast may appear deeper in the stack of images even if they are touching the paddle. Furthermore, equipment inaccuracies in calculating exact breast thickness may create additional images and cause the skin to appear deeper in the image stack (39).
Vascular calcifications appear as parallel lines associated with tubular structures that may or may not be continuous. The parallel orientation of vascular calcifications or associated tubular vessels may be easier to identify at DBT, facilitating the diagnosis (Fig 3) (11).
Figure 3.
MLO DBT image shows vascular calcifications. The tubular parallel orientation of vascular calcifications may be better depicted at DBT than at FFDM.
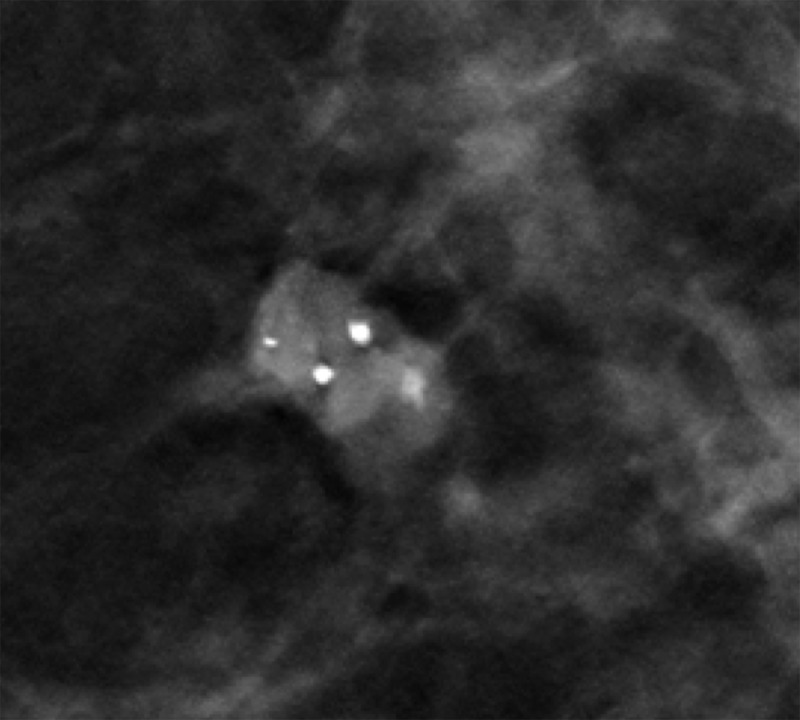
Lesions that are associated with calcifications may be better depicted at DBT. Coarse or popcornlike calcifications tend to be larger, usually over 3 mm, and manifest due to an involuting fibroadenoma. The associated mass of a calcifying fibroadenoma may be depicted only on DBT images (Fig 4) (19).
Figure 4.
MLO DBT image shows an oval circumscribed mass containing coarse calcifications, a finding consistent with a calcified fibroadenoma. Coarse calcifications and an associated mass may be better depicted at DBT than at FFDM.
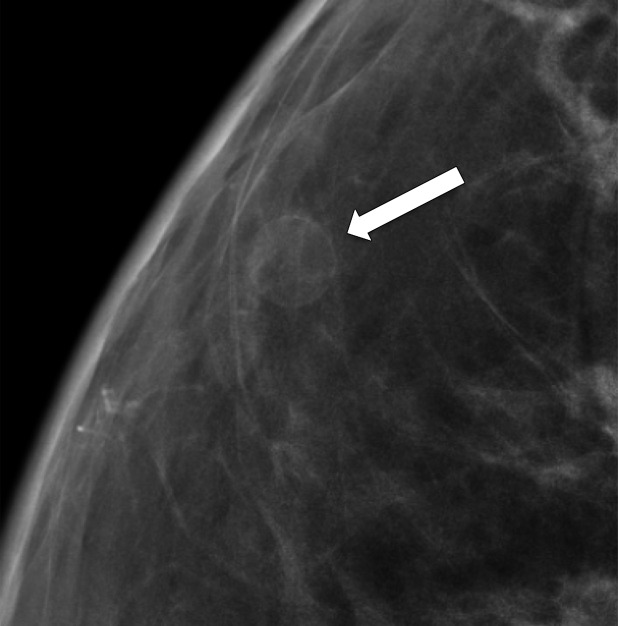
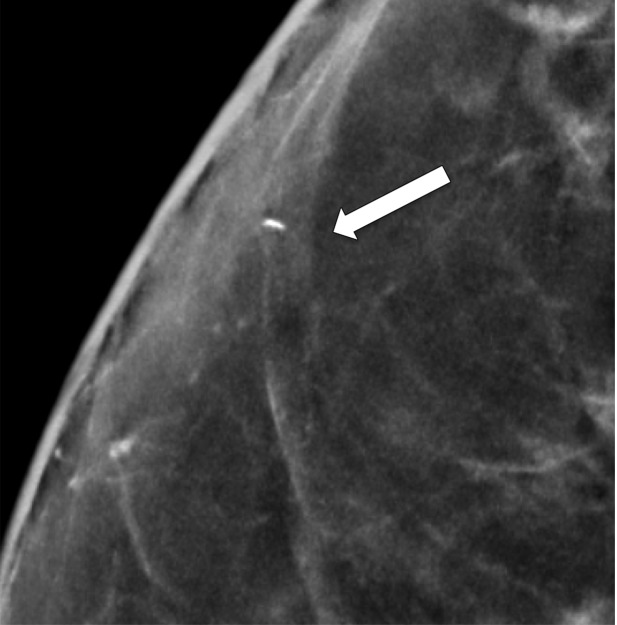
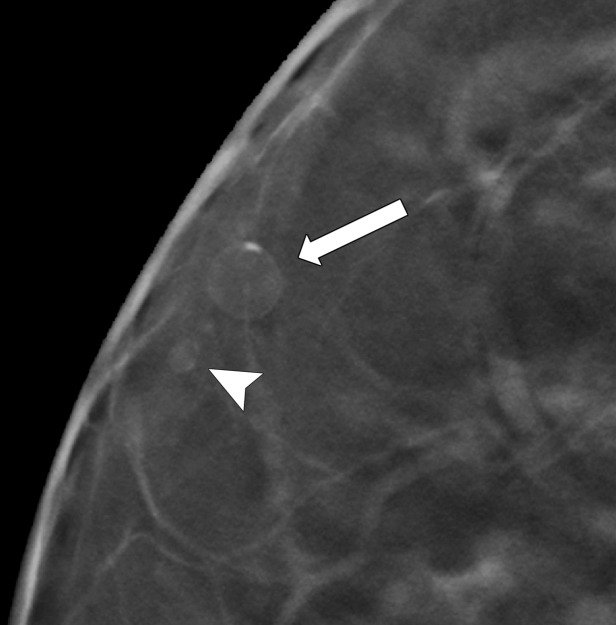
Rim calcifications vary in size and have calcified walls and a radiolucent center. Fat necrosis and oil cysts typically demonstrate this appearance. Thin curvilinear calcifications within the walls of an oil cyst and associated fat density may be better depicted at DBT than at FFDM (Fig 5).
Figure 5a.
Calcification within the walls of an oil cyst. (a) MLO full-field digital mammogram shows calcified walls of an oil cyst (arrow), which are clearly visible. (b) MLO synthetic mammogram shows the calficifed cyst wall (arrow), but the associated oil cyst is not as clearly depicted as on the MLO full-field digital mammogram. (c) MLO DBT image shows the same oil cyst (arrow) and a smaller adjacent oil cyst (arrowhead).
Figure 5b.
Calcification within the walls of an oil cyst. (a) MLO full-field digital mammogram shows calcified walls of an oil cyst (arrow), which are clearly visible. (b) MLO synthetic mammogram shows the calficifed cyst wall (arrow), but the associated oil cyst is not as clearly depicted as on the MLO full-field digital mammogram. (c) MLO DBT image shows the same oil cyst (arrow) and a smaller adjacent oil cyst (arrowhead).
Figure 5c.
Calcification within the walls of an oil cyst. (a) MLO full-field digital mammogram shows calcified walls of an oil cyst (arrow), which are clearly visible. (b) MLO synthetic mammogram shows the calficifed cyst wall (arrow), but the associated oil cyst is not as clearly depicted as on the MLO full-field digital mammogram. (c) MLO DBT image shows the same oil cyst (arrow) and a smaller adjacent oil cyst (arrowhead).
Milk-of-calcium calcifications are small calcium deposits within cysts. They typically appear as small horizontally oriented calcifications on the MLO view, in contrast to a round or smudgy appearance on the craniocaudal view. Although their characteristic appearance is often depicted at DBT and FFDM, magnification views may be necessary, including a mediolateral or lateromedial magnification image, to better demonstrate layering and confirm changing morphology compared with that on the craniocaudal magnification view.
Probably Benign Calcifications
Lesions that have a less than 2% likelihood of malignancy are classified as probably benign (BI-RADS category 3) (38). Early benign calcifications (eg, vascular and fat necrosis) may not have all typically benign features and are sometimes classified as probably benign (40). Some studies demonstrate that solitary groups of round (punctate) calcifications could also be safely included in this category if a patient has not undergone prior imaging (41–43). However, other studies demonstrate positive predictive values for groups of round calcifications as greater than 2% (43,44). Thus, some radiologists recommend performing biopsies of these calcifications if there are other risk factors, including patient history of breast cancer, nonexclusive punctate morphology of the calcifications, or a high number of calcifications (43).
If calcifications are detected at baseline screening mammography (DBT and/or 2D mammography) and a probably benign appearance is confirmed with craniocaudal and true lateral magnification views, they are then followed with magnification views obtained at 6, 12, and 24 months. If findings are stable for 24 months or more, a BI-RADS category 2 final assessment may be issued. If there is a suspicious change in morphology or an increase in the number of calcifications at follow-up imaging, a BI-RADS category 4 assessment with biopsy recommendation should be issued (40,41).
Suspicious Calcifications
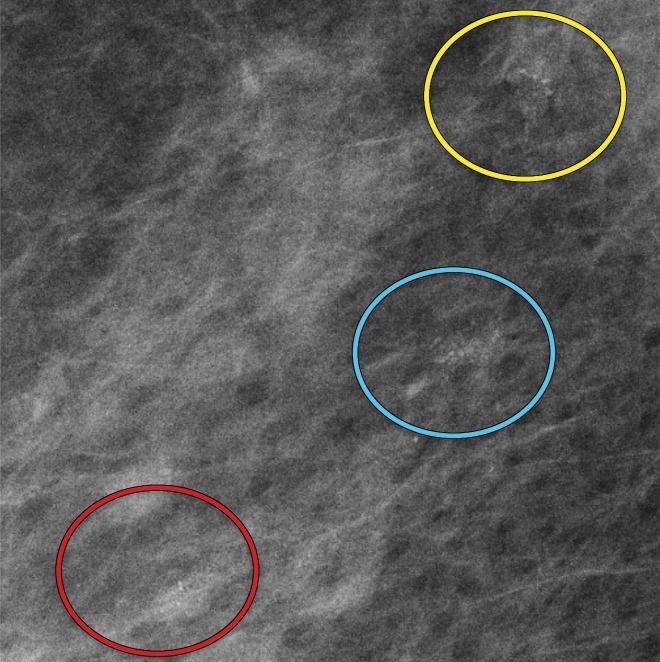
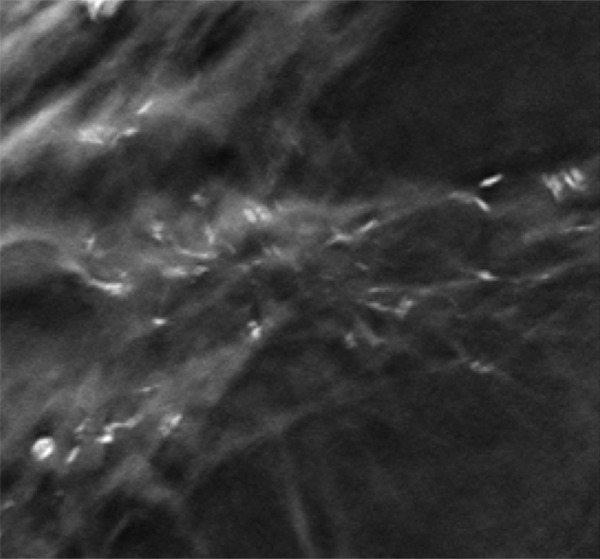
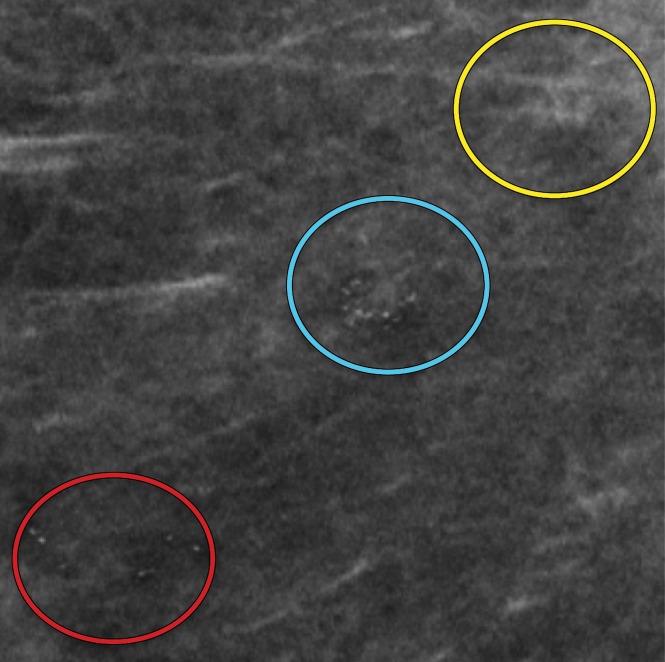
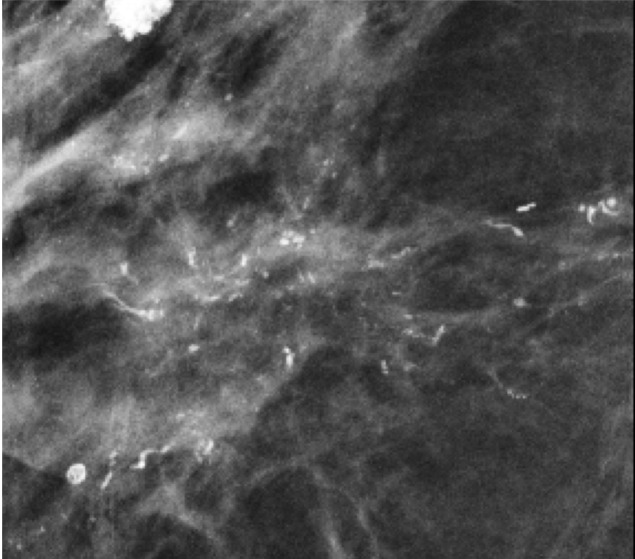
Suspicious calcifications (BI-RADS category 4) tend to be smaller and more irregular. They are morphologically described as amorphous, coarse heterogeneous, fine pleomorphic, or fine linear or fine-linear branching in the BI-RADS lexicon (38). Calcifications with suspicious morphology may be better depicted at DBT. Some calcifications may be enhanced or have greater conspicuity at DBT, improving visualization and correct classification. Furthermore, the distances between groups of calcifications and their distribution within the breast in patients with multifocal lesions may be better depicted at DBT, allowing radiologists and surgeons to better appreciate disease extent, especially if a group is seen in only one projection (Figs 6, 7; Movie 1).
Figure 6a.
Amorphous calcification groups (circle outlines) in the right breast in a 56-year-old woman with ductal carcinoma in situ (DCIS). (a) MLO full-field digital mammogram shows three groups of amorphous calcifications. The upper group (yellow circle) shows greater conspicuity in comparison to that of the lower group (red circle). (b) MLO synthetic mammogram shows the three groups of amorphous calcifications with better conspicuity in the lower group (red circle) in comparison to those depicted at FFDM. At DBT (Movie 1), all three amorphous groups are clearly visible.
Figure 7a.
Segmental fine pleomorphic and fine-linear branching calcifications in a 57-year-old woman. MLO DBT image (a), MLO full-field digital mammogram (b), and magnification view of the mediolateral full-field digital mammogram (c) show segmental fine pleomorphic and fine-linear branching calcifications in the right breast. The results of a biopsy confirmed DCIS.
Figure 6b.
Amorphous calcification groups (circle outlines) in the right breast in a 56-year-old woman with ductal carcinoma in situ (DCIS). (a) MLO full-field digital mammogram shows three groups of amorphous calcifications. The upper group (yellow circle) shows greater conspicuity in comparison to that of the lower group (red circle). (b) MLO synthetic mammogram shows the three groups of amorphous calcifications with better conspicuity in the lower group (red circle) in comparison to those depicted at FFDM. At DBT (Movie 1), all three amorphous groups are clearly visible.
Figure 7b.
Segmental fine pleomorphic and fine-linear branching calcifications in a 57-year-old woman. MLO DBT image (a), MLO full-field digital mammogram (b), and magnification view of the mediolateral full-field digital mammogram (c) show segmental fine pleomorphic and fine-linear branching calcifications in the right breast. The results of a biopsy confirmed DCIS.
Figure 7c.
Segmental fine pleomorphic and fine-linear branching calcifications in a 57-year-old woman. MLO DBT image (a), MLO full-field digital mammogram (b), and magnification view of the mediolateral full-field digital mammogram (c) show segmental fine pleomorphic and fine-linear branching calcifications in the right breast. The results of a biopsy confirmed DCIS.
Movie 1.
DBT images in a 56-year-old woman show three calcification groups (circles) corresponding to DCIS. At FFDM (Fig 6a), the posterior and middle groups were visible, while at synthesized mammography (Fig 6b), the anterior and middle groups were seen. The three groups are clearly visible at DBT.
Distribution
Calcifications may also be classified by their distribution according to the BI-RADS lexicon (38). Calcification distribution can be described as diffuse, regional, grouped, linear, or segmental. A diffuse distribution is almost always benign, especially when it is bilateral, while linear and segmental distributions have a greater probability of malignancy.
Distribution may assist with assessment and must be considered in addition to morphology. For example, round calcifications when linear or segmental in distribution should be considered suspicious and classified as BI-RADS category 4, with biopsy recommended. Calcification distribution may be more evident on DBT images.
Calcification Artifacts at DBT
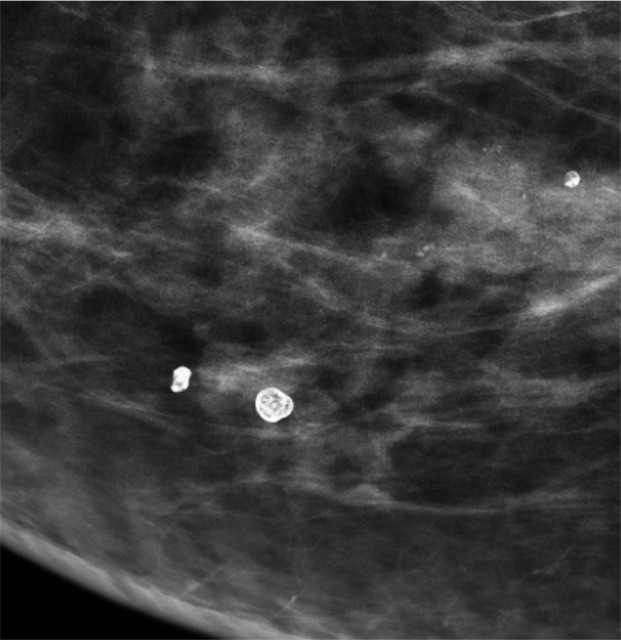
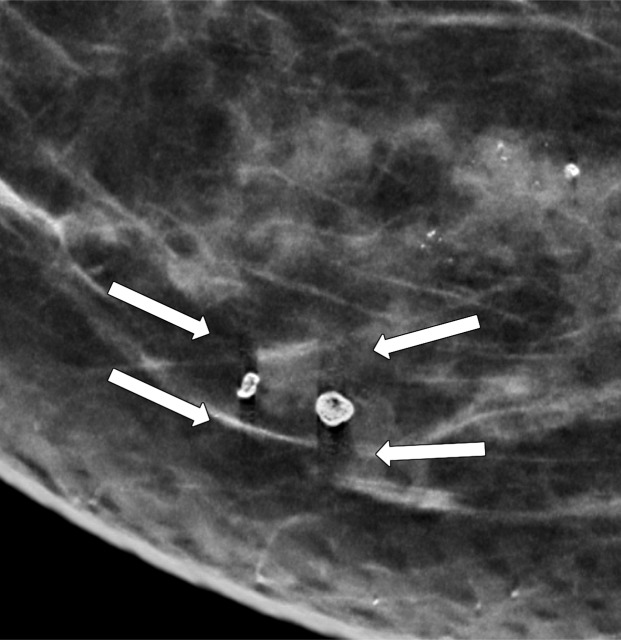
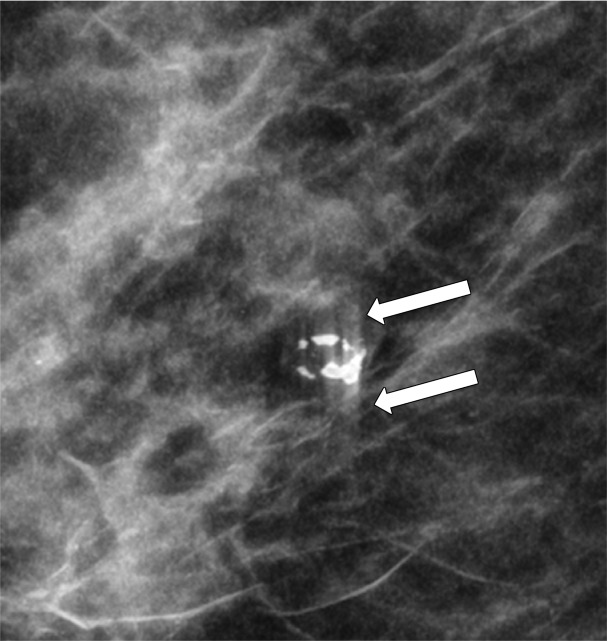
There are some artifacts that can jeopardize DBT image quality. The most frequent artifacts related to calcifications are shadowing and zipper artifacts (9,19,45–47). Shadowing, also termed slinky artifact, corresponds to dark lines resembling shadows adjacent to large calcifications that are typically depicted on SM views, while zipper artifacts represent repetition of dense calcifications or metallic material out of plane on the DBT image stack (Fig 8). Although there are computational algorithms that are applied to reduce these artifacts, they may still impair lesion visualization in the areas where they appear (45).
Figure 8a.
(a, b) MLO full-field digital mammogram (a) shows dense calcifications, with associated shadowing artifacts (arrows in b) on the MLO synthetic mammogram (b). Shadowing artifact may occur on synthesized mammograms and can jeopardize the evaluation of adjacent lesions. (c) MLO DBT image shows zipper artifacts (arrows), which are out-of-plane image repetitions that may also be seen with dense calcifications.
Figure 8b.
(a, b) MLO full-field digital mammogram (a) shows dense calcifications, with associated shadowing artifacts (arrows in b) on the MLO synthetic mammogram (b). Shadowing artifact may occur on synthesized mammograms and can jeopardize the evaluation of adjacent lesions. (c) MLO DBT image shows zipper artifacts (arrows), which are out-of-plane image repetitions that may also be seen with dense calcifications.
Figure 8c.
(a, b) MLO full-field digital mammogram (a) shows dense calcifications, with associated shadowing artifacts (arrows in b) on the MLO synthetic mammogram (b). Shadowing artifact may occur on synthesized mammograms and can jeopardize the evaluation of adjacent lesions. (c) MLO DBT image shows zipper artifacts (arrows), which are out-of-plane image repetitions that may also be seen with dense calcifications.
Furthermore, algorithm enhancement of dense structures and image noise may create artifacts on SM images that mimic calcifications (48). Although some of these pseudocalcifications may look suspicious, they are visible on only one view and are not depicted on DBT images, which can help the radiologist determine that these are artifacts (10,46,47). If there is doubt, a magnification view of the area in question may occasionally be necessary to determine if calcifications are truly present.
Clinical Performance of DBT in the Detection of Breast Calcifications
DBT versus FFDM
Few studies have compared the detection of malignant calcifications between DBT and FFDM. In a multireader study with 99 cases of malignant calcifications conducted by Spangler et al (23), a lower sensitivity for detecting cancer at DBT alone (80%) compared with at FFDM (90%) was observed. In another study with 41 malignant calcification cases by Tagliafico et al (49), a sensitivity of 91.1% at DBT and 100% at FFDM was observed (49). Both FFDM and DBT demonstrate high sensitivity for detecting malignant calcifications, but some calcifications may not be detected at DBT-only screening.
DBT Plus FFDM versus FFDM Alone
Some studies compared cancer detection rates for microcalcifications between DBT plus FFDM and FFDM alone. In the TOMMY trial, which had a large number of malignant calcifications (n = 282), similar sensitivities (88%) were observed between the two screening protocols for detecting malignant calcifications (24). Other studies with smaller subsets of malignant calcification cases also demonstrated no significant difference in sensitivity between DBT plus FFDM and FFDM alone (27,50). On the other hand, in a study with only six malignant calcifications cases by Bernardi et al (25), half were detected only at DBT plus FFDM screenings and were missed at FFDM alone. This may suggest that DBT may occasionally better depict malignant calcifications than does FFDM. Therefore, the meticulous search for calcifications should also be performed on DBT images.
SM versus FFDM
The diagnostic performance of SM for microcalcifications has also been evaluated. In the TOMMY trial, the performance of DBT plus SM in detecting malignant calcifications was 85%, slightly inferior to that of DBT plus FFDM and FFDM alone, which was 88% for both (24). Specificity, on the other hand, was better at DBT plus SM than at DBT plus FFDM and at FFDM alone (44% vs 39% and 31%, respectively). Some studies with a limited subset of patients with malignant calcifications compared SM alone with FFDM alone and demonstrated similar sensitivities (12,33,51). The different sensitivities reported for FFDM, DBT, and SM in detecting breast cancers that have calcifications as the dominant feature are summarized in Table 1.
Table 1:
Cancer Detection Sensitivity Studies of Lesions with Calcifications as the Dominant Feature at FFDM, DBT, and SM
Note.—NA = not applicable.
*Only sensitivity for suspicious microcalcifications was reported.
Calcification Conspicuity
Calcification conspicuity is dependent on image quality, which contributes to image contrast and the number of visible calcifications (52). At FFDM, DBT, and SM, variations in conspicuity of calcifications might occur among them, which could potentially lead to false-positive or false-negative diagnoses. This happens in part because calcifications at DBT and SM might be enhanced or suppressed during computational reconstruction. Moreover, spatial resolution is lower at DBT owing to tube motion, greater pixel size, and pixel binning, which also affects lesion conspicuity (53).
An initial study of calcification conspicuity at DBT showed that it could be inferior to that at FFDM in over half of cases (54). More recent studies demonstrated image quality equal to or better than that of FFDM in as high as 92.2% of patients (55–57). This included better conspicuity at DBT than at FFDM in nearly half of cases (56,57). These results show that technology improvements can make calcification visualization at DBT similar to that at FFDM. Slab views with increased thickness may also improve calcification conspicuity and help the visualization of microcalcifications that are on consecutive 1-mm images. With 10-mm slab views, the distribution of calcifications is better depicted, which may help guide image interpretation (9,56).
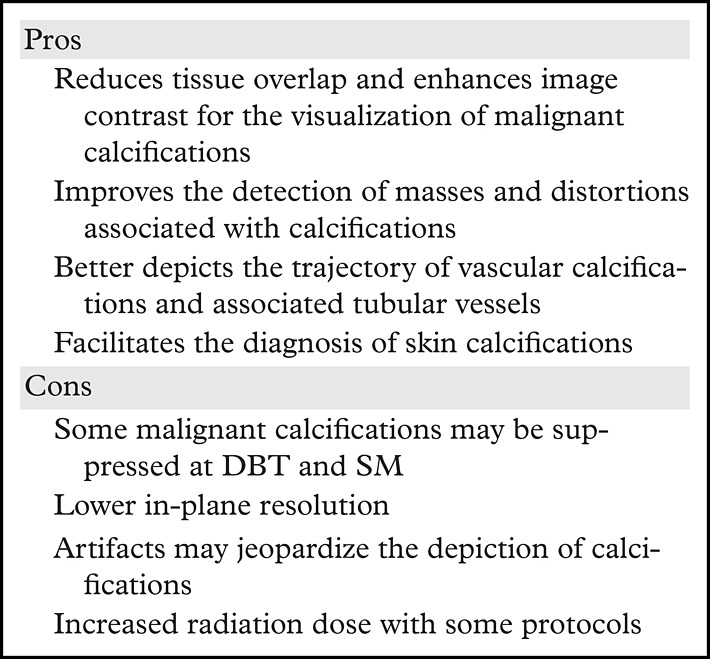
With the advent of SM, an overall improvement in calcification conspicuity has been observed. In a study conducted by Hwang et al (52) on the evaluation of DCIS calcifications on craniocaudal and MLO views, SM provided greater image contrast on the majority of images compared with image contrast at FFDM; however, a larger number of calcifications were visible at FFDM in most cases (52). In a study by Mariscotti et al (12), conspicuity of suspicious microcalcifications at SM was better than or equal to that at FFDM in 94.2% of cases (12). These results demonstrate that calcification conspicuity may be better with the DBT plus SM protocol than at FFDM-only screening in some cases. Studies that evaluate calcification conspicuity at DBT and SM are summarized in Table 2. The pros and cons of using DBT for the evaluation of calcifications are summarized in Table 3.
Table 2:
Studies of Calcification Conspicuity at DBT and SM Compared with that at FFDM
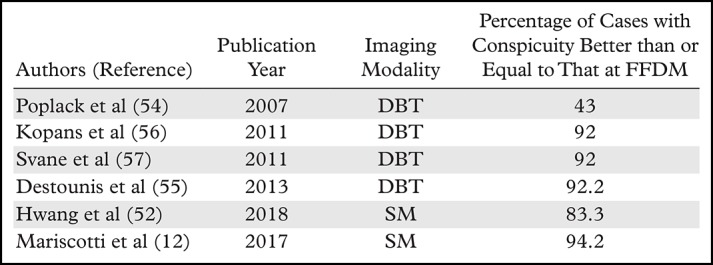
Table 3:
Pros and Cons of Using DBT for Diagnosing Breast Calcifications
Despite good conspicuity at FFDM, DBT, and SM for the evaluation of suspicious breast calcifications, it is still recommended to obtain magnification views for characterization (11). Calcification conspicuity on magnification views is superior and may not only facilitate image interpretation but also help identify lesion extent and guide biopsy planning, preoperative localization, or future follow-up, if indicated (Fig 9).
Figure 9a.
Grouped amorphous calcifications in a 61-year-old woman. (a, b) MLO full-field digital mammogram (a) and MLO DBT image (b) show similar conspicuity of grouped amorphous calcifications. (c) Mediolateral magnified view of the full-field digital mammogram shows calcifications with greater conspicuity than those seen in a and b, which better demonstrates their extent, number, and morphology. The results of a biopsy confirmed DCIS.
Figure 9b.
Grouped amorphous calcifications in a 61-year-old woman. (a, b) MLO full-field digital mammogram (a) and MLO DBT image (b) show similar conspicuity of grouped amorphous calcifications. (c) Mediolateral magnified view of the full-field digital mammogram shows calcifications with greater conspicuity than those seen in a and b, which better demonstrates their extent, number, and morphology. The results of a biopsy confirmed DCIS.
Figure 9c.
Grouped amorphous calcifications in a 61-year-old woman. (a, b) MLO full-field digital mammogram (a) and MLO DBT image (b) show similar conspicuity of grouped amorphous calcifications. (c) Mediolateral magnified view of the full-field digital mammogram shows calcifications with greater conspicuity than those seen in a and b, which better demonstrates their extent, number, and morphology. The results of a biopsy confirmed DCIS.
DBT-guided Biopsy
Stereotactic-guided vacuum-assisted breast biopsy is widely performed, usually for calcifications. This well-established image-guided biopsy technique is successful for adequately sampling suspicious calcifications in the majority of cases. Stereotactic biopsy may be challenging when the identification and triangulation of calcifications in two views is difficult or when a prone technique is used and calcifications are posteriorly located. The restricted biopsy window can make lesion localization problematic (58).
With the increasing use of DBT, radiologists are more frequently required to biopsy lesions that are only or better depicted at DBT. DBT-guided biopsy has been successfully implemented over the past few years (58–60). The biopsy procedure is similar to that of a conventional stereotactic biopsy, but DBT allows for the use of the full detector size, which may facilitate lesion localization, and is usually performed in the upright position, depending on equipment availability. Furthermore, triangulation is not necessary at DBT for depth localization. The position of a biopsy clip in relation to the biopsy site may also be easier to evaluate at DBT-guided biopsy, and DBT may facilitate the identification of biopsy marker displacement (Movie 2).
Movie 2a.
(a) DBT images in a 54-year-old woman with a history of conservation surgery in the right breast show calcifications (circle) near the surgical bed that were seen on DBT images only. (b) DBT images obtained after successful vacuum-guided needle biopsy sampling show a correctly positioned clip (circle) at the biopsy site.
Movie 2b.
(a) DBT images in a 54-year-old woman with a history of conservation surgery in the right breast show calcifications (circle) near the surgical bed that were seen on DBT images only. (b) DBT images obtained after successful vacuum-guided needle biopsy sampling show a correctly positioned clip (circle) at the biopsy site.
Some grouped or faint calcifications may be difficult to visualize on DBT images. Therefore, the use of DBT-guided biopsy for the diagnosis of suspicious calcifications may be challenging. Conventional stereotactic biopsy is still needed if calcifications are too fine to be depicted at DBT, if artifacts jeopardize lesion visualization, or if placing the patient in the prone position is necessary and prone DBT-guided biopsy is not available (58–60).
Studies that evaluate the performance of DBT-guided biopsy in comparison with that of conventional stereotactic biopsy did not specifically address performing biopsies of calcifications. Additionally, DBT-guided biopsies are usually performed in the upright position while stereotactic biopsies are typically performed with the patient in the prone position, depending on equipment availability, making comparison problematic. In a study by Schrading et al (58), successful procedures were observed in 100% of DBT-guided biopsies, in comparison with 93% of prone stereotactic procedures (58). However, in this study, most lesions in the DBT group were not calcified.
The facilitation of lesion localization with DBT also led to an average procedure time reduction of over 50%. Waldherr et al (59) similarly showed a 100% success rate with an average procedure time reduction of 8 minutes. Facilitation of lesion localization and reduction in procedure time are positive features of DBT-guided biopsy, but limited visualization of some fine calcifications or of less tightly grouped calcifications on DBT images is still an obstacle.
Future Directions for DBT
Several DBT studies are taking place that may provide important information on breast cancer screening. The Tomosynthesis Mammographic Imaging Screening Trial (TMIST) will be the largest study to date, with plans to enroll approximately 165 000 women by 2020 in the United States and Canada (61). The TMIST will compare DBT and FFDM screening protocols with the objective of determining which is the best screening modality.
As research groups continue to dedicate their efforts to evaluating the clinical implementation of DBT and SM, it is expected that in the near future more data will be available regarding the pros and cons of transitioning from FFDM alone to FFDM plus DBT or to DBT plus SM screening. Of paramount importance are the results regarding patient outcomes, specifically the impact of DBT on cancer mortality.
There are a number of experimental technologies that are being developed for improving the diagnostic capability of DBT (62). A few of them may improve the detection of malignant calcifications and have been tested in a clinical setting. Novel DBT equipment with higher in-plane and depth resolution, which may create shorter imaging times and fewer artifacts, is being developed and will soon be on the market with the potential to improve lesion conspicuity and cancer detection (63).
Automated computer-detection systems, including computer-aided diagnosis (CAD) for characterization of breast lesions on DBT images, have been evaluated in several studies. The results demonstrate a faster reading time with similar performance as observed with CAD used with FFDM, including in the evaluation of breast calcifications (64–68).
Contrast material–enhanced DBT is another promising technology that combines the morphologic features depicted at DBT with enhancement characteristics of breast lesions (62). Contrast-enhanced DBT has a shorter examination time than that of MRI and in the future, pending further study, may be considered as an alternative imaging modality for patients with contraindications to MRI. Contrast-enhanced DBT demonstrates superior sensitivity for breast cancer detection compared with that of FFDM and DBT, with a performance similar to that of contrast-enhanced digital mammography (69).
Conclusion
The visualization of breast lesions, including benign and malignant calcifications, was facilitated with the advent of DBT. Although a few malignant calcifications may be missed at DBT plus SM screening that would be detected at FFDM, it is still unclear whether these delayed diagnoses would impact patient survival. New computational algorithms and equipment are being developed that may improve calcification conspicuity at DBT and SM. Future studies with these new technologies may show even better performance of these novel techniques in the diagnosis of breast neoplasms that have calcifications as the dominant imaging feature.
Acknowledgments
Acknowledgments
The authors thank Joanne Chin, MFA, for her editorial assistance with this manuscript and Danny F. Martinez, MS, for his database support.
J.V.H., D.M.K., H.R.D, E.A.M, and V.L.M. supported by a Memorial Sloan Kettering Cancer Center Support Grant/National Institute of Health Core Grant (P30 CA008748). J.V.H. and H.R.D supported by a Breast Cancer Research Foundation grant of Memorial Sloan Kettering Cancer Center.
Presented as an education exhibit at the 2017 RSNA Annual Meeting.
For this journal-based SA-CME activity, the authors, editor, and reviewers have disclosed no relevant relationships.
Abbreviations:
- BI-RADS
- Breast Imaging Reporting and Data System
- DBT
- digital breast tomosynthesis
- DCIS
- ductal carcinoma in situ
- FFDM
- full-field digital mammography
- MLO
- mediolateral oblique
- SM
- synthetic mammography
- 3D
- three-dimensional
- 2D
- two-dimensional
References
- 1.Tabár L, Vitak B, Chen TH, et al. Swedish two-county trial: impact of mammographic screening on breast cancer mortality during 3 decades. Radiology 2011;260(3):658–663. [DOI] [PubMed] [Google Scholar]
- 2.Plecha D, Salem N, Kremer M, et al. Neglecting to screen women between 40 and 49 years old with mammography: what is the impact on treatment morbidity and potential risk reduction? AJR Am J Roentgenol 2014;202(2):282–288. [DOI] [PubMed] [Google Scholar]
- 3.de Munck L, de Bock GH, Otter R, et al. Digital vs screen-film mammography in population-based breast cancer screening: performance indicators and tumour characteristics of screen-detected and interval cancers. Br J Cancer 2016;115(5):517–524. [DOI] [PMC free article] [PubMed] [Google Scholar]
- 4.Théberge I, Vandal N, Langlois A, Pelletier É, Brisson J. Detection rate, recall rate, and positive predictive value of digital compared to screen-film mammography in the Quebec population-based breast cancer screening program. Can Assoc Radiol J 2016;67(4):330–338. [DOI] [PubMed] [Google Scholar]
- 5.Souza FH, Wendland EM, Rosa MI, Polanczyk CA. Is full-field digital mammography more accurate than screen-film mammography in overall population screening? A systematic review and meta-analysis. Breast 2013;22(3):217–224. [DOI] [PubMed] [Google Scholar]
- 6.Chiarelli AM, Prummel MV, Muradali D, et al. Digital versus screen-film mammography: impact of mammographic density and hormone therapy on breast cancer detection. Breast Cancer Res Treat 2015;154(2):377–387. [DOI] [PubMed] [Google Scholar]
- 7.Helvie MA. Digital mammography imaging: breast tomosynthesis and advanced applications. Radiol Clin North Am 2010;48(5):917–929. [DOI] [PMC free article] [PubMed] [Google Scholar]
- 8.Ortenzia O, Rossi R, Bertolini M, Nitrosi A, Ghetti C. Physical characterisation of four different commercial digital breast tomosynthesis systems. Radiat Prot Dosimetry 10.1093/rpd/ncy024. Published online February 15, 2018. [DOI] [PubMed] [Google Scholar]
- 9.Roth RG, Maidment AD, Weinstein SP, Roth SO, Conant EF. Digital breast tomosynthesis: lessons learned from early clinical implementation. RadioGraphics 2014;34 (4):E89–E102. [DOI] [PMC free article] [PubMed] [Google Scholar]
- 10.Ratanaprasatporn L, Chikarmane SA, Giess CS. Strengths and weaknesses of synthetic mammography in screening. RadioGraphics 2017;37(7):1913–1927. [DOI] [PubMed] [Google Scholar]
- 11.Peppard HR, Nicholson BE, Rochman CM, Merchant JK, Mayo RC, 3rd, Harvey JA. Digital breast tomosynthesis in the diagnostic setting: indications and clinical applications. RadioGraphics 2015;35(4):975–990. [DOI] [PubMed] [Google Scholar]
- 12.Mariscotti G, Durando M, Houssami N, et al. Comparison of synthetic mammography, reconstructed from digital breast tomosynthesis, and digital mammography: evaluation of lesion conspicuity and BI-RADS assessment categories. Breast Cancer Res Treat 2017;166(3):765–773. [DOI] [PubMed] [Google Scholar]
- 13.Korhonen KE, Weinstein SP, McDonald ES, Conant EF. Strategies to increase cancer detection: review of true-positive and false-negative results at digital breast tomosynthesis screening. RadioGraphics 2016;36(7):1954–1965. [DOI] [PMC free article] [PubMed] [Google Scholar]
- 14.Gennaro G, Bernardi D, Houssami N. Radiation dose with digital breast tomosynthesis compared to digital mammography: per-view analysis. Eur Radiol 2018;28(2):573–581. [DOI] [PubMed] [Google Scholar]
- 15.Freer PE, Riegert J, Eisenmenger L, et al. Clinical implementation of synthesized mammography with digital breast tomosynthesis in a routine clinical practice. Breast Cancer Res Treat 2017;166(2):501–509. [DOI] [PubMed] [Google Scholar]
- 16.Morris JM. U.S. Food and Drug Administration [letter]. https://www.accessdata.fda.gov/cdrh_docs/pdf8/p080003s001a.pdf. Published May 16, 2013. Accessed June 7, 2018.
- 17.Caumo F, Zorzi M, Brunelli S, et al. Digital breast tomosynthesis with synthesized two-dimensional images versus full-field digital mammography for population screening: outcomes from the Verona screening program. Radiology 2018;287(1):37–46. [DOI] [PubMed] [Google Scholar]
- 18.Zuckerman SP, Conant EF, Keller BM, et al. Implementation of synthesized two-dimensional mammography in a population-based digital breast tomosynthesis screening program. Radiology 2016;281(3):730–736. [DOI] [PMC free article] [PubMed] [Google Scholar]
- 19.Park JM, Franken EA, Jr, Garg M, Fajardo LL, Niklason LT. Breast tomosynthesis: present considerations and future applications. RadioGraphics 2007;27(suppl 1):S231–S240. [DOI] [PubMed] [Google Scholar]
- 20.Lång K, Andersson I, Zackrisson S. Breast cancer detection in digital breast tomosynthesis and digital mammography—a side-by-side review of discrepant cases. Br J Radiol 2014;87(1040):20140080. [DOI] [PMC free article] [PubMed] [Google Scholar]
- 21.Bahl M, Lamb LR, Lehman CD. Pathologic outcomes of architectural distortion on digital 2D versus tomosynthesis mammography. AJR Am J Roentgenol 2017;209(5): 1162–1167. [DOI] [PubMed] [Google Scholar]
- 22.Skaane P, Gullien R, Bjørndal H, et al. Digital breast tomosynthesis (DBT): initial experience in a clinical setting. Acta Radiol 2012;53(5):524–529. [DOI] [PubMed] [Google Scholar]
- 23.Spangler ML, Zuley ML, Sumkin JH, et al. Detection and classification of calcifications on digital breast tomosynthesis and 2D digital mammography: a comparison. AJR Am J Roentgenol 2011;196(2):320–324. [DOI] [PubMed] [Google Scholar]
- 24.Gilbert FJ, Tucker L, Gillan MG, et al. Accuracy of digital breast tomosynthesis for depicting breast cancer subgroups in a UK retrospective reading study (TOMMY trial). Radiology 2015;277(3):697–706. [DOI] [PubMed] [Google Scholar]
- 25.Bernardi D, Caumo F, Macaskill P, et al. Effect of integrating 3D-mammography (digital breast tomosynthesis) with 2D-mammography on radiologists’ true-positive and false-positive detection in a population breast screening trial. Eur J Cancer 2014;50(7):1232–1238. [DOI] [PubMed] [Google Scholar]
- 26.Ciatto S, Houssami N, Bernardi D, et al. Integration of 3D digital mammography with tomosynthesis for population breast-cancer screening (STORM): a prospective comparison study. Lancet Oncol 2013;14(7):583–589. [DOI] [PubMed] [Google Scholar]
- 27.Skaane P, Bandos AI, Gullien R, et al. Comparison of digital mammography alone and digital mammography plus tomosynthesis in a population-based screening program. Radiology 2013;267(1):47–56. [DOI] [PubMed] [Google Scholar]
- 28.Wallis MG, Moa E, Zanca F, Leifland K, Danielsson M. Two-view and single-view tomosynthesis versus full-field digital mammography: high-resolution x-ray imaging observer study. Radiology 2012;262(3):788–796. [DOI] [PubMed] [Google Scholar]
- 29.Svahn TM, Houssami N. Digital breast tomosynthesis in one or two views as a replacement or adjunct technique to full-field digital mammography. Radiat Prot Dosimetry 2015;165(1-4):314–320. [DOI] [PubMed] [Google Scholar]
- 30.Bernardi D, Macaskill P, Pellegrini M, et al. Breast cancer screening with tomosynthesis (3D mammography) with acquired or synthetic 2D mammography compared with 2D mammography alone (STORM-2): a population-based prospective study. Lancet Oncol 2016;17(8):1105–1113. [DOI] [PubMed] [Google Scholar]
- 31.Skaane P, Sebuødegård S, Bandos AI, et al. Performance of breast cancer screening using digital breast tomosynthesis: results from the prospective population-based Oslo Tomosynthesis Screening Trial. Breast Cancer Res Treat 2018;169(3):489–496. [DOI] [PubMed] [Google Scholar]
- 32.Hofvind S, Hovda T, Holen ÅS, et al. Digital breast tomosynthesis and synthetic 2D mammography versus digital mammography: evaluation in a population-based screening program. Radiology 2018;287(3):787–794. [DOI] [PubMed] [Google Scholar]
- 33.Zuley ML, Guo B, Catullo VJ, et al. Comparison of two-dimensional synthesized mammograms versus original digital mammograms alone and in combination with tomosynthesis images. Radiology 2014;271(3):664–671. [DOI] [PMC free article] [PubMed] [Google Scholar]
- 34.Farrow JH. Current concepts in the detection and treatment of the earliest of the early breast cancers. Cancer 1970;25(2):468–477. [DOI] [PubMed] [Google Scholar]
- 35.Demetri-Lewis A, Slanetz PJ, Eisenberg RL. Breast calcifications: the focal group. AJR Am J Roentgenol 2012;198(4):W325–W343. [DOI] [PubMed] [Google Scholar]
- 36.Weigel S, Decker T, Korsching E, Hungermann D, Böcker W, Heindel W. Calcifications in digital mammographic screening: improvement of early detection of invasive breast cancers? Radiology 2010;255(3):738–745. [DOI] [PubMed] [Google Scholar]
- 37.Nyante SJ, Lee SS, Benefield TS, Hoots TN, Henderson LM. The association between mammographic calcifications and breast cancer prognostic factors in a population-based registry cohort. Cancer 2017;123(2):219–227. [DOI] [PMC free article] [PubMed] [Google Scholar]
- 38.Sickles E, D’Orsi CJ, Bassett LW, et al. ACR BI-RADS mammography. In: D’Orsi CJ, Sickles EA, Mendelson EB, Morris EA, eds. Breast imaging reporting and data system: ACR BI-RADS—breast imaging atlas. 5th ed. Reston, Va: American College of Radiology, 2013. [Google Scholar]
- 39.Friedewald SM. Breast tomosynthesis: practical considerations. Radiol Clin North Am 2017;55(3):493–502. [DOI] [PubMed] [Google Scholar]
- 40.Michaels AY, Birdwell RL, Chung CS, Frost EP, Giess CS. Assessment and management of challenging bi-rads category 3 mammographic lesions. RadioGraphics 2016;36(5):1261–1272. [DOI] [PubMed] [Google Scholar]
- 41.Lee KA, Talati N, Oudsema R, Steinberger S, Margolies LR. BI-RADS 3: current and future use of probably benign. Curr Radiol Rep 2018;6(2):5. [DOI] [PMC free article] [PubMed] [Google Scholar]
- 42.Michaels A, Chung CS, Birdwell RL, Frost EP, Giess CS. Imaging and histopathologic features of BI-RADS 3 lesions upgraded during imaging surveillance. Breast J 2017;23(1):10–16. [DOI] [PubMed] [Google Scholar]
- 43.Rominger M, Wisgickl C, Timmesfeld N. Breast microcalcifications as type descriptors to stratify risk of malignancy: a systematic review and meta-analysis of 10665 cases with special focus on round/punctate microcalcifications. Rofo 2012;184(12):1144–1152. [DOI] [PubMed] [Google Scholar]
- 44.Linda A, Zuiani C, Londero V, et al. Role of magnetic resonance imaging in probably benign (BI-RADS category 3) microcalcifications of the breast. Radiol Med (Torino) 2014;119(6):393–399. [DOI] [PubMed] [Google Scholar]
- 45.Zuckerman SP, Maidment ADA, Weinstein SP, McDonald ES, Conant EF. Imaging with synthesized 2D mammography: differences, advantages, and pitfalls compared with digital mammography. AJR Am J Roentgenol 2017;209(1):222–229. [DOI] [PubMed] [Google Scholar]
- 46.Freer PE, Winkler N. Synthesized digital mammography imaging. Radiol Clin North Am 2017;55(3):503–512. [DOI] [PubMed] [Google Scholar]
- 47.Durand MA. Synthesized mammography: clinical evidence, appearance, and implementation. Diagnostics (Basel) 2018;8(2):E22. [DOI] [PMC free article] [PubMed] [Google Scholar]
- 48.Sidky EY, Pan X, Reiser IS, Nishikawa RM, Moore RH, Kopans DB. Enhanced imaging of microcalcifications in digital breast tomosynthesis through improved image-reconstruction algorithms. Med Phys 2009;36(11): 4920–4932. [DOI] [PMC free article] [PubMed] [Google Scholar]
- 49.Tagliafico A, Mariscotti G, Durando M, et al. Characterisation of microcalcification clusters on 2D digital mammography (FFDM) and digital breast tomosynthesis (DBT): does DBT underestimate microcalcification clusters? Results of a multicentre study. Eur Radiol 2015;25(1):9–14. [DOI] [PubMed] [Google Scholar]
- 50.Teertstra HJ, Loo CE, van den Bosch MA, et al. Breast tomosynthesis in clinical practice: initial results. Eur Radiol 2010;20(1):16–24. [DOI] [PubMed] [Google Scholar]
- 51.Choi JS, Han BK, Ko EY, et al. Comparison between two-dimensional synthetic mammography reconstructed from digital breast tomosynthesis and full-field digital mammography for the detection of T1 breast cancer. Eur Radiol 2016;26(8):2538–2546. [DOI] [PubMed] [Google Scholar]
- 52.Hwang E, Szabo J, Sonnenblick EB, Margolies LR. Variable appearances of ductal carcinoma in situ calcifications on digital mammography, synthesized mammography, and tomosynthesis: a pictorial essay. Can Assoc Radiol J 2018;69(1):2–9. [DOI] [PubMed] [Google Scholar]
- 53.Nelson JS, Wells JR, Baker JA, Samei E. How does C-view image quality compare with conventional 2D FFDM? Med Phys 2016;43(5):2538–2547. [DOI] [PubMed] [Google Scholar]
- 54.Poplack SP, Tosteson TD, Kogel CA, Nagy HM. Digital breast tomosynthesis: initial experience in 98 women with abnormal digital screening mammography. AJR Am J Roentgenol 2007;189(3):616–623. [DOI] [PubMed] [Google Scholar]
- 55.Destounis SV, Arieno AL, Morgan RC. Preliminary clinical experience with digital breast tomosynthesis in the visualization of breast microcalcifications. J Clin Imaging Sci 2013;3(1):65. [DOI] [PMC free article] [PubMed] [Google Scholar]
- 56.Kopans D, Gavenonis S, Halpern E, Moore R. Calcifications in the breast and digital breast tomosynthesis. Breast J 2011;17(6):638–644. [DOI] [PubMed] [Google Scholar]
- 57.Svane G, Azavedo E, Lindman K, et al. Clinical experience of photon counting breast tomosynthesis: comparison with traditional mammography. Acta Radiol 2011;52(2):134–142. [DOI] [PubMed] [Google Scholar]
- 58.Schrading S, Distelmaier M, Dirrichs T, et al. Digital breast tomosynthesis–guided vacuum-assisted breast biopsy: initial experiences and comparison with prone stereotactic vacuum-assisted biopsy. Radiology 2015;274(3):654–662. [DOI] [PubMed] [Google Scholar]
- 59.Waldherr C, Berclaz G, Altermatt HJ, et al. Tomosynthesis-guided vacuum-assisted breast biopsy: a feasibility study. Eur Radiol 2016;26(6):1582–1589. [DOI] [PubMed] [Google Scholar]
- 60.Viala J, Gignier P, Perret B, et al. Stereotactic vacuum-assisted biopsies on a digital breast 3D-tomosynthesis system. Breast J 2013;19(1):4–9. [DOI] [PubMed] [Google Scholar]
- 61.ECOG-ACRIN Cancer Research Group . TMIST breast cancer screening trial. http://ecog-acrin.org/tmist. Published 2018. Accessed March 22, 2018.
- 62.Sechopoulos I. A review of breast tomosynthesis: part II— image reconstruction, processing and analysis, and advanced applications. Med Phys 2013;40(1):014302. [DOI] [PMC free article] [PubMed] [Google Scholar]
- 63.Calliste J, Wu G, Laganis PE, et al. Second generation stationary digital breast tomosynthesis system with faster scan time and wider angular span. Med Phys 2017;44(9):4482–4495. [DOI] [PMC free article] [PubMed] [Google Scholar]
- 64.Samala RK, Chan HP, Hadjiiski LM, Helvie MA. Analysis of computer-aided detection techniques and signal characteristics for clustered microcalcifications on digital mammography and digital breast tomosynthesis. Phys Med Biol 2016;61(19):7092–7112. [DOI] [PMC free article] [PubMed] [Google Scholar]
- 65.Samala RK, Chan HP, Hadjiiski L, Helvie MA, Wei J, Cha K. Mass detection in digital breast tomosynthesis: deep convolutional neural network with transfer learning from mammography. Med Phys 2016;43(12):6654–6666. [DOI] [PMC free article] [PubMed] [Google Scholar]
- 66.Balleyguier C, Arfi-Rouche J, Levy L, et al. Improving digital breast tomosynthesis reading time: a pilot multi-reader, multi-case study using concurrent computer-aided detection (CAD). Eur J Radiol 2017;97:83–89. [DOI] [PubMed] [Google Scholar]
- 67.Jeong JW, Chae SH, Chae EY, Kim HH, Choi YW, Lee S. Simplified computer-aided detection scheme of microcalcification clusters in digital breast tomosynthesis images. Conf Proc IEEE Eng Med Biol Soc 2016;2016:1070–1073. [DOI] [PubMed] [Google Scholar]
- 68.Sahiner B, Chan HP, Hadjiiski LM, et al. Computer-aided detection of clustered microcalcifications in digital breast tomosynthesis: a 3D approach. Med Phys 2012;39(1):28–39. [DOI] [PMC free article] [PubMed] [Google Scholar]
- 69.Chou CP, Lewin JM, Chiang CL, et al. Clinical evaluation of contrast-enhanced digital mammography and contrast enhanced tomosynthesis: comparison to contrast-enhanced breast MRI. Eur J Radiol 2015;84(12):2501–2508. [DOI] [PubMed] [Google Scholar]


