

Abstract
Background
Cachexia has significant impact on the patients' quality of life and prognosis. It is frequently observed in patients with cancer, especially in advanced stages, but prevalence data for the overall population are lacking. Good quality estimates of cancer cachexia in general and for each of the major cancer types would be highly relevant for potential treatment development efforts in this field. Both the USA and European Union (EU) have implemented special clinical development rules for such rare disorders what are called ‘orphan diseases’. The cut‐off level for a disease to be considered an orphan disease in the USA is 200 000 people (0.06% of the population) and EU is 5 per 10 000 people (0.05% of the population).
Methods
For this systematic review, we searched at PubMed (from inception to 31 January 2018) to identify clinical studies that assessed the prevalence of cachexia in cancer patients at risk. Studies reporting the prevalence of either cancer cachexia or wasting disease in the top‐10 cancer types and 4 other selected cancer types known to be particularly commonly complicated by cachexia were included in this analysis (i.e. prostate cancer, breast cancer, colorectal cancer, melanoma, endometrial cancer, thyroid cancer, urinary bladder cancer, non‐hodgkin lymphoma, lung cancer, kidney and renal pelvis cancer, head and neck cancer, gastric cancer, liver cancer, and pancreatic cancer). We calculated the current burden of cancer cachexia, disease by disease, in the USA and in the EU and compared them to the current guidelines for the definition of orphan disease status.
Results
We estimate that in 2014 in the USA, a total of 527 100 patients (16.5 subjects per 10 000 people of the total population), and in 2013 in the EU, a total of 800 300 patients (15.8 subjects per 10 000 people of the total population) suffered from cancer cachexia (of any kind). In the 14 separately analysed cancer types, the prevalence of cancer cachexia in the USA ranged between 11 300 (0.4/10 000, gastric cancer) and 92 000 patients (2.9/10 000, lung cancer) and in the EU between 14 300 (0.3/10 000, melanoma of the skin) and 150 100 (3.0/10 000, colorectal cancer).
Conclusions
The absolute number of patients affected by cancer cachexia in each cancer group is lower than the defined thresholds for orphan diseases in the USA and EU. Cancer cachexia in each subgroup separately should be considered an orphan disease.
Keywords: Cachexia, Orphan disease, Prevalence, Epidemiology, European Union, USA
Introduction
Cancer cachexia is a recognized problem in the clinical setting of patients suffering from malignant cancer. It is well known to be associated with increased mortality1 and decreased well‐being of patients.2 Therapies to stop or even reverse the loss of body weight and muscle mass—which are the hallmarks of cancer cachexia—are lacking3; hence, cancer cachexia is an area of unmet medical need and is hence of great research interest.4
What is less known is that the prevalence of cancer cachexia is relatively low in the general population, compared to common afflictions. This is very relevant for today's research efforts because both the USA and the European Union (EU) have implemented special clinical development rules for what are called ‘orphan diseases’. Thereby, both the USA and EU have promoted research into these fields and supported the development of new therapies for these relatively rare diseases. To our knowledge, published evidence has not been available examining whether cancer cachexia should be considered an orphan disease. Therefore, a significant discussion point in any such research context is the actual number of patients who might benefit from new treatment approaches. We therefore wish to address the question of whether cancer cachexia associated with various cancer types, complicating the major cancer subtypes prevalent in developed countries, could be classified as a collection of orphan diseases, based on the available evidence of the number of patients affected.
In the USA, with ca. 319 million inhabitants in 2014,5 any illness affecting less than 200 000 people is considered to be an orphan disease (as defined by the ‘rare disease act of 2002’).6 In the EU, presently consisting of 28 countries with ca. 505 million inhabitants in 2013,7 the limit to establish the presence of an orphan disease is 5 per 10 000 people (as defined by the European Medicines Agency)8—amounting to a cut‐off at 255 000 people for the EU as a whole.
Methods and results
The aim of this analysis was to estimate the number of patients currently suffering in the USA and EU from cachexia complicating both the common cancer types and other specific cancer types where cachexia is known to be a frequent complication. We therefore needed three variables: (i) the prevalence of each cancer type, (ii) the percentage of such patients that are at risk to develop cachexia, and (iii) the prevalence of cachexia in all patients at risk (Figure 1).
Figure 1.

Formula for estimating the number of patients suffering from cancer cachexia.
Prevalence of cancer entities
In oncologic research, most commonly the 5‐year prevalence is used to show the burden of different cancer entities. This is the number of patients who have developed any type of cancer in previous 5 years and who are still alive (at the time of assessment). At the same time, this number does not reveal whether the patient is still suffering from the condition or in fact has actually already been cured. Numbers for the total prevalence of individual cancer types (the proportion of the population with cancer at any time during their lifetime, or ‘lifetime prevalence’) are not published in EU, in an effort not to stigmatize patients that have been cured of cancer, but these data are available for the USA. These total prevalence data from the USA should be used with some caution, because an unknown proportion of these patients may have already been cured (or be in complete remission). To present the complete picture on both total and 5‐year prevalence for both regions, the latest available data for the USA from 2014 (Table 1, 9) were used to estimate the total prevalence estimates for the EU in 2013 in Table 2,9, 10 using the same ratios that were observed between 5‐year prevalence and total prevalence in the USA, based on the working assumption that expected total prevalence rates between these two populations would be similar. In both tables, we analysed the top‐10 cancer types with the highest prevalence overall and four additional cancer types that are known to be frequently associated with cancer cachexia, namely, head and neck cancer, gastric cancer, liver cancer, and pancreatic cancer. The resulting 14 cancer types selected for analysis represent about 85% of all cancer cases.
Table 1.
Prevalence of cancer cachexia in the USA (2014)
| USA (2014) | Prevalence of respective cancer | 5‐year prevalence of respective cancer | 5‐year survival rate (%) of respective cancer | Patients at risk to develop cachexia (%) | Patients at risk to develop cachexia (n) | Cancer cachexia prevalence in patients at risk (%) | Patients suffering from cancer cachexia in USA (2014) | Prevalence in USA per 10 000 people (2014) |
|---|---|---|---|---|---|---|---|---|
| (data as published) | (data as published) | (data as published) | (estimate) | (estimate) | (estimate) | (estimate) | (estimate) | |
| All cancer patients | 14 738 719 | 4 811 335 | 67 | 36.4 | 1 751 326 | 30.1 | 527 100 | 16.5 |
| Prostate cancer | 3 085 209 | 1 038 106 | 99 | 20 | 207 621 | 15.3 | 31 800 | 1.0 |
| Breast cancer | 3 346 387 | 992 786 | 91 | 30 | 297 836 | 23.5 | 70 000 | 2.2 |
| Colorectal cancer | 1 317 247 | 446 441 | 66 | 50 | 223 221 | 31.8 | 71 000 | 2.2 |
| Melanoma of the skin | 1 169 351 | 343 875 | 94 | 20 | 68 775 | 22.1 | 15 200 | 0.5 |
| Endometrial cancer | 710 228 | 219 407 | 83 | 40 | 87 763 | 32.2 | 28 300 | 0.9 |
| Thyroid cancer | 726 646 | 226 991 | 98 | 30 | 68 097 | 39.9 | 27 200 | 0.9 |
| Urinary bladder cancer | 696 440 | 258 861 | 78 | 30 | 77 658 | 25.2 | 19 600 | 0.6 |
| Non‐hodgkin lymphoma | 661 996 | 247 549 | 73 | 30 | 74 265 | 28.4 | 21 100 | 0.7 |
| Lung cancer | 527 228 | 309 108 | 20 | 80 | 247 286 | 37.2 | 92 000 | 2.9 |
| Kidney and renal pelvis cancer | 483 225 | 197 821 | 75 | 40 | 79 128 | 31.6 | 25 000 | 0.8 |
| Head and neck cancer | 446 816 | 172 669 | 66 | 70 | 120 868 | 42.3 | 51 100 | 1.6 |
| Gastric cancer | 95 764 | 48 271 | 31 | 70 | 33 790 | 33.3 | 11 00 | 0.4 |
| Liver cancer | 66 771 | 47 284 | 19 | 90 | 42 556 | 50.1 | 21 300 | 0.7 |
| Pancreatic cancer | 64 668 | 48 921 | 9 | 90 | 44 029 | 45.6 | 20 100 | 0.6 |
Table 2.
Prevalence of cancer cachexia in the European Union (2013)
| European Union (2013) | Prevalence of respective cancer | 5‐year prevalence of respective cancer | 5‐year survival rate (%) of respective cancer | Patients at risk to develop cachexia (%) | Patients at risk to develop cachexia (n) | Cancer cachexia prevalence in patients at risk (%) | Patients suffering from cancer cachexia in Europe (2013) | Prevalence in Europe per 10 000 people (2013) |
|---|---|---|---|---|---|---|---|---|
| (estimate) | (data as published) | (data as published) | (estimate) | (estimate) | (estimate) | (estimate) | (estimate) | |
| All cancer patients | 21 734 000 | 7 094 752 | 67 | 37.6 | 2 667 627 | 30.0 | 800 300 | 15.8 |
| Breast cancer | 4 831 000 | 1 433 147 | 91 | 30 | 429 944 | 23.5 | 101 000 | 2.0 |
| Prostate cancer | 3 774 000 | 1 269 716 | 99 | 20 | 253 943 | 15.3 | 38 900 | 0.8 |
| Colorectal cancer | 2 785 000 | 943 864 | 66 | 50 | 471 932 | 31.8 | 150 100 | 3.0 |
| Urinary bladder cancer | 1 103 000 | 409 811 | 78 | 30 | 122 943 | 25.2 | 31 000 | 0.6 |
| Melanoma of the skin | 1 100 000 | 323 467 | 94 | 20 | 64 693 | 22.1 | 14 300 | 0.3 |
| Endometrial cancer | 784 000 | 242 071 | 83 | 40 | 96 828 | 32.2 | 31 200 | 0.6 |
| Head and neck cancer | 749 000 | 289 272 | 66 | 70 | 202 490 | 42.3 | 85 700 | 1.7 |
| Kidney and renal pelvis cancer | 601 000 | 246 231 | 75 | 40 | 98 492 | 31.6 | 31 100 | 0.6 |
| Lung cancer | 573 000 | 336 143 | 20 | 80 | 268 914 | 37.2 | 100 000 | 2.0 |
| Non‐hodgkin lymphoma | 563 000 | 210 508 | 73 | 30 | 63 152 | 28.4 | 17 900 | 0.4 |
| Thyroid cancer | 469 000 | 146 631 | 98 | 30 | 43 989 | 39.9 | 17 600 | 0.3 |
| Gastric cancer | 234 000 | 117 782 | 31 | 70 | 82 447 | 33.3 | 27 500 | 0.5 |
| Liver cancer | 66 000 | 46 478 | 19 | 90 | 41 830 | 50.1 | 21 000 | 0.4 |
| Pancreatic cancer | 57 000 | 43 197 | 9 | 90 | 38 877 | 45.6 | 17 700 | 0.4 |
Of the two prevalence estimates, total and 5 years, the more relevant 5‐year prevalence of each cancer type was used in the calculations described below. The 5‐year prevalence represents the ongoing burden of each cancer in the USA and EU more accurately and is less influenced by patients who are often considered cured after 5 years of follow‐up. In simple terms, this methodology estimates the prevalence of each cancer type after exclusion of likely long‐term survivors, thereby more accurately defining the population most likely to be at risk of cachexia.
Prevalence of cachexia
For this systematic review, we searched in PubMed to identify clinical studies that assessed the prevalence of cachexia in at least 50 cancer patients at risk, considering articles from inception to 31 January 2018 (Figure 2). Our search algorithm was defined as ‘cachexia OR weight loss OR malnutrition AND (cancer OR prostate cancer OR breast cancer OR colorectal cancer OR melanoma OR endometrial cancer OR thyroid cancer OR urinary bladder cancer OR non‐hodgkin lymphoma OR lung cancer OR kidney and renal pelvis cancer OR head and neck cancer OR gastric cancer OR liver cancer OR pancreatic cancer) AND (frequency OR epidemiology OR prevalence OR estimate)’. We excluded all reviews, clinical trials, case reports, animal studies, studies in children aged <18 years, not published in English, less than 50 patients, lacking data on cachexia, or weight loss prevalence in specific cancer entities. Studies reporting the prevalence of either cachexia or wasting disease in any of the top‐10 most prevalent cancer types plus 4 other selected cancer types known to be particularly often complicated by cachexia were screened and included in this analysis. Senior colleagues were interviewed to find additional relevant papers in areas were few or no reports of interest could be identified.
Figure 2.
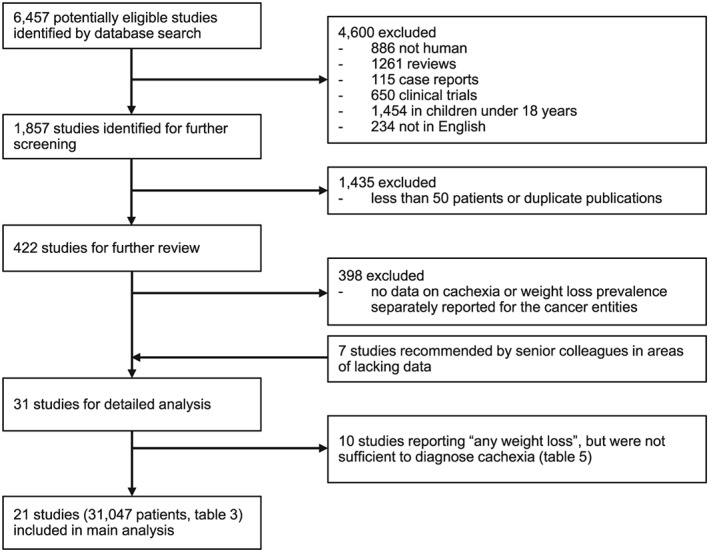
Flow diagram of the study selection process.
Altogether, we identified 21 studies published between 1980 and 2017 and reporting on 31 047 cancer patients as shown in Table 3.11, 12, 13, 14, 15, 16, 17, 18, 19, 20, 21, 22, 23, 24, 25, 26, 27, 28, 29, 30, 31 These studies provided acceptably reliable data for all of the 14 cancer entities selected for analysis. Depending on the diagnosis, results for 500 to 4900 patients were available. Only for melanoma were fewer patients reported upon, because cachexia in melanoma patients is rarely studied alone and is frequently reported only in a combined category with other less common cancer entities. The data found for melanoma patients were sufficient, however, for estimation purposes. The 21 studies each looked separately at one to nine cancer types. Studies that did not differentiate between different cancer types and their occurrence of cachexia were not considered for this analysis. It should be noted that the individual studies analysed had varying inclusion criteria for the diagnosis of cachexia ranging from weight loss of ≥1% to ≥10%. The consensus definition of cachexia by Evans et al.32 defined cachexia as a complex metabolic syndrome associated with the underlying illness. In alignment with the consensus definition, a weight loss of at least ≥5% is considered sufficient to diagnose cachexia. A low body mass index (<20 or <18.5) has also been used to define presence of cachexia, often in combination with weight loss of 2–5% or biochemical abnormalities.33 The data for the 31 047 patients shown in Table 3 originate in the USA, EU, Australia, Canada, and Asia and therefore represent, it is believed, a broad cross section of cancer experience appropriate to characterize the diverse populations in the USA and EU. The proportions of patients in advanced tumour stages or with metastatic disease were generally high in these studies (up to 100% metastatic disease). The frequency of cachexia ranged from 11–74%.
Table 3.
Prevalence of cancer cachexia in all analysed studies
| Cancer type | Criteria for cachexia diagnosis | Tumour stage | Patient age (years) | Study type | Date of study (years) | Number of patients | Cachexia frequency in patients (%) | Countries where data was developed | Reference |
|---|---|---|---|---|---|---|---|---|---|
| Liver cancer | WL>5% or BMI<20 and WL 2‐5% | 88% UICC III/IV | 63±13 | observational study | 2012‐14 | 25 | 36 | Italy | Muscaritoli et al.11 |
| Liver cancer | diagnosis, cachexia medication, WL≥5% | 40% metastatic | 64±12 | observational study | 1999‐2004 | 156 | 24 | USA | Fox et al.17 |
| Liver cancer | BMI<18.5, S‐Alb<2.8 g/dL, TLC<1200 cells/mm3 | 64% UICC III/IV | 30‐80 | observational study | 2004 | 1,497 | 53 | South Korea | Wie et al.31 |
| Pancreatic cancer | WL>5% or BMI<20 and WL 2‐5% | 86% UICC III/IV | 63±13 | observational study | 2012‐14 | 94 | 74 | Italy | Muscaritoli et al.11 |
| Pancreatic cancer | WL≥5% at time of operation | 40% UICC III/IV | 57‐70 | observational study | 2004‐05 | 227 | 41 | Germany | Bachmann et al.12 |
| Pancreatic cancer | diagnosis or BMI<20 and/or WL≥5% | not reported | 63±12 | observational study | 2002‐09 | 60 | 27 | Germany | Barkhudaryan et al.13 |
| Pancreatic cancer | WL≥5% in last six months | not reported | 30‐80 | observational study | 1976‐80 | 111 | 54 | USA | Dewys et al.16 |
| Pancreatic cancer | diagnosis, cachexia medication, WL≥5% | 40% metastatic | 64±12 | observational study | 1999‐2004 | 221 | 35 | USA | Fox et al.17 |
| Pancreatic cancer | BMI<18.5 + <75 yrs or BMI<21 + ≥75 yrs and/or WL>10% | 48% metastatic | 59±13 | observational study | 2013 | 42 | 67 | France | Hébuterne et al.19 |
| Lung cancer | WL>5% or BMI<20 and WL 2‐5% | 90% UICC III/IV | 63±13 | observational study | 2012‐14 | 312 | 43 | Italy | Muscaritoli et al.11 |
| Lung cancer | diagnosis or BMI<20 and/or WL≥5% | not reported | 63±12 | observational study | 2002‐09 | 58 | 34 | Germany | Barkhudaryan et al.13 |
| Lung cancer | diagnosis, cachexia medication, WL≥5% | 40% metastatic | 64±12 | observational study | 1999‐2004 | 1,294 | 31 | USA | Fox et al.17 |
| Lung cancer | BMI<18.5 + <75 yrs or BMI<21 + ≥75 yrs and/or WL>10% | 66% metastatic | 59±13 | observational study | 2013 | 247 | 45 | France | Hébuterne et al.19 |
| Lung cancer | WL>10% | 100% UICC III/IV | 43‐86 | observational study | 1991 | 100 | 39 | USA | Krech et al.24 |
| Lung cancer | WL≥10% | 81% metastatic | 59±14 | observational study | 2007‐08 | 90 | 30 | France | Pressoir et al.26 |
| Lung cancer | BMI<18.5, S‐Alb<2.8 g/dL, TLC<1200 cells/mm3 | 64% UICC III/IV | 30‐80 | observational study | 2004 | 1,802 | 41 | South Korea | Wie et al.31 |
| Lung cancer, non‐small cell | WL≥5% in last six months | not reported | 30‐80 | observational study | 1976‐80 | 590 | 36 | USA | Dewys et al.16 |
| Lung cancer, small cell | WL≥5% in last six months | not reported | 30‐80 | observational study | 1976‐80 | 436 | 34 | USA | Dewys et al.16 |
| Head and neck cancer | WL>5% or BMI<20 and WL 2‐5% | 81% UICC III/IV | 63±13 | observational study | 2012‐14 | 62 | 39 | Italy | Muscaritoli et al.11 |
| Head and neck cancer | diagnosis, cachexia medication, WL≥5% | 40% metastatic | 64±12 | observational study | 1999‐2004 | 249 | 37 | USA | Fox et al.17 |
| Head and neck cancer | BMI<18.5 + <75 yrs or BMI<21 + ≥75 yrs and/or WL>10% | 11% metastatic | 59±13 | observational study | 2013 | 366 | 49 | France | Hébuterne et al.19 |
| Head and neck cancer | WL≥10% | 24% metastatic | 59±14 | observational study | 2007‐08 | 179 | 37 | France | Pressoir et al.26 |
| Gastric cancer | WL>5% or BMI<20 and WL 2‐5% | 80% UICC III/IV | 63±13 | observational study | 2012‐14 | 108 | 69 | Italy | Muscaritoli et al.11 |
| Gastric cancer | WL≥5% in last six months | not reported | 30‐80 | observational study | 1976‐80 | 317 | 39 | USA | Dewys et al.16 |
| Gastric cancer | diagnosis, cachexia medication, WL≥5% | 40% metastatic | 64±12 | observational study | 1999‐2004 | 144 | 41 | USA | Fox et al.17 |
| Gastric cancer | BMI<18.5, S‐Alb<2.8 g/dL, TLC<1200 cells/mm3 | 64% UICC III/IV | 30‐80 | observational study | 2004 | 2,069 | 30 | South Korea | Wie et al.31 |
| Colorectal cancer | WL>5% or BMI<20 and WL 2‐5% | 80% UICC III/IV | 63±13 | observational study | 2012‐14 | 318 | 60 | Italy | Muscaritoli et al.11 |
| Colorectal cancer | diagnosis or BMI<20 and/or WL≥5% | not reported | 63±12 | observational study | 2002‐09 | 59 | 31 | Germany | Barkhudaryan et al.13 |
| Colorectal cancer | WL≥5% in last six months | not reported | 30‐80 | observational study | 1976‐80 | 307 | 28 | USA | Dewys et al.16 |
| Colorectal cancer | diagnosis, cachexia medication, WL≥5% | 40% metastatic | 64±12 | observational study | 1999‐2004 | 907 | 25 | USA | Fox et al.17 |
| Colorectal cancer | BMI<18.5 + <75 yrs or BMI<21 + ≥75 yrs and/or WL>10% | 69% metastatic | 59±13 | observational study | 2013 | 191 | 39 | France | Hébuterne et al.19 |
| Colorectal cancer | WL≥10% | 64% metastatic | 59±14 | observational study | 2007‐08 | 156 | 23 | France | Pressoir et al.26 |
| Colorectal cancer | BMI<18.5, S‐Alb<2.8 g/dL, TLC<1200 cells/mm3 | 64% UICC III/IV | 30‐80 | observational study | 2004 | 1,778 | 31 | South Korea | Wie et al.31 |
| Endometrial cancer | BMI<18.5 + <75 yrs or BMI<21 + ≥75 yrs and/or WL>10% | 57% metastatic | 59±13 | observational study | 2013 | 87 | 41 | France | Hébuterne et al.19 |
| Endometrial cancer | BMI<18.5 | 45% UICC III/IV | 53±12 | observational study | 2013 | 129 | 11 | South Korea | Nho et al. 25 |
| Endometrial cancer | WL≥10% | 61% metastatic | 59±14 | observational study | 2007‐08 | 137 | 28 | France | Pressoir et al.26 |
| Endometrial cancer | BMI<18.5, S‐Alb<2.8 g/dL, TLC<1200 cells/mm3 | 64% UICC III/IV | 30‐80 | observational study | 2004 | 927 | 35 | South Korea | Wie et al.31 |
| renal cell carcinoma | WL of >2.26 kg in the last 3 months, S‐Alb<3.6 g/dL, anorexia, or malaise | 43% metastatic | 30‐80 | observational study | 1989‐2001 | 1,046 | 35 | USA | Kim et al.22 |
| renal cell carcinoma | WL of >2.26 kg in the last 3 months, S‐Alb<3.6 g/dL, anorexia, or malaise | 0% UICC III/IV | 63±12 | observational study | 1989‐2001 | 250 | 15 | USA | Kim et al.23 |
| Urogenital cancer | WL>5% or BMI<20 and WL 2‐5% | 62% UICC III/IV | 63±13 | observational study | 2012‐14 | 346 | 30 | Italy | Muscaritoli et al.11 |
| Urogenital cancer | BMI≥28 and WL≥11% or BMI 20‐27.9 + WL ≥6% or BMI<20 | 85% metastatic | 57‐74 | observational study | 2011‐13 | 160 | 39 | EU, Australia, Canada | Vagnildhaug et al.30 |
| Urinary bladder cancer | BMI<18.5, S‐Alb<3.5 g/dL, or WL>5% | 44% UICC III/IV | 68±10 | observational study | 2000‐08 | 538 | 19 | USA | Gregg et al.18 |
| Urinary bladder cancer | S‐Alb<3.5 g/dL, or WL>5% | not reported | 66±10 | observational study | 1991‐2002 | 2,538 | 25 | USA | Hollenbeck et al.20 |
| Unfavorable Non‐Hodgkin Lymphoma | WL≥5% in last six months | not reported | 30‐80 | observational study | 1976‐80 | 311 | 28 | USA | Dewys et al.16 |
| Unfavorable Non‐Hodgkin Lymphoma | derived from muscle mass, albumin, neutrophils, lymphozytes | 63% advanced stage | 30‐80 | observational study | 1991‐2015 | 86 | 47 | USA | Karmali et al.21 |
| Favorable Non‐Hodgkin Lymphoma | WL≥5% in last six months | not reported | 30‐80 | observational study | 1976‐80 | 290 | 18 | USA | Dewys et al.16 |
| Leukemia, Lymphoma, Myeloma | WL≥10% | 16% metastatic | 59±14 | observational study | 2007‐08 | 156 | 25 | France | Pressoir et al.26 |
| Leukemia, Lymphoma | BMI<18.5 + <75 yrs or BMI<21 + ≥75 yrs and/or WL>10% | 37% metastatic | 59±13 | observational study | 2013 | 377 | 34 | France | Hébuterne et al.19 |
| Thyroid cancer | WL≥5% | 100% metastatic | 34‐77 | single‐arm phase II trial | 2008‐10 | 58 | 69 | USA | Cabanillas et al.15 |
| Thyroid cancer | WL≥5% | 96% metastatic | 41‐81 | single‐arm phase II trial | 2013‐15 | 25 | 60 | USA | Cabanillas et al.14 |
| Thyroid cancer | WL≥5% | 100% metastatic | 30‐80 | randomized, controlled trial | 2011‐12 | 392 | 34 | USA, EU, Asia, Australia | Schlumberger et al.27 |
| Thyroid cancer | WL≥5% | 100% metastatic | 22‐74 | single‐arm phase II trial | 2008‐10 | 59 | 42 | USA, EU, Australia | Schlumberger et al.28 |
| Breast cancer | WL>5% or BMI<20 and WL 2‐5% | 35% UICC III/IV | 63±13 | observational study | 2012‐14 | 431 | 14 | Italy | Muscaritoli et al.11 |
| Breast cancer | WL≥5% in last six months | not reported | 30‐80 | observational study | 1976‐80 | 289 | 14 | USA | Dewys et al.16 |
| Breast cancer | diagnosis, cachexia medication, WL≥5% | 40% metastatic | 64±12 | observational study | 1999‐2004 | 2,112 | 25 | USA | Fox et al.17 |
| Breast cancer | BMI<18.5 + <75 yrs or BMI<21 + ≥75 yrs and/or WL>10% | 45% metastatic | 59±13 | observational study | 2013 | 229 | 21 | France | Hébuterne et al.19 |
| Breast cancer | WL≥10% | 44% metastatic | 59±14 | observational study | 2007‐08 | 375 | 12 | France | Pressoir et al.26 |
| Breast cancer | BMI≥28 and WL≥11% or BMI 20‐27.9 + WL ≥6% or BMI<20 | 85% metastatic | 57‐74 | observational study | 2011‐13 | 252 | 24 | EU, Australia, Canada | Vagnildhaug et al.30 |
| Breast cancer | BMI<18.5, S‐Alb<2.8 g/dL, TLC<1200 cells/mm3 | 64% UICC III/IV | 30‐80 | observational study | 2004 | 877 | 33 | South Korea | Wie et al.31 |
| Melanoma | WL>10% | 100% UICC III/IV | 22‐59 | observational study | 1982 | 7 | 14 | Netherlands | Smit et al.29 |
| Melanoma, prostate and others* | WL≥10% | 51% metastatic | 59±14 | observational study | 2007‐08 | 349 | 19 | France | Pressoir et al.26 |
| melanoma, Haematologic cancer and others** | WL>5% or BMI<20 and WL 2‐5% | 52% UICC III/IV | 63±13 | observational study | 2012‐14 | 141 | 30 | Italy | Muscaritoli et al.11 |
| Prostate cancer | WL≥5% in last six months | not reported | 30‐80 | observational study | 1976‐80 | 78 | 28 | USA | Dewys et al.16 |
| Prostate cancer | diagnosis, cachexia medication, WL≥5% | 40% metastatic | 64±12 | observational study | 1999‐2004 | 3,351 | 15 | USA | Fox et al.17 |
| Prostate cancer | BMI<18.5 + <75 yrs or BMI<21 + ≥75 yrs and/or WL>10% | 38% metastatic | 59±13 | observational study | 2013 | 72 | 14 | France | Hébuterne et al.19 |
The average prevalence of cachexia in each cancer diagnosis was calculated by taking into account all patients with that diagnosis (Table 4). The data were not weighted based on the origin of patients (continent, country, etc.) and so, lacking a consensus standard for the diagnosis, represent a middle ground reflecting actual practice.
Table 4.
Frequency of cancer cachexia and of patients at risk to develop cachexia
| Cancer type (n, 5‐year survival rate) | Estimated cancer cachexia prevalence in patients at risk (%) | Patients at risk to develop cachexia (%) |
|---|---|---|
| Very high risk group—5‐year survival rate 0–30% | ||
| Liver cancer (1 678, 19%) | 50.1 | 90 |
| Pancreatic cancer (755, 9%) | 45.6 | 90 |
| Lung cancer (4 929, 20%) | 37.2 | 80 |
| High risk group—5‐year survival rate 31–66% | ||
| Head and neck cancer (856, 66%) | 42.3 | 70 |
| Gastric cancer (2 638, 31%) | 33.3 | 70 |
| Colorectal cancer (3 716, 66%) | 31.8 | 50 |
| Middle risk group—5‐year survival rate 67–90% | ||
| Endometrial cancer (1 280, 83%) | 32.2 | 40 |
| Kidney and renal pelvis cancer (1 549, 75%) | 31.6 | 40 |
| Non‐hodgkin lymphoma (1 220, 73%) | 28.4 | 30 |
| Urinary bladder cancer (3 329, 78%) | 25.2 | 30 |
| Lower risk group—5‐year survival rate 91–100% | ||
| Thyroid cancer (534, 98%) | 39.9 | 30 |
| Breast cancer (4 565, 91%) | 23.5 | 30 |
| Melanoma of the skin (<500, 94%) | 22.1 | 20 |
| Prostate cancer (3 501, 99%) | 15.3 | 20 |
During the literature research, we also found 10 clinical studies in 4312 patients that asked patients whether they ever lost any weight during the course of their disease. We are showing this data in Table 5, 34, 35, 36, 37, 38, 39, 40, 41, 42, 43 but did not include it in our analysis, because the inclusion criteria were not sufficient to diagnose cachexia.
Table 5.
Studies reporting weight loss ≥1% as a categorical variable(Note: Weight loss ≥1% without further details was not considered sufficient for the diagnosis of cachexia)
| Cancer type | Criteria for weight loss | Tumour stage | Patient age range (years) | Study type | Date of study (years) | Number of patients | Frequency of any weight loss in all patients (%) | Countries where data were developed | Reference |
|---|---|---|---|---|---|---|---|---|---|
| Endometrial cancer | any WL | 100% UICC III/IV | 30–80 | observational study | 1990–91 | 83 | 22 | EU, USA, Australia | Vainio et al.42 |
| Endometrial cancer | any WL | 100% UICC III/IV | 21–80 | observational study | 1981–83 | 74 | 84 | USA | Wachtel et al.43 |
| Breast cancer | any WL in last week | 63% metastatic | 23–86 | observational study | 1990–92 | 70 | 31 | USA | Portenoy et al.39 |
| Breast cancer | any WL | 100% UICC III/IV | 15–82 | observational study | 1992 | 44 | 88 | India | Sebastian et al.40 |
| Breast cancer | any WL | 100% UICC III/IV | 30–80 | observational study | 1990–91 | 186 | 22 | EU, USA, Australia | Vainio et al.42 |
| Breast cancer | any WL in last two weeks | 56% metastatic | 19–92 | observational study | 2001–02 | 101 | 28 | Spain | Segura et al.41 |
| Breast cancer | any WL | 100% UICC III/IV | 21–80 | observational study | 1981–83 | 127 | 78 | USA | Wachtel et al.43 |
| Colorectal cancer | any WL in last week | 63% metastatic | 23–86 | observational study | 1990–92 | 60 | 27 | USA | Portenoy et al.39 |
| Colorectal cancer | any WL | 100% UICC III/IV | 30–80 | observational study | 1990–91 | 127 | 53 | EU, USA, Australia | Vainio et al.42 |
| Colorectal cancer | any WL in last two weeks | 56% metastatic | 19–92 | observational study | 2001–02 | 103 | 32 | Spain | Segura et al.41 |
| Colorectal cancer | any WL | 100% UICC III/IV | 21–80 | observational study | 1981–83 | 148 | 81 | USA | Wachtel et al.43 |
| Colorectal cancer | any WL before commencing chemotherapy | 100% UICC III/IV | 16–84 | observational study | 1990–96 | 781 | 34 | UK | Andreyev et al.34 |
| Lung cancer | any WL | 100% UICC III/IV | 15–82 | observational study | 1992 | 10 | 80 | India | Sebastian et al.40 |
| Lung cancer | any WL | 100% UICC III/IV | 30–80 | observational study | 1990–91 | 387 | 49 | EU, USA, Australia | Vainio et al.42 |
| Lung cancer | any WL in last two weeks | 56% metastatic | 19–92 | observational study | 2001–02 | 179 | 36 | Spain | Segura et al.41 |
| Lung cancer | any WL | 100% UICC III/IV | 21–80 | observational study | 1981–83 | 288 | 83 | USA | Wachtel et al.43 |
| Prostate cancer | any WL in last week | 63% metastatic | 23–86 | observational study | 1990–92 | 63 | 25 | USA | Portenoy et al.39 |
| Prostate cancer | any WL | 100% UICC III/IV | 30–80 | observational study | 1990–91 | 78 | 26 | EU, USA, Australia | Vainio et al.42 |
| Prostate cancer | any WL | 100% UICC III/IV | 21–80 | observational study | 1981–83 | 73 | 86 | USA | Wachtel et al.43 |
| Lymphoma | any WL | 100% advanced stage | 30–80 | observational study | 1990–91 | 67 | 33 | EU, USA, Australia | Vainio et al.42 |
| Pancreatic cancer | any WL | 64% metastatic | 30–80 | observational study | 1990 | 39 | 51 | USA | Krech et al.37 |
| Pancreatic cancer | any WL | 100% UICC III/IV | 21–80 | observational study | 1981–83 | 63 | 89 | USA | Wachtel et al.43 |
| Pancreatic cancer | any WL before commencing chemotherapy | 100% UICC III/IV | 16–84 | observational study | 1990–96 | 162 | 72 | UK | Andreyev et al.34 |
| Head and neck cancer | any WL before commencing radiotherapy | not reported | 32–89 | observational study | 1989 | 100 | 57 | UK | Lees et al.38 |
| Head and neck cancer | any WL | 100% UICC III/IV | 15–82 | observational study | 1992 | 175 | 97 | India | Sebastian et al.40 |
| Head and neck cancer | any WL | 100% UICC III/IV | 30–80 | observational study | 1990–91 | 94 | 33 | EU, USA, Australia | Vainio et al.42 |
| Head and neck cancer | any WL | 100% UICC III/IV | 41–87 | observational study | 1990–93 | 38 | 79 | UK | Forbes et al.36 |
| Gastric cancer | any WL before commencing chemotherapy | 100% UICC III/IV | 16–84 | observational study | 1990–96 | 433 | 67 | UK | Andreyev et al.34 |
| Gastric cancer | any WL | 100% UICC III/IV | 30–80 | observational study | 1990–91 | 95 | 45 | EU, USA, Australia | Vainio et al.42 |
| Gastric cancer | any WL in last two weeks | 56% metastatic | 19–92 | observational study | 2001–02 | 34 | 50 | Spain | Segura et al.41 |
| Bladder cancer | any WL in the last 6 weeks | 53% UICC III/IV | 62 ± 7 | observational study | 1985 | 30 | 30 | Denmark | Enig et al.35 |
WL, weight loss; UICC, Union Internationale contre le Cancer tumor stage; USA, United States of America; UK, United Kingdom.
Patients at risk
For calculation of the patients at risk in each diagnosis, we categorized Table 4 into four groups of very high, high, middle, and lower risk of cancer cachexia by taking into account the respective 5‐year survival rates of the cancer entities. Based on prior clinical experience that the intensity and progression of the cancer disease process is directly related to metabolic disorders responsible for cachexia, it has been assumed that patients with lower 5‐year survival rates are more prone to develop cachexia, and therefore, they have been classified as having a higher risk for cachexia development.
Because the 5‐year prevalence for each cancer takes into account the cured and sick patients alike, we had to consider this in our analysis and therefore estimated the actual patients at risk to develop cachexia with the help of these four risk groups. To the very high‐risk group, we attributed that 80–90% of the patients are at risk, in the high‐risk group 50–70%, in the middle‐risk group 30–40%, and in the lower‐risk group 20–30% (Table 4). Within the four risk groups, we considered the prevalence of cachexia in the patients at risk and again the 5‐year survival rate. We were therefore able to weigh the data within these groups (Table 4). Consequently, in the very high‐risk group, pancreatic cancer patients had the lowest 5‐year survival rate and liver cancer the highest prevalence of cachexia in patients at risk. We therefore attributed to both diagnoses that 90% of patients are at risk. Lung cancer had a higher 5‐year survival rate and lower cachexia prevalence in patients at risk within this very high‐risk group, and so we attributed that 80% of the patients are at risk to develop cachexia. We did the same for the other risk groups as well (Table 4).
Number of patients with cancer cachexia
With the attained data, we were able to calculate the estimates for the numbers of cancer patients likely to be suffering from cancer cachexia in the USA (Table 1, Figure 3) and in the EU (Table 2, Figure 4). We estimate that in 2014, in the USA, 527 100 patients suffered from cancer cachexia (of any kind), equalling 16.5 subjects per 10 000 of the total population (USA inhabitants 2014: 318 622 5305). In 2013, in the EU, a total of 800 300 patients suffered from cancer cachexia (of any kind), equalling 15.8 subjects per 10 000 people of the general population (EU inhabitants 2013: 505 170 0007). For each specific cancer type, the absolute numbers of patients suffering of cachexia were lower than 200 000 patients in the USA, or less than 5 per 10 000 people in the EU, and for most types, substantially below those thresholds. Even if a high margin of error of ±30% is applied to the final results, cancer cachexia remains an orphan disease if each cancer type is considered separately, and this was true for all the specific cancer types studied. Given the wide variation in the risk of developing cachexia, we believe it is sensible to look at cancer‐specific cachexia rather than considering all cancer cachexia as a single disease.
Figure 3.
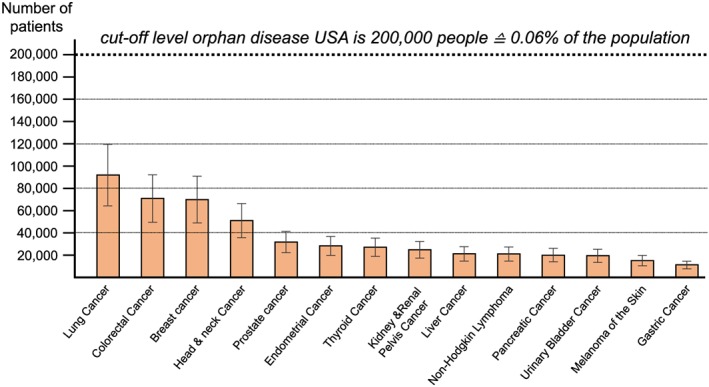
Prevalence of cancer cachexia in the USA (2014) with ±30% error bars to indicate the estimated uncertainty of the estimates.
Figure 4.

Prevalence of cancer cachexia in the European Union (2013) with ±30% error bars to indicate the estimated uncertainty of the estimates.
Discussion
The estimation of the prevalence of cachexia in cancer involves both epidemiological and clinical considerations, requiring both extensive research for current relevant data on multiple cancer types and the development of an approach to integrate that data into meaningful information. Those challenges may be responsible for the lack of published reports on the disease‐specific prevalence of cancer cachexia in the USA and EU populations.
Recently, Baracos et al.44 provided data on the prevalence of cachexia in eight cancer diagnoses considering information provided in two original studies with a total of about 3000 patients. In the present study, however, we used data from 21 original reports with a total of over 31 000 patients and assessed 14 cancer diagnoses—the 10 most frequent cancer diagnoses and another 4 cancer types that are frequently associated with cancer cachexia. Furthermore, we calculated the prevalence of cancer cachexia in the general population, giving one the chance to evaluate, whether individual disease related cancer cachexia syndromes should be considered orphan diseases in the USA or EU. We make the case that different cachexia disease types, potentially require individually targeted therapies. Currently, the National Cancer Institute identifies more than 200 different targeted drugs approved to treat over 100 separate cancer types separately.45
Cancer cachexia (in different cancers) is not one and the same general disease. Underlying pathophysiology, genetics, and biochemistry, but also symptoms and prognostic importance are different46—both in absolute terms and in their relative impact on disease progression and the patient burden—which is relevant for the development of novel treatment and prevention strategies. Research to this end is only in its infancy. Antecedent cancers are genomically distinct and have unique characteristics associated with the primary tissue affect, thus generally requiring individualized management efforts. Hence, it is reasonable that orphan disease status for cancer cachexia is assessed on the individual cancer type level and not for all cancer cachexia types together.
In the only available original research article on this issue, it has been estimated that cachexia is the immediate or primary cause of death in approximately 30% of cancer patients.47 Cancer cachexia is also associated with increased length of hospital stay as well as increased overall treatment costs.48 The possible ways how cachexia can cause death have been the subject of prior publications, which have concluded that in addition to cachexia interfering in the treatment of the cancer itself, it also acts as an indirect contributor to mortality.49 Future orphan treatments for cachexia might be divided into those that address symptoms and quality of life (palliative) and those that possibly impact mortality (directly addressing the life‐limiting disease).
Limitations
We only have access to summaries of research based on individual patient series, and we therefore had to base our analyses on these data as published. These have somewhat varying definitions of cachexia, so that there is inherent uncertainty around our prevalence estimates. We believe that these variations are likely to be less than 20% above or below our central estimate. Even though we included >30 000 patients in this analysis, which is more than ever shown before, the analysis summarizes only 21 studies, which is due to lack of attention of medicine and frustration about not being able to treat cachexia yet.
We used the 5‐year prevalence of each cancer type. This estimate is lower than the actual number of all people who ever had the cancer type and who still survive (by excluding those who have carried the diagnosis for more than 5 years). This may be thought to therefore slightly underestimate the prevalence of the respective cancer‐type‐specific cachexia, but the effect is likely to be small for two reasons.
Patients who have survived more than 5 years include those with cured cancer and those with very slowly progressing disease. These patients will have a lower rate of cachexia development than all comers for that particular cancer type.
The cancer patient who develops cachexia has a significantly worse survival than one who does not; therefore, the 5‐year prevalence data will have ‘lost’ some cachexia patients who have on average died earlier. This effect will therefore tend to overestimate the prevalence of cancer cachexia at any point in time, because we have used a constant risk of cachexia development for each cancer type whereas the 5‐year prevalence data for each cancer type contains an under‐representation of cachexia sufferers who have died and hence are no longer there to be counted in the 5‐year prevalence data.
For these reasons, we believe our estimates may actually overestimate rather than underestimate the prevalence of cancer‐type‐specific cachexia in the USA and in the EU and therefore the risk of misclassifying a condition as an orphan disease when it is not is low. We also make the point that although disease prevalence is used to define orphan disease status, a high mortality condition can have a large impact, because it can affect more patients when measured as disease incidence rather than prevalence. Thus, individual cancer cachexia may be considered low prevalence orphan diseases, but higher incidence high impact disorders, a combination of features that should make them very strong candidates for new prevention and treatment development efforts.
Conclusion
We conclude from this analysis that the absolute number of patients affected by cancer cachexia in each cancer group is lower than the defined thresholds in the USA and EU. Hence, cancer cachexia in each subgroup separately should be considered an orphan disease.
Funding
No external funding.
Conflict of Interest
M.M., W.H., A.J., F.S., and U.L. report no conflicts of interest. M.S.A. reports receiving personal fees from Servier. R.H. reports consultancy for bioAffinity, CranioVation, Erbe Medical, and iCAD. S.v.H. reports consultancy for Novartis, Helsinn, Bayer, Respicardia, Vifor Pharma, and Chugai. J.E.M. reports consultancy for Boehringer Ingelheim and Abbott nutrition. A.J.S.C. reports consultancy for Respicardia, Vifor, and Actimed Therapeutics. S.D.A. reports consultancy and/or speaking for Vifor International, Novartis, Servier, Helsinn, Bayer, Boehringer Ingelheim, and Actimed Therapeutics. S.D.A. reports grant support for clinical trials from Vifor International and Abbott. A.J.S.C. and S.D.A. report owning shares of Actimed Therapeutics.
Contributors
M.S.A., R.H., A.J.S.C., and S.D.A. designed the study, and all authors oversaw its implementation. M.S.A. did all review activities, including searches, study selection (including inclusion and exclusion of studies), data extraction, and data analysis. M.M. provided additional published and unpublished data. R.H. and S.D.A. supported data analysis. M.S.A. wrote the first draft, and all authors contributed to revising the manuscript. All authors reviewed the study findings and read and approved the final version before submission. The authors certify that they comply with the ethical guidelines for publishing in the Journal of Cachexia, Sarcopenia and Muscle: update 2017.50
Anker, M. S. , Holcomb, R. , Muscaritoli, M. , von Haehling, S. , Haverkamp, W. , Jatoi, A. , Morley, J. E. , Strasser, F. , Landmesser, U. , Coats, A. J. S. , and Anker, S. D. (2019) Orphan disease status of cancer cachexia in the USA and in the European Union: a systematic review. Journal of Cachexia, Sarcopenia and Muscle, 10: 22–34. 10.1002/jcsm.12402.
References
- 1. Kalantar‐Zadeh K, Rhee C, Sim JJ, Stenvinkel P, Anker SD, Kovesdy CP. Why cachexia kills: examining the causality of poor outcomes in wasting conditions. J Cachexia Sarcopenia Muscle 2013. Jun;4:89–94. [DOI] [PMC free article] [PubMed] [Google Scholar]
- 2. Ferraro CD, Grant M, Koczywas M, Dorr‐Uyemura LA. Management of anorexia‐cachexia in late stage lung cancer patients. J Hosp Palliat Nurs 2012;14. [DOI] [PMC free article] [PubMed] [Google Scholar]
- 3. Von Haehling S, Anker MS, Anker SD. Prevalence and clinical impact of cachexia in chronic illness in Europe, USA, and Japan: facts and numbers update 2016. J Cachexia Sarcopenia Muscle 2016;7:507–509. [DOI] [PMC free article] [PubMed] [Google Scholar]
- 4. Ebner N, von Haehling S. Unlocking the wasting enigma: highlights from the 8th cachexia conference. J Cachexia Sarcopenia Muscle 2016;7:90–94. [DOI] [PMC free article] [PubMed] [Google Scholar]
- 5. https://www.statista.com/statistics/183457/united‐states‐‐resident‐population/
- 6. https://www.gpo.gov/fdsys/pkg/PLAW‐107publ280/html/PLAW‐107publ280.htm
- 7. https://www.statista.com/statistics/253372/total‐population‐of‐the‐european‐union‐eu/
- 8. http://www.ema.europa.eu/ema/index.jsp?curl=pages/regulation/general/general_content_000029.jsp
- 9. Howlader N, Noone AM, Krapcho M, Miller D, Bishop K, Altekruse SF, et al. SEER Cancer Statistics Review, 1975‐2013, National Cancer Institute. Bethesda, MD, http://seer.cancer.gov/csr/1975_2013/, based on November 2015 SEER data submission, posted to the SEER web site, April 2016.
- 10. Bray F, Ren JS, Masuyer E, Ferlay J. Estimates of global cancer prevalence for 27 sites in the adult population in 2008. Int J Cancer 2013;132:1133–1145. [DOI] [PubMed] [Google Scholar]
- 11. Muscaritoli M, Lucia S, Farcomeni A, Lorusso V, Saracino V, Barone C, et al. Prevalence of malnutrition in patients at first medical oncology visit: the PreMiO study. Oncotarget 2017;8:79884, –96 and additional personal communication with the authors. [DOI] [PMC free article] [PubMed] [Google Scholar]
- 12. Bachmann J, Heiligensetzer M, Krakowski‐Roosen H, Büchler MW, Friess H, Martignoni ME. Cachexia worsens prognosis in patientswith resectable pancreatic cancer. J Gastrointest Surg 2008;12:1193–1201. [DOI] [PubMed] [Google Scholar]
- 13. Barkhudaryan A, Scherbakov N, Springer J, Doehner W. Cardiac muscle wasting in individuals with cancer cachexia. ESC Heart Fail 2017;4:458–467. [DOI] [PMC free article] [PubMed] [Google Scholar]
- 14. Cabanillas ME, de Souza JA, Geyer S, Wirth LJ, Menefee ME, Liu SV, et al. Cabozantinib as salvage therapy for patients with tyrosine kinase inhibitor‐refractory differentiated thyroid cancer: results of a multicenter Phase II International Thyroid Oncology Group Trial. J Clin Oncol 2017;35:3315–3321. [DOI] [PMC free article] [PubMed] [Google Scholar]
- 15. Cabanillas ME, Schlumberger M, Jarzab B, Martins RG, Pacini F, Robinson B, et al. A phase 2 trial of lenvatinib (E7080) in advanced, progressive, radioiodine‐refractory, differentiated thyroid cancer: a clinical outcomes and biomarker assessment. Cancer 2015;121:2749–2756. [DOI] [PMC free article] [PubMed] [Google Scholar]
- 16. Dewys WD, Begg C, Lavin PT, Band PR, Bennett JM, Bertino JR, et al. Prognostic effect of weight loss prior to chemotherapy in cancer patients. Eastern Cooperative Oncology Group. Am J Med 1980;69:491–497. [DOI] [PubMed] [Google Scholar]
- 17. Fox KM, Brooks JM, Gandra SR, Markus R, Chiou CF. Estimation of cachexia among cancer patients based on four definitions. J Oncol 2009;2009. [DOI] [PMC free article] [PubMed] [Google Scholar]
- 18. Gregg JR, Cookson MS, Phillips S, Salem S, Chang SS, Clark PE, et al. Effect of preoperative nutritional deficiency on mortality after radical cystectomy for bladder cancer. J Urol 2011;185:90–96. [DOI] [PMC free article] [PubMed] [Google Scholar]
- 19. Hébuterne X, Lemarié E, Michallet M, de Montreuil CB, Schneider SM, Goldwasser F. Prevalence of malnutrition and current use of nutrition support in patients with cancer. JPEN J Parenter Enteral Nutr 2014;38:196–204. [DOI] [PubMed] [Google Scholar]
- 20. Hollenbeck BK, Miller DC, Taub DA, Dunn RL, Khuri SF, Henderson WG, et al. The effects of adjusting for case mix on mortality and length of stay following radical cystectomy. J Urol 2006;176:1363–1368. [DOI] [PubMed] [Google Scholar]
- 21. Karmali R, Alrifai T, Fughhi IAM, Ng R, Chukkapalli V, Shah P, et al. Impact of cachexia on outcomes in aggressive lymphomas. Ann Hematol 2017;96:951–956. [DOI] [PubMed] [Google Scholar]
- 22. Kim HL, Belldegrun AS, Freitas DG, Bui MH, Han KR, Dorey FJ, et al. Paraneoplastic signs and symptoms of renal cell carcinoma: implications for prognosis. J Urol 2003;170:1742–1746. [DOI] [PubMed] [Google Scholar]
- 23. Kim HL, Han KR, Zisman A, Figlin RA, Belldegrun AS. Cachexia‐like symptoms predict a worse prognosis in localized t1 renal cell carcinoma. J Urol 2004;171:1810–1813. [DOI] [PubMed] [Google Scholar]
- 24. Krech RL, Davis J, Walsh D, Curtis EB. Symptoms of lung cancer. Palliat Med 1992;6:309–315. [Google Scholar]
- 25. Nho JH, Kim SR, Kwon YS. Depression and appetite: predictors of malnutrition in gynecologic cancer. Support Care Cancer 2014;22:3081–3088. [DOI] [PubMed] [Google Scholar]
- 26. Pressoir M, Desné S, Berchery D, Rossignol G, Poiree B, Meslier M, et al. Prevalence, risk factors and clinical implications of malnutrition in French Comprehensive Cancer Centres. Br J Cancer 2010;102:966–971. [DOI] [PMC free article] [PubMed] [Google Scholar]
- 27. Schlumberger M, Tahara M, Wirth LJ, Robinson B, Brose MS, Elisei R, et al. Lenvatinib versus placebo in radioiodine‐refractory thyroid cancer. N Engl J Med 2015;372:621–630. [DOI] [PubMed] [Google Scholar]
- 28. Schlumberger M, Jarzab B, Cabanillas ME, Robinson B, Pacini F, Ball DW, et al. A phase ii trial of the multitargeted tyrosine kinase inhibitor lenvatinib (E7080) in advanced medullary thyroid cancer. Clin Cancer Res 2016;22:44–53. [DOI] [PubMed] [Google Scholar]
- 29. Smit JM, Mulder NH, Sleijfer DT, Bouman JG, Veeger W, Schraffordt Koops H. The effect of continuous enteral tube feeding on various nutritional parameters in patients with disseminated malignant melanoma during intensive chemotherapy. Clin Nutr 1983;1:335–341. [DOI] [PubMed] [Google Scholar]
- 30. Vagnildhaug OM, Blum D, Wilcock A, Fayers P, Strasser F, Baracos VE, et al. European Palliative Care Cancer Symptom study group. The applicability of a weight loss grading system in cancer cachexia: a longitudinal analysis. J Cachexia Sarcopenia Muscle 2017;8:789–797. [DOI] [PMC free article] [PubMed] [Google Scholar]
- 31. Wie GA, Cho YA, Kim SY, Kim SM, Bae JM, Joung H. Prevalence and risk factors of malnutrition among cancer patients according to tumor location and stage in the National Cancer Center in Korea. Nutrition 2010;26:263–268. [DOI] [PubMed] [Google Scholar]
- 32. Evans WJ, Morley JE, Argilés J, Bales C, Baracos V, Guttridge D, et al. Cachexia: a new definition. Clin Nutr 2008;27:793–799. [DOI] [PubMed] [Google Scholar]
- 33. Fearon K, Strasser F, Anker SD, Bosaeus I, Bruera E, Fainsinger RL, et al. Definition and classification of cancer cachexia: an international consensus. Lancet Oncol 2011;12:489–495. [DOI] [PubMed] [Google Scholar]
- 34. Andreyev HJ, Norman AR, Oates J, Cunningham D. Why do patients with weight loss have worse outcome when undergoing chemotherapy for gastrointestinal malignancies? Eur J Cancer 1998;34:503–509. [DOI] [PubMed] [Google Scholar]
- 35. Enig B, Winther E, Hessov I. Nutritional status of patients with cancer of the bladder before and during radiation therapy. Influence on survival? Radiother Oncol 1986;5:277–285. [DOI] [PubMed] [Google Scholar]
- 36. Forbes K. Palliative care in patients with cancer of the head and neck. Clin Otolaryngol Allied Sci 1997;22:117–122. [DOI] [PubMed] [Google Scholar]
- 37. Krech RL, Walsh D. Symptoms of pancreatic cancer. J Pain Symptom Manage 1991;6:360–367. [DOI] [PubMed] [Google Scholar]
- 38. Lees J. Incidence of weight loss in head and neck cancer patients on commencing radiotherapy treatment at a regional oncology centre. Eur J Cancer Care (Engl) 1999;8:133–136. [DOI] [PubMed] [Google Scholar]
- 39. Portenoy RK, Thaler HT, Kornblith AB, Lepore JM, Friedlander‐Klar H, Coyle N, et al. Symptom prevalence, characteristics and distress in a cancer population. Qual Life Res 1994;3:183–189. [DOI] [PubMed] [Google Scholar]
- 40. Sebastian P, Varghese C, Sankaranarayanan R, Zaina CP, Nirmala G, Jeevy G, et al. Evaluation of symptomatology in planning palliative care. Palliat Med 1993;7:27–34. [DOI] [PubMed] [Google Scholar]
- 41. Segura A, Pardo J, Jara C, Zugazabeitia L, Carulla J, de Las Peñas R, et al. An epidemiological evaluation of the prevalence of malnutrition in Spanish patients with locally advanced or metastatic cancer. Clin Nutr 2005;24:801–814. [DOI] [PubMed] [Google Scholar]
- 42. Vainio A, Auvinen A. Prevalence of symptoms among patients with advanced cancer: an international collaborative study. Symptom Prevalence Group J Pain Symptom Manage 1996;12:3–10. [DOI] [PubMed] [Google Scholar]
- 43. Wachtel T, Allen‐Masterson S, Reuben D, Goldberg R, Mor V. The end stage cancer patient: terminal common pathway. Hosp J 1988;4:43–80. [DOI] [PubMed] [Google Scholar]
- 44. Baracos VE, Martin L, Korc M, Guttridge DC, Fearon KCH. Cancer‐associated cachexia. Nat Rev Dis Primers 2018;4:17105. [DOI] [PubMed] [Google Scholar]
- 45. https://www.cancer.gov/about‐cancer/treatment/drugs/cancer‐type
- 46. Muscaritoli M, Molfino A, Lucia S, Rossi Fanelli F. Cachexia: a preventable comorbidity of cancer. A T.A.R.G.E.T. approach. Crit Rev Oncol Hematol 2015;94:251–259. [DOI] [PubMed] [Google Scholar]
- 47. Warren S. The immediate causes of cancer. Am J Med Sci Nov1932. [Google Scholar]
- 48. Arthur ST, Noone JM, Van Doren BA, Roy D, Blanchette CM. One‐year prevalence, comorbidities and cost of cachexia‐related inpatient admissions in the USA. Drugs Context 2014;3:212265. [DOI] [PMC free article] [PubMed] [Google Scholar]
- 49. Inui A. Cancer anorexia‐cachexia syndrome: current issues in research and management. CA Cancer J Clin 2002;52:72–91. [DOI] [PubMed] [Google Scholar]
- 50. von Haehling S, Morley JE, Coats AJS, Anker SD. Ethical guidelines for publishing in the Journal of Cachexia, Sarcopenia and Muscle: update 2017. J Cachexia Sarcopenia Muscle 2017;8:1081–1083. [DOI] [PMC free article] [PubMed] [Google Scholar]