Abstract
In a variety of cancer cell types, the pharmacological and genetic blockade of autophagy increases apoptosis induced by various anticancer drugs. These observations suggest that autophagy counteracts drug-induced apoptosis. We previously reported that in human melanoma and osteosarcoma cells, autophagy inhibitors, such as 3-methyladenine and chloroquine increased the sensitivity to apoptosis induced by tumor necrosis factor-related apoptosis-inducing ligand (TRAIL). In the present study, we report that different autophagy inhibitors regulate the mitochondrial network and calcium (Ca2+) dynamics in these cells. We found that compared to tumor cells, normal fibroblasts were more resistant to the cytotoxicity of TRAIL and autophagy inhibitors used either alone or in combination. Notably, TRAIL increased the autophagic flux in the tumor cells, but not in the fibroblasts. Live-cell imaging revealed that in tumor cells, TRAIL evoked modest mitochondrial fragmentation, while subtoxic concentrations of the autophagy inhibitors led to mitochondrial fusion. Co-treatment with TRAIL and subtoxic concentrations of the autophagy inhibitors resulted in severe mitochondrial fragmentation, swelling and clustering, similar to what was observed with autophagy inhibitors at toxic concentrations. The enhanced aberration of the mitochondrial network was preceded by a reduction in mitochondrial Ca2+ loading and store-operated Ca2+ entry. On the whole, the findings of this study indicate that co-treatment with TRAIL and autophagy inhibitors leads to increased mitochondrial Ca2+ and network dysfunction in a tumor-selective manner. Therefore, the co-administration of TRAIL and autophagy inhibitors may prove to be a promising tumor-targeting approach for the treatment of TRAIL-resistant cancer cells.
Keywords: TRAIL, autophagy, apoptosis, mitochondria, calcium
Introduction
Tumor necrosis factor-related apoptosis-inducing ligand (TRAIL) is a promising anticancer drug as it can induce apoptosis in a tumor-selective manner by binding to two different death receptors (DRs), DR4 and DR5 (1–7). However, clinical trials have revealed that aggressive cancer cell types, such as malignant melanoma (MM) and osteosarcoma (OS) are highly resistant to TRAIL treatment (8,9). These cancer types are entirely insensitive to TRAIL despite expressing DRs and acquire considerable tolerance to TRAIL during prolonged treatment (7–11). Accordingly, co-treatment with drugs that can reduce this resistance is necessary for TRAIL to be effective in the TRAIL treatment of these cancer types.
Autophagy is a primary catabolic process that degrades cellular components and damaged organelles. There are three different types of autophagy: Macroautophagy (referred as autophagy hereafter), microautophagy (autophagy of organelles) and chaperone-mediated autophagy. The process of autophagy involves numerous complex steps, including the induction of a double-layered membranes (phagophore) in the cytoplasm, its elongation leading to autophagosome formation, the fusion of autophagosomes with lysosomes, and the degradation of the autophagosomal contents, which are recycled back to the cytoplasm for reuse (12–14). All these events, beginning from the formation of autophagosomes to the degradation of cellular components, are strictly controlled by autophagy-related (Atg) genes (13). Autophagy copes with cellular stress, such as starvation, and supplies energy and metabolic precursors. It is negatively regulated by the mammalian target of rapamycin complex I (mTORC1) in response to insulin and amino acid signals. During nutrient deprivation, this negative regulation by mTORC1 is alleviated, resulting in the induction of autophagy (14-16). Accordingly, autophagy may be particularly critical for the survival of cancer cells by satisfying high energy demands and by removing damaged organelles (17,18). Conversely, when activated intensively and persistently, autophagy leads to the activation of a unique death pathway, known as autophagic cell death, which has been implicated to act as a tumor suppressor (19–21). Numerous studies have demonstrated that autophagy contributes to cancer cell survival and resistance to different types of anticancer drugs, including TRAIL, temozolomide, epirubicin and sorafenib (22–28). Previously, we observed that a massive, ambient autophagic flux in human MM and OS cells occurred even under nutritional and stress-free conditions; moreover, pharmacological inhibitors of autophagy, such as 3-methyladenine (3-MA) and chloroquine (CQ) enhanced sensitivity to TRAIL-induced apoptosis (29). These observations suggest that protective autophagy contributes to the resistance to TRAIL in these cells yet the precise mechanisms are unclear.
Mitochondria are highly dynamic organelles which alter their shape and mass to cope with the energy demands and needs of the cell. They have a tubular network organization that is regulated by the balance between fission and fusion of the mitochondrial membrane. Mitochondrial network homeostasis, i.e., well-balanced fission and fusion, is essential for cell function and survival (30,31). Since fission helps to eliminate damaged mitochondria through mitophagy (32), its defects lead to a highly interconnected and collapsed mitochondrial network and to the dysfunction of mitochondrial quality control. On the other hand, mitochondrial fusion facilitates the exchange of mitochondrial DNA and metabolites required for mitochondrial function. Accordingly, defects in mitochondrial fusion lead to intensive mitochondrial fragmentation, the loss of mitochondrial DNA, a reduction in growth, mitochondrial membrane potential (ΔΨm) and respiration (33,34). Hence, mitochondrial network dynamics has emerged as a potent target for cancer treatment (35,36). We have previously demonstrated that in MM and OS cells, mitochondrial network dynamics play a vital role in the regulation of TRAIL-induced toxicity (37,38). The mitochondrial division inhibitor-1 (Mdivi-1) and the knockdown of dynamin-related protein 1 (Drp1) inhibit mitochondrial fission, thereby increasing mitochondrial fusion and sensitivity to TRAIL-induced apoptosis. The effect is associated with increased multiple pro-apoptotic events, including plasma membrane depolarization, mitochondrial reactive oxygen species (ROS) accumulation, ΔΨm collapse and caspase-3/7 activation (37). Notably, similar to TRAIL, Mdivi-1 targets the mitochondrial network dynamics in a tumor-selective manner (37). We have also previously demonstrated that the modulation of calcium (Ca2+) dynamics plays a vital role in the effects of TRAIL (39,40).
In the present study, we investigated the possible contribution of the mitochondrial network and Ca2+ dynamics in sensitization to TRAIL by autophagy inhibitors. Herein, we report that autophagy inhibitors can facilitate the dysregulation of the mitochondrial network and mitochondrial Ca2+ dynamics mediated by TRAIL.
Materials and methods
Materials
All chemicals were purchased from Sigma-Aldrich Japan (Tokyo, Japan) unless otherwise specified. Soluble recombinant human TRAIL was obtained from Enzo Life Sciences (San Diego, CA, USA). Agonistic anti-human TRAIL-R2/TNFRSF10B antibody (αDR5, clone 71903; cat. no. MAB631-100) was purchased from R&D Systems (Minneapolis, MN, USA). The pan-caspase inhibitor, Z-VAD-FMK, was purchased from Merck Japan (Tokyo, Japan). All insoluble reagents were dissolved in dimethylsulfoxide (DMSO) and diluted with high glucose-containing Dulbecco's modified Eagle's medium (DMEM) supplemented with 10% fetal bovine serum (FBS) (both from Sigma-Aldrich Japan) or Hank's balanced salt solution (HBSS; pH 7.4; Nissui Pharmaceutical Co., Ltd., Tokyo, Japan) (final DMSO concentration, <0.1%) prior to use.
Cell culture
The human A375 MM cell line (ATCC® cell number CRL-1619) was obtained from the American Type Culture Collection (ATCC, Manassas, VA, USA). The A2058 MM cell line (cell number IFO 50276) and WI-38 human lung fibroblasts (JCRB9017) were purchased from the JCRB Cell Bank of National Institutes of Biomedical Innovation, Health, and Nutrition (Osaka, Japan). The human HOS (cell number RCB0992) and SaOS-2 (RCB0428) OS cell lines were obtained from the Riken BioResource Center (Tsukuba, Japan). Human dermal fibroblasts (HDFs) from facial dermis were obtained from Cell Applications (San Diego, CA, USA). All cells were cultured in 10% FBS/DMEM supplemented with 100 U/ml penicillin and 100 µg/ml streptomycin (Thermo Fisher Scientific, Inc., Waltham, MA, USA) in a 95% air/5% CO2 humidified atmosphere at 37°C. The cells were harvested by incubation with 0.25% trypsin-EDTA (Thermo Fisher Scientific) for 5 min at 37°C.
Cell viability assay
Cell viability was measured by WST-8 assay using Cell Counting Reagent SF (Nacalai Tesque, Inc., Kyoto, Japan) as previously described (40) with modifications. This method is a colorimetric assay based on the formation of a water-soluble formazan product. Briefly, the cells were seeded at a density of 8×10³ cells/well in 96-well plates (Corning Inc., Corning, NY, USA) and cultured with agents to be tested for 24 or 72 h at 37°C prior to the addition of 10 µl of cell counting reagent SF and further incubation for 2 h. The absorbance was measured at 450 nm using an ARVO MX microplate reader (PerkinElmer Japan Co., Ltd., Yokohama, Japan).
Live/dead cell assay
Overall cell death was evaluated by fluorescent microscopy as previously described (41) with modifications. Briefly, the cells were cultured on an 8-well imaging chamber (Imaging Chamber 8 CG; Zell-Kontakt GmbH, Nörten-Hardenberg, Germany) and treated with the agents to be tested for 24 h at 37°C. Subsequently, the cells were stained with 4 µM each of calcein-AM and ethidium bromide homodimer-1 (EthD-1) to label live cells in green and dead cells in red, respectively using a commercially available kit (Live/Dead Viability/Cytotoxicity kit; Invitrogen/Thermo Fisher Scientific) according to the manufacturer's instructions. Images were obtained using a BZ X-700 fluorescence microscope (Keyence Corp., Osaka, Japan) equipped with a 40×, 0.60 numerical aperture (NA) LUCPlanFL N objective (Olympus, Tokyo, Japan) and analyzed using BZ-H3A application software (Keyence Corp.).
Mitochondria network and autophagosome imaging
The mitochondrial network in live cells was analyzed as previously described (38) with minor modifications. Briefly, adherent cells (5.6×10⁴ cells/well) cultured in FBS/DMEM on an 8-well imaging chamber were treated with agents to be tested and incubated for 24 h in 95% air/5% CO2 humidified atmosphere at 37°C. After removing the medium by aspiration, the cells were washed with fresh FBS/DMEM and stained with 20 nM MitoTracker Red CMXRos for 1 h at 37°C in the dark. The nuclei were counterstained with Hoechst 33342 (Sigma-Aldrich). The cells were then washed with and immersed in FluoroBrite™ DMEM (Thermo Fisher Scientific, Inc.). Images were obtained using the BZ X-700 fluorescence microscope equipped with a 100×, 1.40 NA UPlanSApo Super-Apochromat, coverslip-corrected oil objective (Olympus) and analyzed as described above. For each sample, the morphology of the mitochondria in 20–50 cells was analyzed, and the percentages of 4 different types of morphology, i.e., tubular, fission, fragmentation, and swelling and clustering were calculated. The formation of autophagosomes was analyzed using the CYTO-ID® Autophagy Detection kit (Enzo Life Sciences) according to the manufacturer's instructions. Briefly, the cells were stained with CYTO-ID for 1 h at 37°C in the dark and treated with the agents to be tested as described above. Images were obtained using the EVOS FL Cell Imaging System (Life Technologies Japan, Tokyo, Japan) and analyzed using the freely available ImageJ software from the National Institutes of Health (NIH) (bundled with 64-bit Java 1.8.0_112; NIH, Bethesda, MD, USA) as previously described (37).
Western blot analysis
The expression of LC3-II was examined by western blot analysis previously described (29) with minor modifications. Briefly, following stimulation with the agents to be tested, the cells were washed, lysed with RIPA buffer containing protease inhibitor and phosphatase inhibitor cocktail (both from Sigma-Aldrich), and homogenized by sonication. Samples (20 µg protein) were subjected to reducing sodium dodecyl sulfate-polyacrylamide gel electrophoresis using a 4–12% gradient separation gel and transferred onto polyvinylidene difluoride membranes (both from Thermo Fisher Scientific, Inc.). The blots were blocked with Blocking One (Nacalai Tesque Inc.) for 1 h at 22–25 °C, washed with TBS containing 0.05% Tween-20 (TBS-T), and incubated with primary antibody against LC3-I/II (#12741, 1:1,000; Medical & Biological Laboratory, Nagoya, Japan) and GAPDH (#5174, 1:1,000; Cell Signaling Technology Japan, Tokyo, Japan) overnight at 4°C in TBS-T containing Blocking One. After washing with TBS-T, the blots were incubated with the secondary antibody (ECL™ Anti-rabbit IgG, horseradish peroxidase-linked whole antibody from a donkey; GE Healthcare, Little Chalfont, UK) diluted (1:10,000) in TBS-T for 1 h at 22–25°C. The signals were visualized using the ECL Prime Western Blotting Detection Reagent (GE Healthcare) and analyzed using a Luminescent Image Analyzer LAS-4000 (Fuji Film, Tokyo, Japan).
Calcium (Ca2+) measurements
Changes in the cytosolic Ca2+ concentration ([Ca2+]cyt) and mitochondrial Ca2+ concentration ([Ca2+]mit) were measured using Fluo 4-AM and rhod 2-AM (Dojindo Kumamoto, Japan), respectively as previously described (39,40). For the improvement of the mitochondrial localization of rhod 2-AM, it was reduced to the colorless, non-fluorescent dihydrorhod 2-AM by sodium borohydride, according to the manufacturer's instructions. Cells were loaded with 4 µM each of Fluo 4-AM or dihydrorhod 2-AM for 40 min at 37°C, and washed with HBSS. Subsequently, the cells (1×10⁶/ml) were resuspended in HBSS in 96-well plates. The cells were manually added along with the agents to be tested. The cells were then measured for fluorescence using a microplate reader (Fluoroskan Ascent; Thermo Fisher Scientific, Inc.) with excitation and emission at 485 and 538 nm (for Fluo 4-AM) and 542 and 592 nm (for rhod 2-AM), respectively. For the analyses of Ca2+ release and SOCE, Fluo4-AM-loaded cells were suspended in a Ca2+-free medium (HBSS supplemented with 1 mM EGTA) and treated with 1 µM thapsigargin (Tg) for 10 min and 2 mM CaCl2 was then added. For the analysis of non-SOCE, the cells in the Ca2+-free medium was treated with medium for 10 min and 2 mM CaCl2 was then added. The fluorescence was measured as described above with excitation and emission at 485 and 538 nm.
Statistical analysis
Data are presented as the means ± standard deviation. Data were analyzed by one-way analysis of variance followed by the Tukey's post hoc test using add-in software for Excel 2016 for Windows (SSRI, Tokyo, Japan). A value of P<0.05 was considered to indicate a statistically significant difference.
Results
Autophagy inhibitors increase TRAIL sensitivity in MM and OS cells
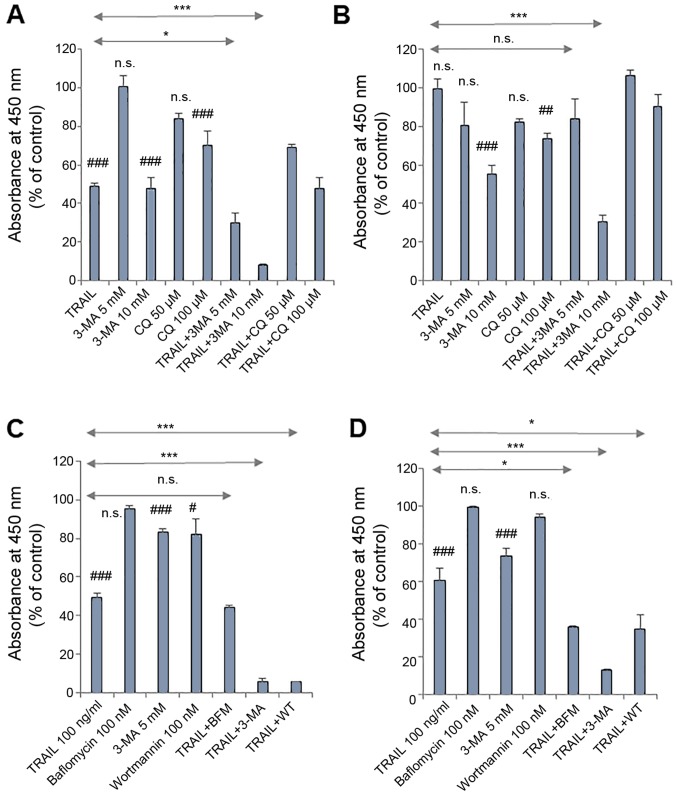
We previously demonstrated that treatment with autophagy inhibitors for 72 h augmented TRAIL-induced apoptosis in several MM and OS cell lines. 3-MA (≥1.3 mM) reduced the viability of A2058, HOS and SaOS-2 cells in a dose-dependent manner, and the effect was blocked by the pan-caspase inhibitor, Z-VAD-FMK (29). In the present study, we found that autophagy inhibitors at higher concentrations increased TRAIL sensitivity more rapidly. Following 24 h of treatment, 3-MA (10 mM) and CQ (100 µM) alone significantly decreased the viability of the A375 and HOS cells, and significantly higher levels of the reduction in cell viability were observed for the combined use of each agent with TRAIL compared to autophagy inhibitor and TRAIL alone (Fig. 1A and B). A lower concentration of 3-MA (5 mM) alone decreased cell viability significantly or not significantly, depending on cellular conditions, but significantly potentiated the effects of TRAIL on the A375 and A2058 cells, but not the HOS cells (Fig. 1). Regardless of the cell type tested, other autophagy inhibitors, such as wortmannin (WT, 100 nM) and bafilomycin A1 (BFM, 100 nM) were ineffective in killing or potentiating the effectiveness of TRAIL. However, these inhibitors potentiated TRAIL-induced toxicity in MM cells upon extended treatment (72 h). In A375 cells, comparable levels of cell killing were observed between TRAIL plus 3-MA and TRAIL plus WT, while in A2058 cells, WT and BFM comparably potentiated TRAIL cytotoxicity although, WT and BFM alone exerted limited toxic effects (Fig. 1C and D).
Figure 1.
Autophagy inhibitors increase TRAIL sensitivity in MM and OS cells. (A and C) A375, (B) HOS and (D) A2058 cells were treated with either (A and B) TRAIL (100 ng/ml), 3-MA (5, 10 mM), CQ (50, 100 µM) alone or in combination for 24 h, or either (C and D) TRAIL (100 ng/ml), 3-MA (5 mM), BFM (100 nM), WT (100 nM) alone or in combination for 72 h and analyzed for viability using WST-8 assay in triplicate. The data are the means ± SD. Data were analyzed by ANOVA followed by Tukey's post hoc test. #P<0.05, ##P<0.01 and ###P<0.001 vs. untreated control; n.s., not significant vs. untreated control. *P<0.05 and ***P<0.001 (n=3). MM, malignant melanoma; OS, osteosarcoma; TRAIL, tumor necrosis factor-related apoptosis-inducing ligand; 3-MA, 3-meth-yladenine; CQ, chloroquine; BFM, bafilomycin A1; WT, wortmannin.
Normal fibroblasts are resistant to the toxicity of autophagy inhibitors
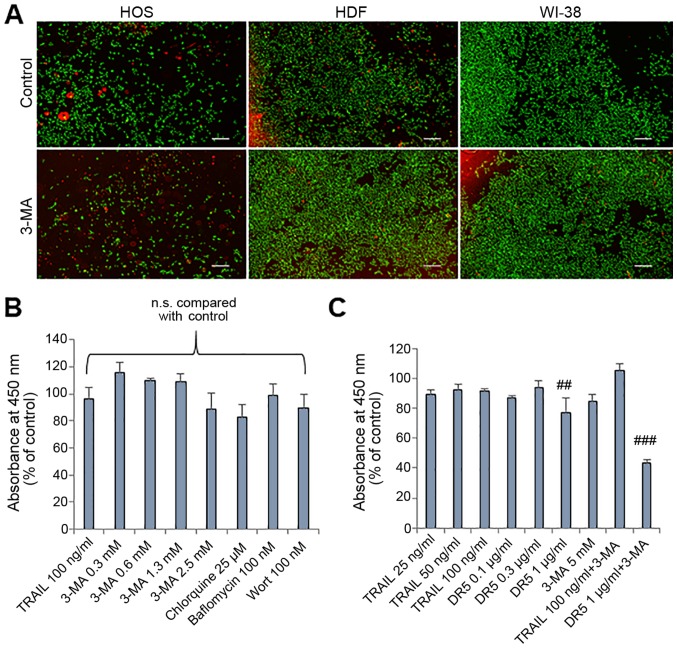
To determine whether the effects of autophagy inhibitors are tumor-specific, we examined the effects of 3-MA on normal human fibroblasts by staining live cells with calcein-AM and staining dead/damaged cells with ethidium bromide homodimer. The staining technique enabled the monitoring of the two cell populations simultaneously. 3-MA treatment for 24 h resulted in a considerable decrease in live HOS cells (green) and increased dead/damaged HOS cells (red) (Fig. 2A, left panels). By contrast, a minimal decrease in live cells and a minimal increase in dead/damaged cells were observed in the HDFs (Fig. 2A, middle panels) and human WI-38 lung fibroblasts (Fig. 2A, right panels). In agreement with these observations, treatment with 3-MA up to a concentration of 5 mM for 72 h resulted in only a modest (maximum of 15.4%) reduction in the viability of the HDFs (Fig. 2B). The cells were also resistant to CQ, BFM and WT (Fig. 2B). Moreover, the cells were resistant to TRAIL and the agonistic anti-DR5 antibody (αDR) (0.1 µg/ml). Co-treatment with TRAIL (100 ng/ml) and 3-MA (5 mM) caused a minimal reduction in cell viability compared to either agent alone, while co-treatment with 3-MA and αDR5 led to a significant (maximum of 56.4%) reduction in cell viability compared to either agent alone (Fig. 2C).
Figure 2.
Normal fibroblasts are resistant to the cytotoxicity of autophagy inhibitors. (A) Images of live/dead assay. HOS cells, human dermal fibroblasts (HDFs) and human WI-38 fibroblasts (WI-38) were treated with 3-MA (2.5 mM) for 24 h at 37°C and stained using a Live/Dead Viability/Cytotoxicity kit. Scale bar, 300 µm. (B and C) HDFs were treated with the agents at the indicated concentrations for 72 h and analyzed for viability using WST-8 assay in triplicate. The data are the means ± SD. Data were analyzed by ANOVA followed by Tukey's post hoc test. ##P<0.01 and ###P<0.001 vs. untreated control (n=3); n.s., not significant. TRAIL, tumor necrosis factor-related apoptosis-inducing ligand; 3-MA, 3-methyladenine; Wort, wortmannin; DR5, death receptor 5.
DR agonists activate the autophagic flux in tumor cells preferentially
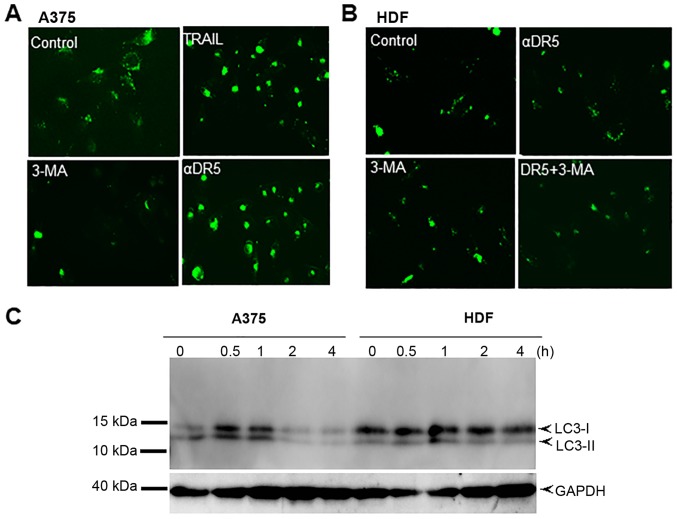
The data presented thus far demonstrated that autophagy inhibitors affected cell survival and TRAIL cytotoxicity in a tumor-specific manner in different cell types. Since in our previous studies (29 37–41), we observed similar responses in the A375, A2058 and HOS cells with various stimuli, the effects were examined in greater detail using them as a model. We speculated the possible difference in sensitivity to autophagy induction between tumor cells and normal cells. To examine this hypothesis, we compared the autophagy flux between MM cells and normal fibroblasts. Live-cell imaging using CYTO-ID Green revealed that even when grown in DMEM supplemented with 10% FCS, the A375 cells exhibited a large number of dispersed CYTO-ID puncta. The puncta were markedly increased following treatment with either TRAIL, αDR5. However, the signal was abolished almost entirely following treatment with 3-MA (Fig. 3A). By contrast, untreated HDFs possessed only a small number of CYTO-ID puncta, which was minimally increased by αDR5 treatment (Fig. 3B). We also examined the effects of TRAIL on the expression level of LC3-II, which is essential for the formation of autophagosomes by western blot analysis. Consistent with the observed increase in CYTO-ID puncta, TRAIL increased LC3-II expression in the A375 cells. The effect was observed immediately (within 30 min) and was transient (returned to the basal level by 1 h) following treatment with TRAIL (Fig. 3C). By contrast, TRAIL induced a minimal increase in the LC3-II level in HDFs after 4 h (Fig. 3C).
Figure 3.
DR agonists activate the autophagic flux in a tumor-specific manner. (A) A375 and (B) HDFs were treated with the agents at the indicated concentrations alone or in combination for 24 h and then stained with CYTO-ID for 1 h at 37°C in the dark. Images were obtained using an EVOS FL Cell Imaging System. (C) A375 cells and HDFs were treated with TRAIL (100 ng/ml) for 0.5, 1, 2, and 4 h at 37°C. The cells were washed with PBS and lysed, and the proteins were separated by sodium dodecyl sulfate-polyacrylamide gel electrophoresis and analyzed for the expression of LC3-I/II by western blotting. GAPDH was used as a loading control. TRAIL, tumor necrosis factor-related apoptosis-inducing ligand; DR, death receptor.
Autophagy inhibitors modulate mitochondrial morphology in a tumor-specific manner
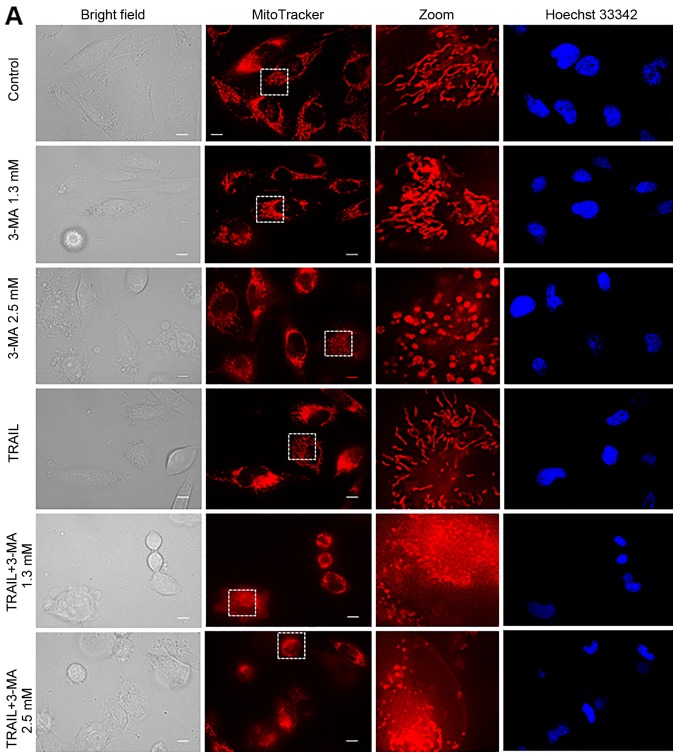
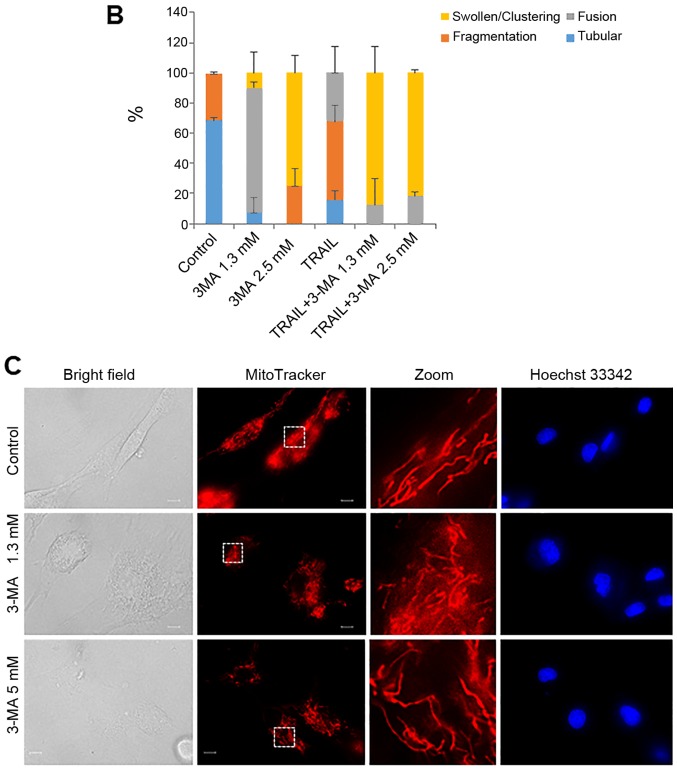
The present study revealed that autophagy inhibitors modulated cell survival in a tumor-specific manner. Previously, we have demonstrated that TRAIL modulates mitochondrial morphology and the resulting effects account for the tumor-selective action of these agents (37,38). Therefore, we hypothesized that autophagy inhibitors may also target mitochondrial network dynamics. To examine this hypothesis, we first analyzed the effects of 3-MA on mitochondrial morphology. Healthy A2058 cells are highly adherent and the mitochondria in the majority of these cells (68%) displayed a tubular network radiating around healthy nuclei, while the remainder became moderately fragmented (Fig. 4A, top row of panels, and 4B). The majority of cells (83%) possessed highly interconnected mitochondria and slightly fragmented nuclei following treatment with 1.3 mM 3-MA (Fig. 4A, second row of panels, and 4B) whereas, in most cells (75%), the mitochondria became heavily fragmented into punctate and clustered following treatment with 2.5 mM 3-MA (Fig. 4A, third row of panels, and 4B). Concomitantly, the nuclei became severely fragmented. TRAIL led to modest mitochondrial fragmentation and minimal nuclear damage (Fig. 4A, fourth row of panels). The mitochondria in most cells (≥82%) split into punctate and clustered concomitantly with severe nuclear fragmentation following co-treatment with TRAIL and 3-MA (1.3 or 2.5 mM) (Fig. 4A, fifth and sixth rows of panels, and 4B). On the other hand, 3-MA up to a concentration of 5 mM had minimal effects on mitochondrial and nuclear morphology of HDFs (Fig. 4C).
Figure 4.
TRAIL and 3-MA disrupt the mitochondrial network in a tumor-specific manner. (A) A2058 cultured on the imaging chamber was treated with the agents at the indicated concentrations alone or in combination for 24 h at 37°C. After washing, the cells were stained with Hoechst 33342 and MitoTracker Red CMXRos for 1 h and washed again. Images were obtained using a fluorescence microscope. The zoom panels represent the expansion of the small white boxes within MitoTracker images. Scale bar, 10 µm. (C) HDFs cultured on the imaging chamber was treated with the agents at the indicated concentrations alone or in combination for 24 h at 37°C. The graph in (B) shows the percentages of mitochondria with four different types of morphology, i.e., tubular, fission, fragmentation, and swelling and clustering in each sample. TRAIL, tumor necrosis factor-related apoptosis-inducing ligand; 3-MA, 3-methyladenine.
Different autophagy inhibitors disrupt the mitochondrial network cooperatively with TRAIL
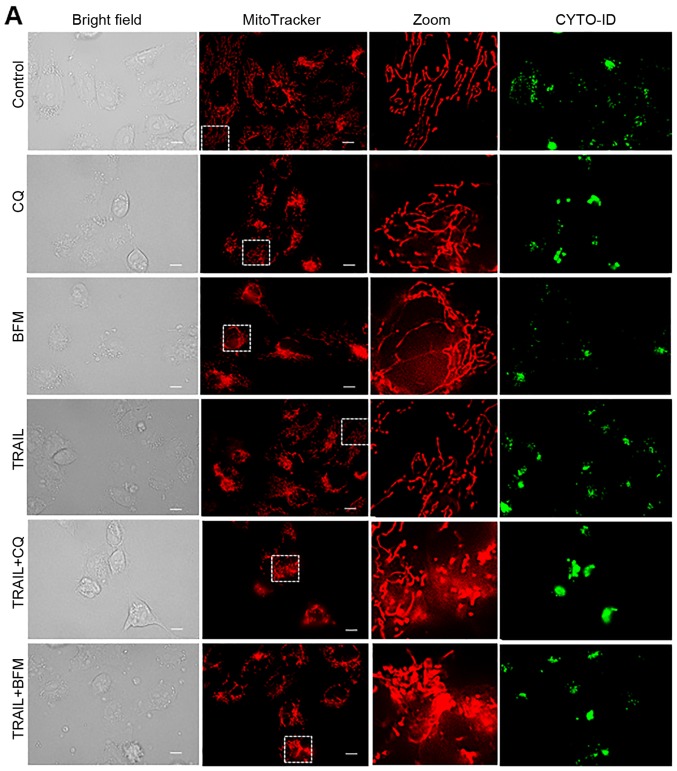
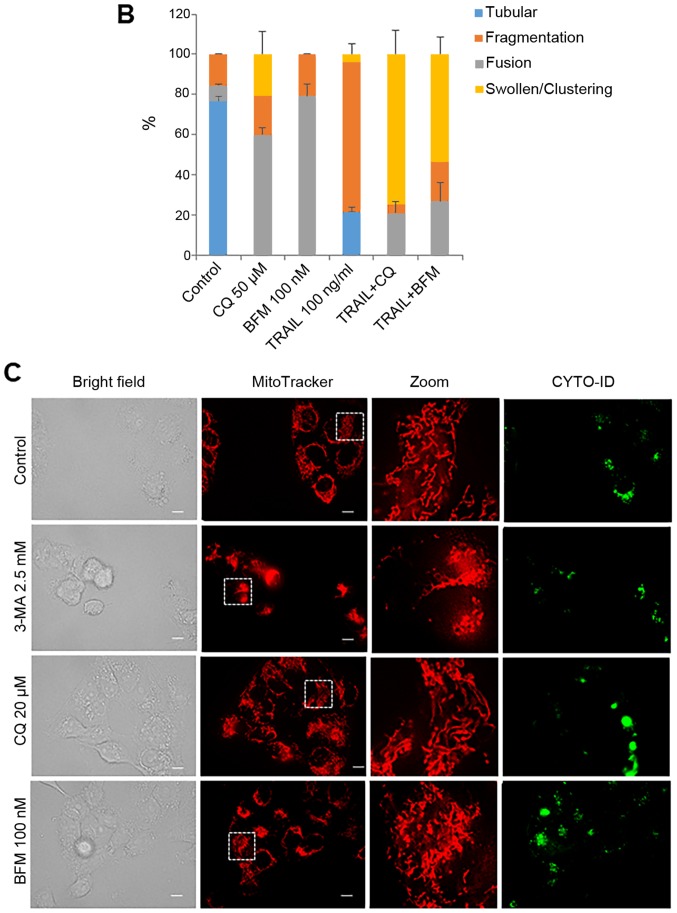
To further elucidate the link between autophagy and the altered mitochondrial network, we examined the effects of different autophagy inhibitors on mitochondrial morphology. The simultaneous monitoring of CYTO-ID puncta enabled us to evaluate their effects on the autophagic flux. Similar to 3-MA, CQ and BFM led to increased mitochondrial fusion in the HOS cells (Fig. 5A, middle and bottom panels, and B). Consistent with their ability to interfere with the formation of autolysosomes, marked clustering of CYTO-ID puncta was observed following treatment with CQ and BFM, while TRAIL treatment led to extensive mitochondrial fragmentation (Fig. 5A, fourth panels, and B). Moreover, co-treatment with TRAIL and CQ or BFM led to intensive mitochondrial fragmentation into punctate and clustering along with increased cell damage (Fig. 5A, fifth and sixth panels, and B). Treatmetn with CQ and BFM also resulted in increased mitochondrial fusion in the A2058 cells (Fig. 5C, third and fourth rows of panels).
Figure 5.
Different autophagy inhibitors disrupt the mitochondrial network cooperatively with TRAIL. (A) HOS cells cultured on the imaging chamber was treated with the agents at the indicated concentrations alone or in combination for 24 h at 37°C. The cells were stained with CYTO-ID and MitoTracker Red CMXRos for 1 h and washed again. Images were obtained using a fluorescence microscope. The zoom panels represent the expansion of the small white boxes within MitoTracker images. Scale bar, 10 µm. (C) A2058 cells cultured on the imaging chamber was treated with the agents at the indicated concentrations alone or in combination for 24 h at 37°C. The graph in (B) shows the percentages of mitochondria with four different types of morphology, i.e., tubular, fission, fragmentation, and swelling and clustering in each sample. TRAIL, tumor necrosis factor-related apoptosis-inducing ligand; CQ, chloroquine; BFM, bafilomycin A1.
Autophagy inhibitors disrupt mitochondrial Ca2+ dynamics
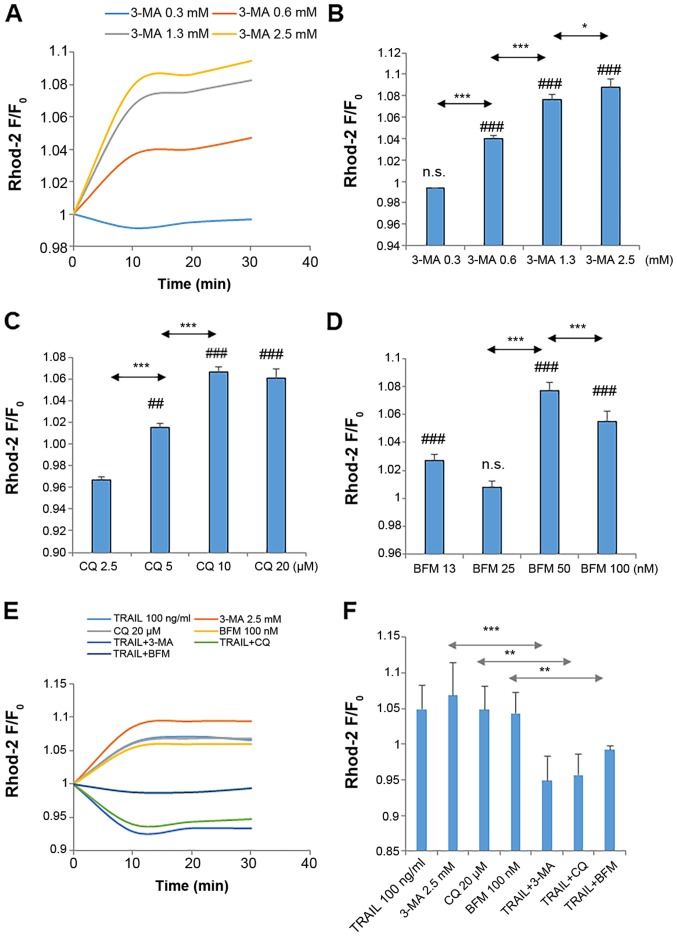
Previously, we demonstrated that modulating mitochondrial Ca2+ dynamics affects mitochondrial morphology in MM and OS cells (39,40). These observations led us to examine whether 3-MA affects mitochondrial Ca2+ dynamics. Direct measurements of [Ca2+]mit using rhod 2-AM revealed a dose-dependent increase in [Ca2+]mit in the A375 cells following treatment with 3-MA (≥0.6 mM) (Fig. 6A and B). Another autophagy inhibitor also exerted a similar effect. Both CQ and BFM led to a robust increase in [Ca2+]mit (Fig. 6C and D). On the other hand, co-treatment with TRAIL and either 3-MA, CQ, or BFM resulted in a significant reduction in [Ca2+]mit compared to the basal level (Fig. 6E and F).
Figure 6.
Autophagy inhibitors disrupt mitochondrial Ca2+ dynamics. (A-F) A375 cells were loaded with 4 µM dihydrorhod 2-AM for 40 min at 37°C and washed with HBSS. The dye-loaded cells were resuspended in the Ca2+-containing medium in 96-well plates. The cells in triplicate were treated with the agents at the indicated concentrations and immediately measured for fluorescence in a microplate reader for 30 min with excitation and emission at 542 and 592 nm, respectively. The data are shown as the ratio of F/F0 where F and F0 are the fluorescence intensities of the treated and the control cells, respectively. Data were analyzed by ANOVA followed by Tukey's post hoc test. ##P<0.01 and ###P<0.001, vs. control; n.s., not significant vs. control. *P<0.05, **P<0.01 and ***P<0.001 (n=3). TRAIL, tumor necrosis factor-related apoptosis-inducing ligand; 3-MA, 3-methyladenine; CQ, chloroquine; BFM, bafilomycin A1.
Reduced store-operated Ca2+ entry (SOCE) contributes to the altered mitochondrial Ca2+ dynamics
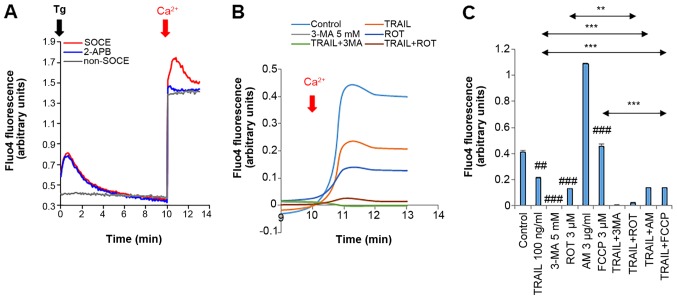
We then determined the contribution of SOCE, the primary Ca2+ entry mechanism in altered Ca2+ dynamics. Treatment with the Ca2+-ATPase inhibitor, thapsigargin (Tg) (2 µM), in the absence of Ca2+ resulted in a rapid, yet transient increase in [Ca2+] resulting from the [Ca2+]cyt release from the endoplasmic reticulum (ER), and the re-addition of Ca2+ led to a more extensive and persistent increase in [Ca2+]cyt (Fig. 7A, red line). Tg was present throughtout the time monitored (for 13 min). While no substantial [Ca2+]cyt increase was observed in the absence of Tg, the re-addition of Ca2+ resulted in a robust increase in [Ca2+]cyt (Fig. 7A, gray line). The SOCE inhibitor, 2-aminoethoxydiphenyl borate (2-APB), entirely blocked the Tg-dependent Ca2+ response, while it did not affect the Tg-independent Ca2+ response, indicating that the former is SOCE, while the latter is non-SOCE. TRAIL or 3-MA (5 mM) alone significantly reduced the SOCE (48.8 and 99.5% reduction, respectively) (Fig. 7B and C). To further examine the functional link between reduced SOCE and TRAIL sensitivity, we examined the effects of different oxidative phosphorylation (OXOPHOS) inhibitors on SOCE as they increase TRAIL sensitivity and mitochondrial network aberration in MM and OS cells (40). OXOPHOS inhibitors, such as rotenone (ROT), antimycin A (AM) and carbonyl cyanide-p-trifluoromethoxyphenylhydrazone (FCCP) increased the Ca2+ release from the intracellular stores, while ROT decreased the SOCE (68.3% reduction), but AM and FCCP had no such effect (Fig. 7B and C). Moreover, co-treatment with TRAIL and AM or FCCP significantly reduced the SOCE, and the combination of TRAIL and ROT was more potent than either agent alone (Fig. 7C).
Figure 7.
Reduced SOCE is associated with TRAIL sensitization. (A) A375 and (B and C) A2058 cells were suspended in a Ca2+-free buffer (HBSS supplemented with 1 mM EGTA) and were loaded with Fluo4-AM. The probe-loaded cells were immediately treated with 2 µM thapsigargin (Tg, black arrow) and incubated for 10 min to deplete the intracellular Ca2+ stores. Subsequently, 2 mM Ca2+ was added to the cells (dark red arrow). Following the addition of Tg, the fluorescence was monitored at 1, 3, 5, 10, 11, 12 and 13 min with excitation and emission at 485 and 538 nm, respectively. To validate the SOCE, the probe-loaded cells in the Ca2+-free buffer were treated as described above in the presence of 2-APB (10 µM). For non-SOCE measurement, the probe-loaded cells in the Ca2+-free buffer were treated with medium, and then added with 2 mM Ca2+. In (B and C), the probe-loaded cells in the Ca2+-free buffer were treated with the agents at the indicated concentrations alone or in combination. In (C), the data represent the means ± SD of the average fluorescence intensity during 10-13 min. Data were analyzed by ANOVA followed by Tukey's post hoc test. ##P<0.01, ###P<0.001 vs. control; **P<0.01 and ***P<0.001 (n=3). TRAIL, tumor necrosis factor-related apoptosis-inducing ligand; 3-MA, 3-methyladenine; ROT, rotenone; AM, antimycin A; FCCP, carbonyl cyanide-p-trifluoromethoxyphenylhydrazone.
Discussion
The present study broadens the previous findings that different autophagy inhibitors negatively regulate MM and OS cell survival (29). In this study, we demonstrated that at relatively high concentrations, autophagy inhibitors, such as 3-MA and CQ, had considerable toxicity, and at lower concentrations, they increased sensitivity to TRAIL-induced apoptosis (Fig. 1). Our findings are similar to those reported previously using various anticancer drugs, such as TRAIL, temozolomide, epirubicin and sorafenib in a variety of cancer cell models (22–28). In this stud, we found that under nutritional and stress-free conditions, human MM and OS cells had a considerable number of autophagic vesicles, while normal cells such as fibroblasts had minimal autophagic vesicles. Normal fibroblasts were highly resistant to the toxicity of autophagy inhibitors alone or in combination with TRAIL (Fig. 2). Moreover, we found that DR ligation induced autophagy in MM cells, but not in normal fibroblasts (Fig. 3). Taken together, it can be concluded that tumor cells may be more susceptible than normal cells to autophagy blockade, since their survival fundamentally depends on protective autophagy, which can be activated upon DR ligation to counteract apoptosis. This view is consistent with recent evidence indicating that autophagy and apoptosis are closely linked, and that they can mutually regulate one another (42–45).
The present study revealed that different autophagy inhibitors commonly affected mitochondrial morphology in MM and OS cells. Different types of mitochondrial morphological changes occurred in response to autophagy inhibitors, depending on the concentration. Moderate mitochondrial fusion was primarily observed upon treatment with low concentrations of 3-MA, while extreme fragmentation into punctate and clustered morphology was observed with high concentrations of 3-MA (Fig. 4). Co-treatment with TRAIL and 3-MA led to an increase in mitochondrial swelling and clustering, and a decrease in mitochondrial fragmentation. Notably, mitochondria in normal fibroblasts were resistant to the effects of autophagy inhibitors (Fig. 4). Thus, autophagy blockade seems to affect mitochondrial network dynamics, preferentially in malignant cells. The effect is similar to that of Mdivi-1, FCCP and AM, all of which potentiate TRAIL-induced aberration of mitochondrial morphology and apoptosis (37–40). Therefore, we suggest that mitochondrial network aberration is a critical, convergent event in apoptosis induction. The molecular mechanisms underlying the pro-apoptotic mitochondrial network alterations remain unclear. However, the alterations proceed successively and independently of the function of Drp1, a master regulator of mitochondrial fission (37). In response to subtoxic concentrations of insults, a modest mitochondrial fragmentation or fusion occurs rapidly. These events contribute to increasing TRAIL sensitivity; however, by themselves they are insufficient to induce cell death. In response to toxic concentrations of insults, modest mitochondrial network alterations and subsequently, more pronounced changes occur. The latter event is characterized by the appearance of punctate and clustered mitochondria and is accompanied by severe cellular and nuclear damage and cell death. The appearance of punctate mitochondria suggests the disruption of mitochondrial membrane integrity and collapse of ΔΨm. This collapse is a primary trigger of mitophagy (46); therefore, ΔΨm-dissipating insults, such as CCCP, FCCP and salinomycin activate mitophagy (46,47). The collapse triggers the accumulation of PTEN-induced putative kinase 1 on the outer mitochondrial membrane, which leads to the phosphorylation of Parkin and the activation of Parkin-mediated ubiquitination. Eventually, the autophagic degradation of the damaged organelles occurs (44). Thus, mitophagy may contribute to the extreme fragmentation of the mitochondria observed in the present study. Controlled mitophagy removes damaged mitochondria, thereby acting as cytoprotective, while excessive mitophagy compromises energy supply and Ca2+ and metabolic homeostasis thereby leading to cell death. Our previous study demonstrated that co-treatment with TRAIL and 3-MA increased mitophagy in OS cells, while either agent alone had a minimal effect (29). Notably, mitophagy is concomitant with alterations in the condition and cellular location of autophagosomes. The basal autophagosome puncta dispersed within cells were decreased, while massive clusters of puncta within fragmented and aggregated mitochondria were increased. These observations suggest that ambient autophagy may contribute to preventing the disruption of the mitochondrial network and cytocidal mitophagy. Further studies are required to verify this hypothesis.
Ca2+ has recently emerged as a novel target for cancer treatment (48-50). An increasing body of evidence suggests that different cancer cell types exhibit tumor-specific traits in Ca2+ dynamics, which contribute to tumorigenesis, malignant phenotypes, drug resistance, increased proliferation, evasion from apoptosis and survival (49). Ca2+ acts as a double-edged sword in cancer cells since it also causes different modalities of cell death. The Ca2+ overload within the mitochondrial matrix results in an increased permeability of the inner mitochondrial membrane; this event is referred to as the mitochondrial permeability transition (MPT) and causes the subsequent osmotic rupture of the outer mitochondrial membrane. This rupture, in turn, results in the release of different pro-apoptotic proteins, such as cytochrome c and apoptosis-inducing factor, thereby leading to apoptosis (51–53). MPT also leads to rapid ΔΨm collapse, the loss of ATP, and the rupture of the outer mitochondrial membrane. Ultimately, the loss of ATP and the disruption of mitochondrial integrity lead to necrosis. Ca2+ also plays a primary role in regulating other cell death modalities including autophagy (52,53). Moreover, our recent studies demonstrated that mitochondrial Ca2+ is a critical regulator of mitochondrial network dynamics in MM and OS cells (39,40). In this study, different autophagy inhibitors, including 3-MA, CQ and BFM commonly stimulated mitochondrial Ca2+ loading (Fig. 6), suggesting that basal autophagy contributes to the extrusion of mitochondrial Ca2+. Given that autophagy counteracts apoptosis, this observation may be rational since apoptosis is triggered by mitochondrial Ca2+ overload. SOCE is the primary machinery for Ca2+ entry in eukaryotic cells. An increasing body of evidence suggests that SOCE plays a vital role in growth and survival, and malignant phenotypes including drug resistance and evasion of cell death (50). The depletion of the intracellular Ca2+ stores results in SOCE through the activation of store-operated Ca2+ (SOC) channels. The present study indicated that SOCE was a common target in modulating Ca2+ dynamics for 3-MA, TRAIL and OXOPHOS inhibitors (Fig. 7). Cancer cells are required to continuously transport Ca2+ from the ER to mitochondria to cope with high energy demands. An increasing body of evidence suggests that the inositol-3-phosphate receptor (IP3R)-voltage-dependent anion channel 1 (VDAC1)-mitochondrial Ca2+ uniporter (MCU) pathway is the primary route for this transport (54,55). Accordingly, it is likely that the continuous Ca2+ flow from the ER to the mitochondria contributes to effective Ca2+ depletion in the ER, thereby facilitating SOCE. Conversely, SOCE inactivation results in a massive decrease in the cytosolic Ca2+ followed by a deficiency of the intracellular Ca2+ stores ultimately leading to mitochondrial dysfunction due to Ca2+ depletion. If this mutual regulation is the case, the reduction of SOCE may have a profound impact on the growth and survival of MM and OS cells. In support of this view, we previously demonstrated that the removal of overall Ca2+ by Ca2+ chelators or the removal of mitochondrial Ca2+ by MCU resulted in increased sensitivity to TRAIL-induced apoptosis (39). Notably, the combined use of TRAIL and OXOPHOS inhibitors also caused a severe reduction in SOCE in this study (Fig. 7). Thus, our previous and present findings are consistent with the findings of a previous study demonstrating that SOCE requires functional mitochondria and MCU (56). All these agents also modulated mitochondrial Ca2+ and increased TRAIL sensitivity in MM and OS cells (39,40). Accordingly, the inactivation of SOCE may play a primary role in increasing TRAIL sensitivity, as well as decreasing cell survival by autophagy inhibitors. Notably, we previously showed that alterations in mitochondrial Ca2+ are accompanied by mitochondrial network disruption. Therefore, modulation of the mitochondrial network by autophagy inhibitors might also primarily result from altered mitochondrial Ca2+ dynamics. Further investigations with respect to the functional and causal link among autophagy, Ca2+, and mitochondrial dynamics are ongoing.
In conclusion, we demonstrate in this study that autophagy inhibitors regulate TRAIL sensitivity in a tumor-selective manner by modulating the mitochondrial network and Ca2+ dynamics. These findings provide new rationale for the use of autophagy inhibitors in TRAIL treatment. Co-treatment with TRAIL and an autophagy inhibitor may thus be a promising approach for the treatment of TRAIL-resistant cancers, such as MM and OS.
Acknowledgments
The authors would like to thank the JCRB Cell Bank of National Institutes of Biomedical Innovation, Health, and Nutrition (Osaka, Japan) for providing A2058 and WI-38 and the Riken BioResource Center (Tsukuba, Japan) for providing HOS and SaOS-2. The authors appreciate Dr Tomohiko Tokunaga and Dr Kousuke Saito (Division of General Medicine, Nihon University School of Medicine, Tokyo, Japan) and Dr Tomohisa Ito (Department of Orthopedic Surgery, Nihon University School of Medicine, Tokyo, Japan) and Dr Kosuke Saito for providing technical assistance.
Funding
This study was supported in part by JSPS KAKENHI Grant no. 15K09792 to TO, and 15K09750 and 18K09121 to YSK.
Availability of data and materials
The datasets used and/or analyzed during the current study are available from the corresponding author upon reasonable request.
Authors' contributions
AOT performed the experiments, analyzed data, and wrote the draft. MaSK and MiSK performed experiments and analyzed data. TO wrote the draft, analyzed data, and performed a critical revision of the manuscript. YSK conceived and designed the study, performed experiments, and wrote the manuscript. All authors have read and approved the final manuscript.
Ethics approval and consent to participate
Not applicable.
Patient consent for publication
Not applicable.
Conflict of interest
The authors declare that they have no competing interests.
References
- 1.Almasan A, Ashkenazi A. Apo2L/TRAIL: Apoptosis signaling, biology, and potential for cancer therapy. Cytokine Growth Factor Rev. 2003;14:337–348. doi: 10.1016/S1359-6101(03)00029-7. [DOI] [PubMed] [Google Scholar]
- 2.Johnstone RW, Frew AJ, Smyth MJ. The TRAIL apoptotic pathway in cancer onset, progression and therapy. Nat Rev Cancer. 2008;8:782–798. doi: 10.1038/nrc2465. [DOI] [PubMed] [Google Scholar]
- 3.Wang S. The promise of cancer therapeutics targeting the TNF-related apoptosis-inducing ligand and TRAIL receptor pathway. Oncogene. 2008;27:6207–6215. doi: 10.1038/onc.2008.298. [DOI] [PubMed] [Google Scholar]
- 4.Gonzalvez F, Ashkenazi A. New insights into apoptosis signaling by Apo2L/TRAIL. Oncogene. 2010;29:4752–4765. doi: 10.1038/onc.2010.221. [DOI] [PubMed] [Google Scholar]
- 5.Kischkel FC, Lawrence DA, Chuntharapai A, Schow P, Kim KJ, Ashkenazi A. Apo2L/TRAIL-dependent recruitment of endogenous FADD and caspase-8 to death receptors 4 and 5. Immunity. 2000;12:611–620. doi: 10.1016/S1074-7613(00)80212-5. [DOI] [PubMed] [Google Scholar]
- 6.LeBlanc HN, Ashkenazi A. Apo2L/TRAIL and its death and decoy receptors. Cell Death Differ. 2003;10:66–75. doi: 10.1038/sj.cdd.4401187. [DOI] [PubMed] [Google Scholar]
- 7.Ivanov VN, Bhoumik A, Ronai Z. Death receptors and melanoma resistance to apoptosis. Oncogene. 2003;22:3152–3161. doi: 10.1038/sj.onc.1206456. [DOI] [PubMed] [Google Scholar]
- 8.Dyer MJ, MacFarlane M, Cohen GM. Barriers to effective TRAIL-targeted therapy of malignancy. J Clin Oncol. 2007;25:4505–4506. doi: 10.1200/JCO.2007.13.1011. [DOI] [PubMed] [Google Scholar]
- 9.Dimberg LY, Anderson CK, Camidge R, Behbakht K, Thorburn A, Ford HL. On the TRAIL to successful cancer therapy? Predicting and counteracting resistance against TRAIL-based therapeutics. Oncogene. 2013;32:1341–1350. doi: 10.1038/onc.2012.164. [DOI] [PMC free article] [PubMed] [Google Scholar]
- 10.Guiho R, Biteau K, Heymann D, Redini F. TRAIL-based therapy in pediatric bone tumors: How to overcome resistance. Future Oncol. 2015;11:535–542. doi: 10.2217/fon.14.293. [DOI] [PubMed] [Google Scholar]
- 11.de Miguel D, Lemke J, Anel A, Walczak H, Martinez-Lostao L. Onto better TRAILs for cancer treatment. Cell Death Differ. 2016;23:733–747. doi: 10.1038/cdd.2015.174. [DOI] [PMC free article] [PubMed] [Google Scholar]
- 12.Maiuri MC, Zalckvar E, Kimchi A, Kroemer G. Self-eating and self-killing: Crosstalk between autophagy and apoptosis. Nat Rev Mol Cell Biol. 2007;8:741–752. doi: 10.1038/nrm2239. [DOI] [PubMed] [Google Scholar]
- 13.Mizushima N, Yoshimori T, Ohsumi Y. The role of Atg proteins in autophagosome formation. Annu Rev Cell Dev Biol. 2011;27:107–132. doi: 10.1146/annurev-cellbio-092910-154005. [DOI] [PubMed] [Google Scholar]
- 14.Codogno P, Meijer AJ. Autophagy and signaling: Their role in cell survival and cell death. Cell Death Differ. 2005;12(Suppl 2):1509–1518. doi: 10.1038/sj.cdd.4401751. [DOI] [PubMed] [Google Scholar]
- 15.Díaz-Troya S, Pérez-Pérez ME, Florencio FJ, Crespo JL. The role of TOR in autophagy regulation from yeast to plants and mammals. Autophagy. 2008;4:851–865. doi: 10.4161/auto.6555. [DOI] [PubMed] [Google Scholar]
- 16.Dennis MD, Baum JI, Kimball SR, Jefferson LS. Mechanisms involved in the coordinate regulation of mTORC1 by insulin and amino acids. J Biol Chem. 2011;286:8287–8296. doi: 10.1074/jbc.M110.209171. [DOI] [PMC free article] [PubMed] [Google Scholar]
- 17.Ouyang L, Shi Z, Zhao S, Wang FT, Zhou TT, Liu B, Bao JK. Programmed cell death pathways in cancer: A review of apoptosis, autophagy and programmed necrosis. Cell Prolif. 2012;45:487–498. doi: 10.1111/j.1365-2184.2012.00845.x. [DOI] [PMC free article] [PubMed] [Google Scholar]
- 18.Bhutia SK, Mukhopadhyay S, Sinha N, Das DN, Panda PK, Patra SK, Maiti TK, Mandal M, Dent P, Wang XY, et al. Autophagy: Cancer's friend or foe? Adv Cancer Res. 2013;118:61–95. doi: 10.1016/B978-0-12-407173-5.00003-0. [DOI] [PMC free article] [PubMed] [Google Scholar]
- 19.Gozuacik D, Kimchi A. Autophagy as a cell death and tumor suppressor mechanism. Oncogene. 2004;23:2891–2906. doi: 10.1038/sj.onc.1207521. [DOI] [PubMed] [Google Scholar]
- 20.Fulda S, Kögel D. Cell death by autophagy: Emerging molecular mechanisms and implications for cancer therapy. Oncogene. 2015;34:5105–5113. doi: 10.1038/onc.2014.458. [DOI] [PubMed] [Google Scholar]
- 21.Fulda S. Autophagy in cancer therapy. Front Oncol. 2017;7:128. doi: 10.3389/fonc.2017.00128. [DOI] [PMC free article] [PubMed] [Google Scholar]
- 22.Knoll G, Bittner S, Kurz M, Jantsch J, Ehrenschwender M. Hypoxia regulates TRAIL sensitivity of colorectal cancer cells through mitochondrial autophagy. Oncotarget. 2016;7:41488–41504. doi: 10.18632/oncotarget.9206. [DOI] [PMC free article] [PubMed] [Google Scholar]
- 23.He W, Wang Q, Xu J, Xu X, Padilla MT, Ren G, Gou X, Lin Y. Attenuation of TNFSF10/TRAIL-induced apoptosis by an autophagic survival pathway involving TRAF2- and RIPK1/RIP1-mediated MAPK8/JNK activation. Autophagy. 2012;8:1811–1821. doi: 10.4161/auto.22145. [DOI] [PMC free article] [PubMed] [Google Scholar]
- 24.Lim SC, Jeon HJ, Kee KH, Lee MJ, Hong R, Han SI. Involvement of DR4/JNK pathway-mediated autophagy in acquired TRAIL resistance in HepG2 cells. Int J Oncol. 2016;49:1983–1990. doi: 10.3892/ijo.2016.3699. [DOI] [PubMed] [Google Scholar]
- 25.Kanzawa T, Germano IM, Komata T, Ito H, Kondo Y, Kondo S. Role of autophagy in temozolomide-induced cytotoxicity for malignant glioma cells. Cell Death Differ. 2004;11:448–457. doi: 10.1038/sj.cdd.4401359. [DOI] [PubMed] [Google Scholar]
- 26.Knizhnik AV, Roos WP, Nikolova T, Quiros S, Tomaszowski KH, Christmann M, Kaina B. Survival and death strategies in glioma cells: Autophagy, senescence and apoptosis triggered by a single type of temozolomide-induced DNA damage. PLoS One. 2013;8:e55665. doi: 10.1371/journal.pone.0055665. [DOI] [PMC free article] [PubMed] [Google Scholar]
- 27.Guo W, Wang Y, Wang Z, Wang YP, Zheng H. Inhibiting autophagy increases epirubicin's cytotoxicity in breast cancer cells. Cancer Sci. 2016;107:1610–1621. doi: 10.1111/cas.13059. [DOI] [PMC free article] [PubMed] [Google Scholar]
- 28.Prieto-Domínguez N, Ordóñez R, Fernández A, García-Palomo A, Muntané J, González-Gallego J, Mauriz JL. Modulation of Autophagy by Sorafenib: Effects on Treatment Response. Front Pharmacol. 2016;7:151. doi: 10.3389/fphar.2016.00151. [DOI] [PMC free article] [PubMed] [Google Scholar]
- 29.Ito T, Ando T, Suzuki-Karasaki M, Tokunaga T, Yoshida Y, Ochiai T, Tokuhashi Y, Suzuki-Karasaki Y. Cold PSM, but not TRAIL, triggers autophagic cell death: A therapeutic advantage of PSM over TRAIL. Int J Oncol. 2018;53:503–514. doi: 10.3892/ijo.2018.4413. [DOI] [PMC free article] [PubMed] [Google Scholar]
- 30.Landes T, Martinou JC. Mitochondrial outer membrane permeabilization during apoptosis: The role of mitochondrial fission. Biochim Biophys Acta. 2011;1813:540–545. doi: 10.1016/j.bbamcr.2011.01.021. [DOI] [PubMed] [Google Scholar]
- 31.Elgass K, Pakay J, Ryan MT, Palmer CS. Recent advances into the understanding of mitochondrial fission. Biochim Biophys Acta. 2013;1833:150–161. doi: 10.1016/j.bbamcr.2012.05.002. [DOI] [PubMed] [Google Scholar]
- 32.Twig G, Shirihai OS. The interplay between mitochondrial dynamics and mitophagy. Antioxid Redox Signal. 2011;14:1939–1951. doi: 10.1089/ars.2010.3779. [DOI] [PMC free article] [PubMed] [Google Scholar]
- 33.Chen H, Chomyn A, Chan DC. Disruption of fusion results in mitochondrial heterogeneity and dysfunction. J Biol Chem. 2005;280:26185–26192. doi: 10.1074/jbc.M503062200. [DOI] [PubMed] [Google Scholar]
- 34.Hoppins S, Lackner L, Nunnari J. The machines that divide and fuse mitochondria. Annu Rev Biochem. 2007;76:751–780. doi: 10.1146/annurev.biochem.76.071905.090048. [DOI] [PubMed] [Google Scholar]
- 35.Pendin D, Filadi R, Pizzo P. The concerted action of mitochondrial dynamics and positioning: New characters in cancer onset and progression. Front Oncol. 2017;7:102. doi: 10.3389/fonc.2017.00102. [DOI] [PMC free article] [PubMed] [Google Scholar]
- 36.Kingnate C, Charoenkwan K, Kumfu S, Chattipakorn N, Chattipakorn SC. Possible roles of mitochondrial dynamics and the effects of pharmacological interventions in chemoresistant ovarian cancer. EBioMedicine. 2018;34:256–266. doi: 10.1016/j.ebiom.2018.07.026. [DOI] [PMC free article] [PubMed] [Google Scholar]
- 37.Akita M, Suzuki-Karasaki M, Fujiwara K, Nakagawa C, Soma M, Yoshida Y, Ochiai T, Tokuhashi Y, Suzuki-Karasaki Y. Mitochondrial division inhibitor-1 induces mitochondrial hyper-fusion and sensitizes human cancer cells to TRAIL-induced apoptosis. Int J Oncol. 2014;45:1901–1912. doi: 10.3892/ijo.2014.2608. [DOI] [PubMed] [Google Scholar]
- 38.Suzuki-Karasaki Y, Fujiwara K, Saito K, Suzuki-Karasaki M, Ochiai T, Soma M. Distinct effects of TRAIL on the mitochondrial network in human cancer cells and normal cells: Role of plasma membrane depolarization. Oncotarget. 2015;6:21572–21588. doi: 10.18632/oncotarget.4268. [DOI] [PMC free article] [PubMed] [Google Scholar]
- 39.Takata N, Ohshima Y, Suzuki-Karasaki M, Yoshida Y, Tokuhashi Y, Suzuki-Karasaki Y. Mitochondrial Ca2+ removal amplifies TRAIL cytotoxicity toward apoptosis-resistant tumor cells via promotion of multiple cell death modalities. Int J Oncol. 2017;51:193–203. doi: 10.3892/ijo.2017.4020. [DOI] [PubMed] [Google Scholar]
- 40.Ohshima Y, Takata N, Suzuki-Karasaki M, Yoshida Y, Tokuhashi Y, Suzuki-Karasaki Y. Disrupting mitochondrial Ca2+ homeostasis causes tumor-selective TRAIL sensitization through mitochondrial network abnormalities. Int J Oncol. 2017;51:1146–1158. doi: 10.3892/ijo.2017.4096. [DOI] [PubMed] [Google Scholar]
- 41.Suzuki Y, Inoue T, Murai M, Suzuki-Karasaki M, Ochiai T, Ra C. Depolarization potentiates TRAIL-induced apoptosis in human melanoma cells: Role for ATP-sensitive K+ channels and endoplasmic reticulum stress. Int J Oncol. 2012;41:465–475. doi: 10.3892/ijo.2012.1483. [DOI] [PMC free article] [PubMed] [Google Scholar]
- 42.Lockshin RA, Zakeri Z. Apoptosis, autophagy, and more. Int J Biochem Cell Biol. 2004;36:2405–2419. doi: 10.1016/j.biocel.2004.04.011. [DOI] [PubMed] [Google Scholar]
- 43.Eisenberg-Lerner A, Bialik S, Simon HU, Kimchi A. Life and death partners: Apoptosis, autophagy and the cross-talk between them. Cell Death Differ. 2009;16:966–975. doi: 10.1038/cdd.2009.33. [DOI] [PubMed] [Google Scholar]
- 44.Mukhopadhyay S, Panda PK, Sinha N, Das DN, Bhutia SK. Autophagy and apoptosis: Where do they meet? Apoptosis. 2014;19:555–566. doi: 10.1007/s10495-014-0967-2. [DOI] [PubMed] [Google Scholar]
- 45.Kulikov AV, Luchkina EA, Gogvadze V, Zhivotovsky B. Mitophagy: Link to cancer development and therapy. Biochem Biophys Res Commun. 2017;482:432–439. doi: 10.1016/j.bbrc.2016.10.088. [DOI] [PubMed] [Google Scholar]
- 46.Narendra DP, Jin SM, Tanaka A, Suen DF, Gautier CA, Shen J, Cookson MR, Youle RJ. PINK1 is selectively stabilized on impaired mitochondria to activate Parkin. PLoS Biol. 2010;8:e1000298. doi: 10.1371/journal.pbio.1000298. [DOI] [PMC free article] [PubMed] [Google Scholar]
- 47.Jangamreddy JR, Ghavami S, Grabarek J, Kratz G, Wiechec E, Fredriksson BA, Rao Pariti RK, Cieślar-Pobuda A, Panigrahi S, Łos MJ. Salinomycin induces activation of autophagy, mitophagy and affects mitochondrial polarity: Differences between primary and cancer cells. Biochim Biophys Acta. 2013;1833:2057–2069. doi: 10.1016/j.bbamcr.2013.04.011. [DOI] [PubMed] [Google Scholar]
- 48.Marchi S, Pinton P. Alterations of calcium homeostasis in cancer cells. Curr Opin Pharmacol. 2016;29:1–6. doi: 10.1016/j.coph.2016.03.002. [DOI] [PubMed] [Google Scholar]
- 49.Monteith GR, Prevarskaya N, Roberts-Thomson SJ. The calcium-cancer signalling nexus. Nat Rev Cancer. 2017;17:367–380. doi: 10.1038/nrc.2017.18. [DOI] [PubMed] [Google Scholar]
- 50.Jardin I, Rosado JA. STIM and calcium channel complexes in cancer. Biochim Biophys Acta. 2016;1863:1418–1426. doi: 10.1016/j.bbamcr.2015.10.003. [DOI] [PubMed] [Google Scholar]
- 51.Izzo V, Bravo-San Pedro JM, Sica V, Kroemer G, Galluzzi L. Mitochondrial permeability transition: New findings and persisting uncertainties. Trends Cell Biol. 2016;26:655–667. doi: 10.1016/j.tcb.2016.04.006. [DOI] [PubMed] [Google Scholar]
- 52.Galluzzi L, Bravo-San Pedro JM, Kepp O, Kroemer G. Regulated cell death and adaptive stress responses. Cell Mol Life Sci. 2016;73:2405–2410. doi: 10.1007/s00018-016-2209-y. [DOI] [PMC free article] [PubMed] [Google Scholar]
- 53.Orrenius S, Gogvadze V, Zhivotovsky B. Calcium and mitochondria in the regulation of cell death. Biochem Biophys Res Commun. 2015;460:72–81. doi: 10.1016/j.bbrc.2015.01.137. [DOI] [PubMed] [Google Scholar]
- 54.Danese A, Patergnani S, Bonora M, Wieckowski MR, Previati M, Giorgi C, Pinton P. Calcium regulates cell death in cancer: Roles of the mitochondria and mitochondria-associated membranes (MAMs) Biochim Biophys Acta Bioenerg. 2017;1858:615–627. doi: 10.1016/j.bbabio.2017.01.003. [DOI] [PubMed] [Google Scholar]
- 55.Elustondo PA, Nichols M, Robertson GS, Pavlov EV. Mitochondrial Ca2+ uptake pathways. J Bioenerg Biomembr. 2017;49:113–119. doi: 10.1007/s10863-016-9676-6. [DOI] [PubMed] [Google Scholar]
- 56.Deak AT, Blass S, Khan MJ, Groschner LN, Waldeck-Weiermair M, Hallström S, Graier WF, Malli R. IP3-mediated STIM1 oligomerization requires intact mitochondrial Ca2+ uptake. J Cell Sci. 2014;127:2944–2955. doi: 10.1242/jcs.149807. [DOI] [PMC free article] [PubMed] [Google Scholar]
Associated Data
This section collects any data citations, data availability statements, or supplementary materials included in this article.
Data Availability Statement
The datasets used and/or analyzed during the current study are available from the corresponding author upon reasonable request.


