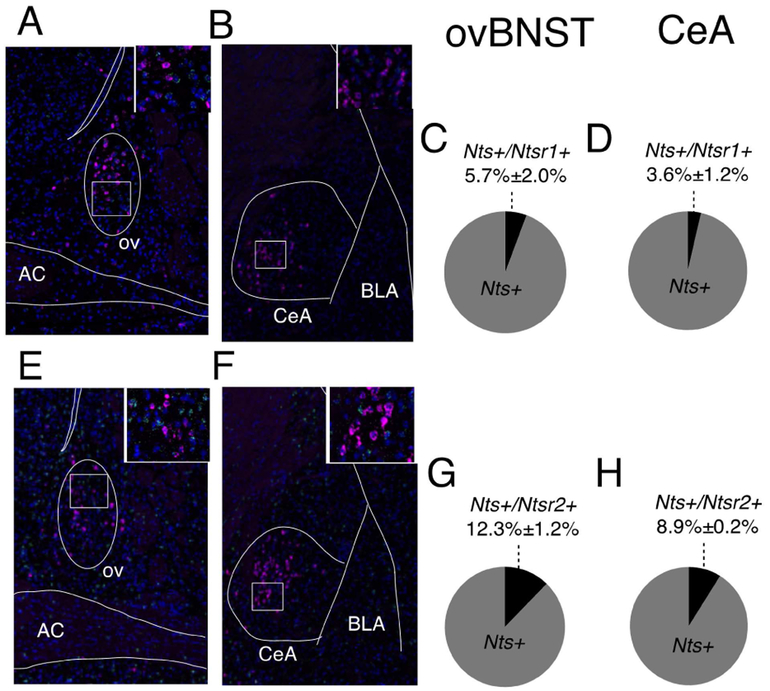
Figure 4. Expression and co-localization of NT and NTRs mRNA in the ovBNST and CeA.
Representative image of dual fluorescent in situ hybridization (FISH) for Nts/Ntsr1 (Nts (purple), Ntsr1 (green), DAPI (blue) in the ovBNST (A) and CeA (B). Ratio of the total number of Nts mRNA-expressing cells that are positive for Ntsr1 (co-localizing) (average ±SEM % n=2 mice, 2 slices/mouse) in the ovBNST (C) and CeA (D). Representative image of dual FISH for Nts/Ntsr2 (Nts (purple), Ntsr2 (green), DAPI (blue)) in the ovBNST (E) and CeA (F). Ratio of the total number of Nts mRNA-expressing cells that are positive for Ntsr2 (co-localizing) (average ±SEM % n=2 mice, 2 slices/mouse) in the ovBNST (G) and CeA (H).

