Abstract
Many promising drug candidates metabolized by aldehyde oxidase (AOX) fail during clinical trial owing to underestimation of their clearance. AOX is species-specific, which makes traditional allometric studies a poor choice for estimating human clearance. Other studies have suggested using half-life calculated by measuring substrate depletion to measure clearance. In this study, we proposed using numerical fitting to enzymatic pathways other than Michaelis-Menten (MM) to avoid missing the initial high turnover rate of product formation. Here, product formation over a 240-minute time course of six AOX substrates—O6-benzylguanine, N-(2-dimethylamino)ethyl)acridine-4-carboxamide, zaleplon, phthalazine, BIBX1382 [N8-(3-Chloro-4-fluorophenyl)-N2-(1-methyl-4-piperidinyl)-pyrimido[5,4-d]pyrimidine-2,8-diamine dihydrochloride], and zoniporide—have been provided to illustrate enzyme deactivation over time to help better understand why MM kinetics sometimes leads to underestimation of rate constants. Based on the data provided in this article, the total velocity for substrates becomes slower than the initial velocity by 3.1-, 6.5-, 2.9-, 32.2-, 2.7-, and 0.2-fold, respectively, in human expressed purified enzyme, whereas the Km remains constant. Also, our studies on the role of reactive oxygen species (ROS), such as superoxide and hydrogen peroxide, show that ROS did not significantly alter the change in enzyme activity over time. Providing a new electron acceptor, 5-nitroquinoline, did, however, alter the change in rate over time for mumerous compounds. The data also illustrate the difficulties in using substrate disappearance to estimate intrinsic clearance.
Introduction
Aldehyde oxidase (AOX) is a cytosolic protein belonging to the family of molybdoflavoenzymes (Mendel, 2009). It is found most extensively in the liver but is also expressed in kidney, lungs, gastrointestinal tract, and skin. AOX is a homodimer enzyme that needs four cofactors in each of its 150-kDa subunits to be active. These cofactors, including molybdenum pterin cofactor (MoCo), two iron-sulfur clusters, and a flavin adenine dinucleotide site (Garattini et al., 2008; Mendel, 2009). The final electron acceptor for the flow of electrons from the MoCo site to the flavin site is molecular oxygen, which forms reactive oxygen species (ROS) O2•− and H2O2. AOX is capable of both oxidative and reductive transformations of a wide range of compounds. AOX oxidative substrates include aldehydes, aromatic heterocycles, iminium ions, and azaheterocycles; AOX reductive substrates include sulfoxides, nitro compounds, N-oxides, nitrates, nitrites, and molecular oxygen (Krenitsky et al., 1972; Kitamura and Tatsumi, 1984; Stoddart and Levine, 1992; Li et al., 2009b; Pryde et al., 2010; Maia et al., 2015). AOX reductions have been gaining attention (Konishi et al., 2017; Paragas et al., 2017a; Amano et al., 2018). Previously, it was believed that AOX reduction occurs only under anaerobic conditions (Li et al., 2009a; Weidert et al., 2014; Maia et al., 2015), but it has been shown that reduction by AOX can also occur under normal oxygen condition and at a different site than where substrate oxidation happens.
More than 90% of metabolic breakdown of drugs and xenobiotics is through the cytochrome P450 (P450) family of enzymes (Lynch and Price, 2007); however, recent efforts toward making drugs more stable to P450 metabolism has also had the effect of making them susceptible to clearance by other pathways. This has turned attention to studying other enzymatic pathways, particularly AOX, in drug metabolism. Although extensive studies have been done on prediction of intrinsic clearance (CLint) for P450-cleared compounds (Dalvie et al., 2010a), the ability to obtain a close estimation of in vivo clearance from in vitro data for AOX-mediated metabolism has not yet been developed. Traditional allometric scaling assumes that drug elimination mechanism is conserved across species, but this is not the case for AOX since there is a noticeable difference in AOX activity between human and preclinical species. In some species, such as the rat and mouse, substrate is metabolized by different isoenzymes, AOX1 and AOX3, whereas it is not metabolized at all by AOX in dogs, which do not produce active AO (Kaye et al., 1984; Dalvie et al., 2010b; Garattini and Terao, 2012). Recent efforts to predict clearance have used novel allometric studies using single-species scaling or multispecies allometry to scale in vitro CLint, rat, guinea pig, monkey, and minipig to human in vitro CLint (Crouch et al., 2018). Another method proposed to predict in vivo metabolism from in vitro CLint is by monitoring substrate depletion in time and then use the half-life to scale up the results to the whole human body (Zientek et al., 2010).
Atypical kinetics of the cytochrome P450 family of enzymes has already been extensively studied (Korzekwa et al., 1998; Hutzler and Tracy, 2002); however, this kind of behavior is not specific to that family. Many AO substrates deviate from Michaelis-Menten (MM) steady-state kinetics. The enzyme is nonlinear over time, and it is apparent that multiple substrate can bind to the enzyme, resulting in substrate inhibition (Barr et al., 2014). MM kinetics requires a single active site per enzyme, and it also requires each site to operate independently from others in a homodimeric protein.
In this article, we have used three enzyme systems—human liver S9 fraction, human liver cytosol (HLC), and purified expressed human AOX (HAO)—to monitor product formation over a 240-minute time course for six substrates. We evaluate whether product is formed at a constant rate over the time course, which we define as a linear time course, or if the enzyme changes rate over time (nonlinear). Furthermore, since oxygen plays an important role in the enzyme cycle as the ultimate electron acceptor (Pryde et al., 2010), we check for any loss of activity related to oxygen consumption or reduction during the catalytic cycle by using superoxide dismutase (SOD) and catalase to remove ROS and determine the affinity of oxygen for human AO.
Materials and Methods
N-(2-dimethylamino)ethyl)acridine-4-carboxamide (DACA) was synthesized as described previously (Paragas et al., 2017b). O6-benzylguanine (O6BG) and zaleplon were purchased from Toronto Research Chemicals (North York, ON), zoniporide and dantrolene from Cayman Chemical Company (Ann Arbor, MI), BIBX1382 from Tocris Bioscience (Bristol, UK), and internal standards (phenacetin and 2-methly-4(3H)-quinazolinone), phthalazine, protocatechuic acid, protocatechuate 3,4-dioxygenase (Pseudomonas spp.), glucose oxidase (Aspergillus spp.), glucose, catalase (bovine liver), and SOD (bovine erythrocytes) were purchased from Sigma-Aldrich (St. Louis, MO). The standard metabolites were synthesized and purified as previously described (Paragas et al., 2017b) except 1-phthalazinone, which was purchased from Sigma-Aldrich. 5-Nitroquinoline was purchased from TCI America (Portland, OR). The monobasic potassium phosphate, dibasic potassium phosphate, and EDTA used for the potassium phosphate buffer were purchased from JT Baker (Center Valley, PA). Human liver S9 fraction, pooled from 20 donors (gender ratio not specified, lot no. 3212595), was purchaced from BD Gentest (Corning, NY). HLC, pooled from 50 individual donors (30 men, 20 women, lot no. 1410012), was purchased from XenoTech (Lenexa, KS). Expression and purification of HAO were performed according to the method previously described (Alfaro et al., 2009; Paragas et al., 2017b). The total amount of AOX in HLC and HAO was quantified by liquid chromatography-tandem mass spectrometry (LC-MS/MS) (Barr et al., 2013).
General Incubation Conditions.
Each incubation vial contained five times the Km amount of each substrate in 25 mM potassium phosphate buffer (pH 7.4) containing 0.1 mM EDTA. Samples were preincubated for 5 minutes at 37°C. The reaction was started by adding the HLC (0.0051 μM final AO concentration) or HAO (0.0192–0.043 μM). Total reaction volume was 3 ml, and 200 μl of the reaction vial was taken out and quenched immediately at times 0, 2, 4, 10, 20, 30, 45, 60, 120, and 240 minutes. The time points for phthalazine were slightly different—0, 0.5, 1, 1.5, 2, 2.5, 3, 4, 5, 10, 20, 45, 75, 135, and 240 minutes—because of its immediate transition to nonlinearity. Samples were quenched using 50 μl of 1 M formic acid containing known concentration of IS (either phenacetin or 2-methly-4(3H)-quinazolinone). Incubation with the human liver S9 fraction (20 mg/ml) was done only for the substrate O6BG as an example to check the results in a more intact cellular fraction. The samples were then centrifuged at 16,100g for 10 minutes in an Eppendorf centrifuge 5415D, and the supernatant was collected for LC-MS/MS. For experiments done to check the effect of ROS, the incubation conditions were similar, except 250 U/ml catalase and 250 U/ml of SOD were added to the reaction before preincubation. The same was done for reactions in which 5-nitroquinoline (5NQ) was used. Five times the Km amount of 5NQ (200 μM) in the presence of oxygen was added to the reaction before the preincubation. All the experiments were done in triplicates, and the goodness of fits were assessed using the Akaike Information Criteria (AIC) values.
Oxygen Km Calculation.
The Km for oxygen was measured using saturating concentration of phathalazine. HLC was incubated with protocatechuate 3,4-dioxygenase (1 U/ml) and protocathechuic acid (20 mM). The oxygen concentration was monitored using Robust oxygen probe (Pyro Science, Aachen, Germany). Aliquots were collected when the needed oxygen concentration was reached and added to a vial containing 50 mM phthalazine. The phthalazine assay was incubated at 37°C for 2.5 minutes. The final reaction volume was 100 μl. The reaction was quenched by the addition of 25 μl of 1 M formic acid containing 25 μM phenacetin as internal standard.
Data Analysis.
Numerical fitting in Mathematica 11.0.1.0 (Wolfram Research, Champaign, IL) was performed using the NDSolve function with MaxSteps → 10000 and PrecisionGoal → ∞; k1 was fixed to 270 μM s−1, and k2 was set to k1 × Km for each substrate. Model fitting was done using the NonlinearModelFit function with 1/Y weighting. Goodness of fit was evaluated by AIC and RSquared commands. Data set simulation was done using the rate constants derived from the numerical fitting. GraphPad Prism 7.0c (GraphPad Software Inc., San Diego, CA) was used for developing saturation curves. (Fig. 4); the graphical results of the fits are given for all substrates in the supplemental information (Supplemental Fig. 1). Several substrate inhibition models were also developed (Supplemental Fig. 2). These models were tested on two of our substrates, which were reported to exhibit substrate inhibition, DACA and phthalazine (Obach et al., 2004; Paragas et al., 2017b). The fits to these models were either almost identical to the MAM or could not fit the data points well (Supplemental Fig. 3; Supplemental Table 1).
Fig. 4.
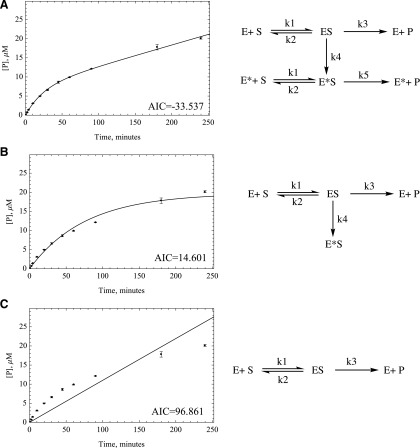
Two different kinetic models were developed to compare the numerical fitting of time-course data with MM. (A) MM model, (B) dead enzyme model, (C) MAM. Akaike values were provided by Mathematica to compare the goodness of fit, proving that MAM is the best model to fit the time-course data for most substrates except for zoniporide. Data- fitting plots for O6BG are provided next to each kinetic scheme for comparison. The Akaike values for O6BG are provided on the bottom right side of each plot.
Liquid Chromatography-Mass Spectrometry.
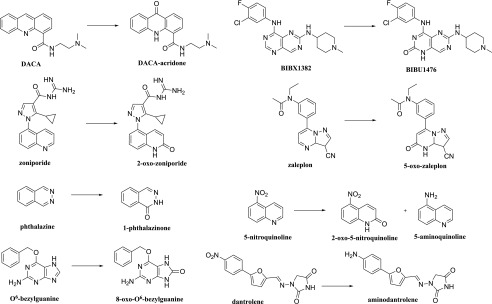
Samples were analyzed using an LC-20AD series high-performance LC system (Shimadzu, Columbia, MD) fitted with an HTC PAL autosampler (LEAP Technologies, Carrboro, NC). Chromatography was performed using two columns, a Luna C18 column (50 × 2.0 mm, 5 μm; Phenomenex, Torrance, CA) and a Luna C18 column (100 × 2.0 mm, 5 μm; Phenomenex). Mobile phase A consisted of 0.05% (by volume) formic acid and 0.2% acetic acid (MilliporeSigma, Billerica, MA) in water, and mobile phase B comprised 90% acetonitrile (MilliporeSigma), 9.9% water, and 0.1% formic acid (Fischer Scientific, Pittsburgh, PA). The quantitation was conducted on an API 4000 Q-Trap MS system (Applied Biosystems/MDS Sciex, Foster City, CA) with turbospray electro spray ionization operating in positive ion mode. For O6BG and 8-oxo-O6BG, the initial condition was 10% mobile phase B and 90% mobile phase A for 0.3 minutes. The concentration of mobile phase B was ramped up to 95% at 2.2 minutes and held constant for 0.1 minutes, followed by a linear gradient back to 10% B for 0.9 minute. For DACA, zaleplon, zoniporide, and BIBX1382, together with their respective metabolites, the initial condition was 10% mobile phase B and 90% mobile phase A until 0.3 minute. The concentration of mobile phase B was ramped up to 75% at 2.2 minutes and held constant for 0.1 minutes before ramping down to 10% again at 3.1 minutes and held constant for 0.9 minutes. For zaleplon, the initial condition until 0.3 minute was 10% mobile phase B and 90% mobile phase A. The concentration of mobile phase B then ramps up to 95% at 2.2 minutes and is held constant for 0.1 minute before ramping down to 10% again at 3.1 minutes and held constant for 0.9 minutes. For phthalazine, the initial condition until 2 minutes was 10% mobile phase B and 90% mobile phase A. The concentration of mobile phase B then ramps up to 80% at 8 minutes and is held constant for 0.5 minute before ramping down to 10% again at 9 minutes and held constant for 1 minute. The MS tuning parameters used for all the compounds were as follows: collision gas, medium; curtain gas, 20; ion spray voltage 4900; ion source gas 1, 35; ion source gas 2, 55; desolvation temperature 600 degree Celsius; declustering potential, 70; entrance potential, 10; cell exit potential, 15; and the collision energy, 25 for O6BG, DACA, zaleplon, and zoniporide. The only differing factor for BIBX and phthalazine was the collision energy, which were 65 and 35, respectively. The flow rate for O6BG, DACA, zoniporide, and BIBX (including their respective metabolites) was 0.4 ml/min. The flow rate for zaleplon and phthalazine, together with their corresponding metabolites, was 0.3 ml/min and 0.35 ml/min, respectively. The substrates and metabolites were detected using multiple reaction monitoring mode by monitoring the following m/z transitions: 2-oxo-zoniporide, 337 → 278 (Dalvie et al., 2010b); DACA-acridone, 310.2 → 265.0 (Barr and Jones, 2013); 8-oxo-O6BG, 258.2 → 91 (Barr et al., 2015); 5-oxo-zaleplon, 322.3 → 280.1 (Hutzler et al., 2012); BIBU1476, 404.1 → 373.1; 3-oxo-XK469, 361.2 → 315; 1-phthalazinone, 147.1 → 118; aminodantrolene, 285.15 → 186.0 (Amano et al., 2018); and the internal standards were either 2-methyl-4(3H)-quinazolinone 161.0 → 120.0 or phenacetin 180.2 → 110.1, as specified. All the metabolic reactions are summarized in (Fig. 1).
Fig. 1.
Summary of AOX-catalyzed reactions for the substrates used in this study.
Results
Time Course.
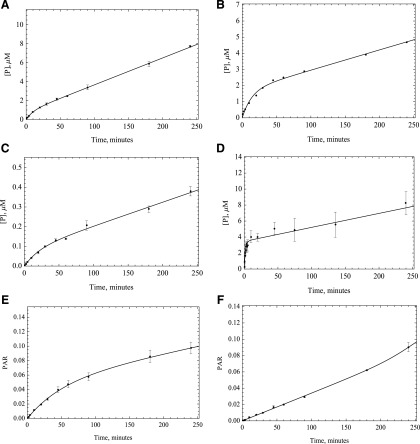
The data indicate that AOX catalysis rates are not constant over time, and in most cases, the enzyme appears to be less active as time progresses, depending on the substrate. For example, in the case of phthalazine, the linear range of enzymatic activity is quite short (less than 3 minutes), and in other instances, such as zoniporide, the enzymatic activity remains almost linear and may even increase slightly over 240-minute incubation time (Fig. 2). It should be noted that we do not have metabolic standards for BIBX1382 and zoniporide, so the rate constants are not accurate. These compounds are included since they support that most reactions are nonlinear over time. For these compounds, we report peak area ratio instead of micromoles per minute.
Fig. 2.
Five times the Km amount of the substrates: (A) O6BG, (B) DACA, (C) zaleplon, (D) phthalazine (E) BIBX1382, and (F) zoniporide were incubated with HLC (0.0051 μM AO) at 37°C, and samples were quenched at different time points over 240 minutes (n = 3, P < 0.001). Data fitting was performed using the MAM. Based on the results, unlike the MM assumption, enzyme activity is not linear over time.
A source of purified enzyme was used to confirm that the data from HLC are mainly the result of AOX activity and no other enzyme sources in liver cytosol. From comparing the plots for both enzyme sources, it is evident that the linearity of both sets are very similar, suggesting that the nonlinearity in time is the result of change in the activity of AOX (Fig. 3). The results from incubation of O6BG with S9 fraction shows that the same mechanism persists even in a more intact cell system (Supplemental Fig. 4).
Fig. 3.
Five times the Km amount of the substrates: (A) O6BG, (B) DACA, (C) zaleplon, (D) phthalazine, (E) BIBX1382, and (F) zoniporide were incubated with purified expressed human AOX (HAO, 0.0192 μM) in the same way as HLC to compare the time-course plots and ensure that AOX is the enzyme responsible for metabolism. Fitting to product formation was performed using the MAM (n = 3, P < 0.001).
Data Fitting Using Mathematica.
The data were fitted to three different kinetic models, namely, Michaelis-Menten (MM), dead model, and the modulated activity model (MAM) (Fig. 4). The assumption for MM kinetics is that the enzyme produces product in a linear fashion over time. This is obviously not the case, and we could not get a good fit for this model to our results. For the dead model, the differential equations are solved based on the kinetic scheme that suggests an irreversible loss of enzymatic activity over time. Finally, we tested a model in which it is assumed that the enzyme is altered over time to have a slower rate of reaction and therefore runs with a lower efficiency after a certain time. This last model could be a result of changes in the enzyme, such as a slow conformational change or chemical modification, such as oxidation of amino acids by ROS.
Although in many cases the MM model gives a visually acceptable fit, the AIC values predict that the MAM, in which the enzyme activity is altered over time, is the kinetic model that describes the enzymatic behavior best, with zoniporide the only exception. The importance of using the right model can be further emphasized by seeing up to almost 40-fold difference between the rate constants related to each model in HAO or HLC (Tables 1 and 2). The differences between these rate constants are substrate-specific; thus, scaling is not an option, and one must use the correct model to get a correct intrinsic clearance. Based on the assumption that the fast initial rate (k3) is what happens in the in vivo situation, we can use the intrinsic clearance (V/K) and then use eq. 1 to scale up the calculations to clearance per body weight. In addition, we have also done the calculations with k5 instead of k3 to present how missing the fast initial rate because of experimental errors in choosing the linear portion of the time-course plot may lead to underestimation of clearance by using the apparent k3, which will be similar to k5:
 |
(1) |
The amount of AOX in the liver in the preceding formula was previously calculated in our laboratory to be 21–40 pmol of AOX/mg liver, and we have used the average amount for our calculations (Barr et al., 2013). We have provided the intrinsic clearance in HAO for MAM in comparison with the linear model and the in vivo data (Table 3). The data show a significant improvement of in vitro clearance for the MAM. This difference becomes increasingly noticeable with longer incubation times. Unfortunately, the number of the substrates that we were able to calculate the intrinsic clearance for are few; however, the MAM data show a great improvement for all three substrates in comparison with what was previously reported in the literature (Zientek et al., 2010).
TABLE 1.
Rate constants related to each model for different substrates in human liver cytosol
| Substrate | Rate Constants | MAM | Dead Model | MM |
|---|---|---|---|---|
| Liters/min | ||||
| O6BG | k3 | 25.444 | 12.954 | 8.691 |
| k4 | 0.057 | 0.006 | — | |
| k5 | 13.708 | — | — | |
| DACA | k3 | 33.004 | 19.449 | 6.209 |
| k4 | 0.044 | 0.024 | — | |
| k5 | 6.086 | — | — | |
| Zaleplon | k3 | 1.238 | 0.853 | 0.46 |
| k4 | 0.028 | 0.011 | — | |
| k5 | 0.604 | — | — | |
| Phthalazine | k3 | 466.834 | 351.727 | 11.086 |
| k4/ | 0.335 | 0.366 | — | |
| k5 | 8.523 | — | — | |
| BIBXa | k3 | 0.279 | 0.253 | 0.125 |
| k4 | 0.012 | 0.012 | — | |
| k5 | 0.097 | — | — | |
| Zoniporidea | k3 | 0.082 | 0.079 | 0.085 |
| k4 | −0.023 | −0.001 | — | |
| k5 | 0.163 | — | — |
DACA, N-(2-dimethylamino)ethyl)acridine-4-carboxamide; MAM, modulated activity model; MM, Michaelis-Menten; O6BG, O6-benzylguanine.
Rate constants are based on peak area ratio (PAR).
TABLE 2.
Rate constants related to each model for different substrates in purified expressed human aldehyde oxidase (HAO)
| Substrate | Rate Constants | MAM | Dead model | MM |
|---|---|---|---|---|
| Liters/min | ||||
| O6BG | k3 | 21.955 | 16.154 | 6.896 |
| k4 | 0.025 | 0.016 | — | |
| k5 | 7.003 | — | — | |
| DACA | k3 | 23.282 | 20.353 | 6.307 |
| k4 | 0.020 | 0.025 | — | |
| k5 | 3.577 | — | — | |
| Zaleplon | k3 | 6.248 | 3.387 | 1.660 |
| k4 | 0.044 | 0.013 | — | |
| k5 | 2.152 | — | — | |
| Phthalazine | k3 | 167.355 | 79.953 | 4.403 |
| k4 | 0.489 | 0.246 | — | |
| k5 | 5.195 | — | — | |
| BIBX1382a | k3 | 5.971 | 2.673 | 1.679 |
| k4 | 0.070 | 0.012 | — | |
| k5 | 2.157 | — | — | |
| Zoniporidea | k3 | 0.412 | 0.412 | 0.400 |
| k4 | −0.0002 | 0.0005 | — | |
| k5 | 1.825 | — | — |
DACA, N-(2-dimethylamino)ethyl)acridine-4-carboxamide; MAM, modulated activity model; MM, Michaelis-Menten; O6BG, O6-benzylguanine.
Rate constants are based on peak area ratio (PAR).
TABLE 3.
Comparison between intrinsic clearance in HAO between different models in vitro and the in vivo intrinsic clearance in literature
| Drug | Cl’int,AO (In Vitro, ml/(min.kg)) |
Cl’int,AO (In Vivo, ml/(min. kg)) | Reference | ||
|---|---|---|---|---|---|
| MAM (using k3) | MAM (using k5) | MM | |||
| O6BG | 202 | 65 | 64 | 360 | Dolan et al., 1998 |
| DACA | 1183 | 182 | 320 | 3600 | Kestell et al., 1999 |
| Zaleplon | 43 | 15 | 11 | 65 | Rosen et al., 1999 |
DACA, N-(2-dimethylamino)ethyl)acridine-4-carboxamide; HAO, purified expressed human aldehyde oxidase; MAM, modulated activity model; MM, Michaelis-Menten; O6BG, O6-benzylguanine.
Some Potential Reasons for Nonlinearity in Enzyme Activity.
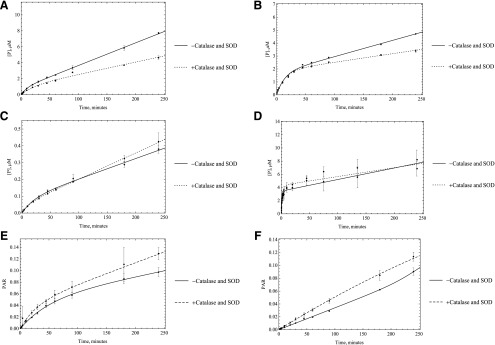
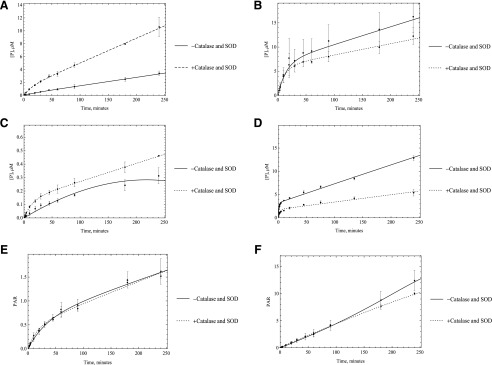
Several mechanisms could be responsible for this loss of activity. First, we hypothesized that the loss of activity was a result of the enzyme inactivation by the ROS super oxide and hydrogen peroxide, which is generated during the catalytic cycle. To test this hypothesis, we used superoxide dismutase and catalase. Catalase was used to remove hydrogen peroxide, and superoxide is removed by SOD. By using these two enzyme sources, we expected to see an increase in the linearity of enzyme activity. No significant change in enzyme linearity was observed in either HLC or HAO; however, some inconsistencies were observed between HLC and HAO activities with or without using SOD and catalase. In the case of HLC, all substrates showed some to very little improvement in activity except O6BG, but in the case of HAO, almost the opposite trend was observed. Unlike what happened in HLC, the activity decreased with adding oxygen species scavengers for DACA and zoniporide, but it increased for O6BG. In the case of zaleplon and BIBX, there was little to no improvement in activity, the same as what was observed in HLC (Figs. 5 and 6). What was consistent was that in any case no improvement in linearity of the time-course plots was observed. Given these results it is not likely that ROS are not the main reason for nonlinear kinetics, although the ROS could modify the enzyme before diffusing away from the flavin-binding site.
Fig. 5.
Catalase and SOD (250 U/ml) were used to remove ROS that were suspected to affect the enzymatic activity. HLC (0.0051 M AO) was used to start the reactions with A) O6BG, B) DACA, C) zaleplon, D) phthalazine E) BIBX1382, and F) zoniporide, (n = 3, P < 0.001). No significant change in linearity of the enzyme was observed once these reagents were used, suggesting that ROS are not the reason behind the decrease in enzymatic efficacy.
Fig. 6.
Catalase and SOD (250 U/ml) were used to remove ROS suspected to affect the enzymatic activity for purified HAO incubated with A) O6BG, B) DACA, C) zaleplon, D) phthalazine E) BIBX1382, and F) zoniporide. No significant change in linearity of the enzyme was observed once these reagents were used, suggesting that ROS are not the reason for the decrease in enzymatic efficacy.
Substrate Depletion over Time.
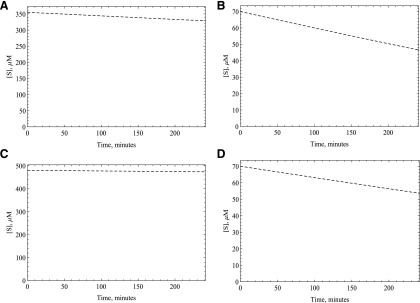
Another potential reason for the nonlinearity is a substantial decrease in the oxidative substrate concentration. The amount of substrate disappearance as calculated by the amount of product formed indicates that the amount of substrate consumed was less than 10% of the total substrate in most cases. We have simulated substrate disappearance to demonstrate this (Fig. 7), assuming 1 M of product is formed from 1 M of substrate. This should be the same even for the substrates for which we do not have the standards since we have used five times the Km amount for all the substrates. This indicates that substrate depletion is not significant for the oxidative substrates; however, the reductive substrate oxygen could also be significantly depleted. In our laboratory, and under the conditions of our reaction, the oxygen concentration is very close to 213 μM. Since one to two oxygen molecules are consumed per catalytic cycle, it appears that only a small fraction of the substrate oxygen is consumed; however, one might still see nonlinearity over time if the Km value for oxygen is very high. We measured the Km value to be around 2 μM for human AOX. To double-check our results, we have used the data published earlier for a reductive substrate of AOX, dantrolene (Amano et al., 2018). Since dantrolene gets reduced by AOX to aminodentrolene by a three-step process similar to 5NQ (Paragas et al., 2017a), it will compete for the reduction site of the enzyme with oxygen. We have used the Kmapp reported in this article for dantrolene (65 μM), and the Km of this substrate was also measured in our laboratory under anaerobic condition (4.7 μM, Paragas, Abbasi, Rodgers and Jones, manuscript in preparation). This enabled us to calculate the Ki for oxygen to be approximately 15.6 μM by using the equation Kmapp = Km (1 + [I]/Ki), assuming the oxygen concentration, [I], is close to 213 μM when the atmospheric pressure ranges from 765 to 780 mm Hg at 37°C (Weiss, 1970). Since either way the oxygen Km is much smaller than its concentration present during the reaction, depletion of the substrate oxygen is not a factor in the nonlinearity.
Fig. 7.
Substrate consumption simulation for (A) O6BG, (B) DACA, (C) zaleplon, and (D) phthalazine were done using the kinetic parameters obtained from fitting the product formation data in purified expressed human AOX (HAO) to the MAM using Mathematica. This could not be done for the substrates for which we do not have the product standards.
Using 5NQ as a Reductive Substrate.
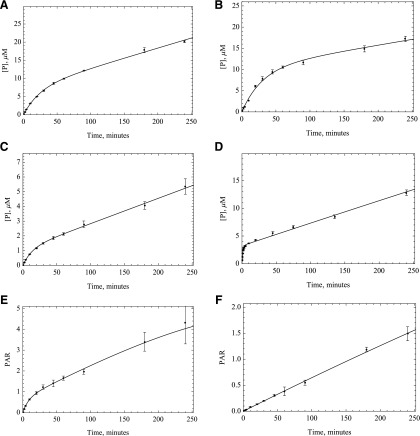
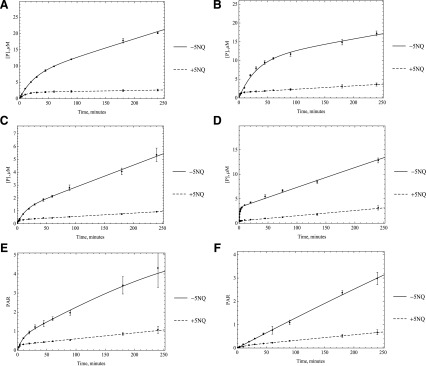
A third hypothesis is that maybe the enzyme is slow to reduce oxygen and that the fast rate is an initial rate before the complete reduction of the enzyme. This problem should be more evident in the case of substrates with a high turnover rate, and to some extent, this is what we observe. To test this hypothesis, we used 5NQ as a reducing substrate to substitute for oxygen in the enzyme cycle. Since 5NQ reduction is a six-electron reduction, we would observe a change in the enzyme activity if electron transfer has become rate-limiting once we substitute this substrate for molecular oxygen, which needs only two electrons to be reduced. 5NQ is reduced by AOX to 5-aminoquinoline. Unlike its isomer, 6-nitroquinoline, 5NQ can be both oxidized and reduced by AOX under normal oxygen condition (Rajapakse et al., 2013). Time-course results indicate that we do see a change in activity with alternate reducing substrate as one would expect if electrons are transferred more slowly (Fig. 8). This finding is consistent with our previous results showing that once an oxidative substrate is present, 5NQ has an increased affinity for the flavin site, where it can compete with oxygen (Paragas et al., 2017a), which can lead to a disruption in enzyme oxidation and may be the reason for the observed loss in enzyme activity. Although this is consistent with the data, the complicated kinetics means that numerous possibilities are likely since a few factors can affect electron flow through the enzyme.
Fig. 8.
Five times the Km amount of the substrates including A) O6BG, B) DACA, C) zaleplon, D) phthalazine E) BIBX1382, and F) zoniporide were used to start the reaction (n = 3, P < 0.001).
Discussion
After monitoring the changes in AOX activity over time in both HAO and HLC for six oxidative substrates, we found that the enzyme does not behave linearly over time for most substrates. We used three different kinetic models to determine what was likely happening kinetically over time. Initially, we assumed that the enzyme loses its activity completely over time; in other words, it dies. This leads to better fits than the MM model but still does not describe the data very well. The next hypothesis was that the enzyme is altered over time and therefore runs with a lower efficiency after a certain period; this gave the best fits for all the substrates except zoniporide. Representative fits to each model, for the substrate O6BG, are shown in Fig. 4 and for all substrate in the Supplemental Material.
Next, we checked for possible reasons behind the loss of activity in AOX. Although it has been mentioned before that superoxide has little effect on biologic molecules and enzymes, there have been instances, like cytochrome c, where it does compromise enzyme activity often by oxidation of thiols (Searle and Willson, 1980; Kundu et al., 2007). To determine whether ROS altered enzyme activity, we decided to check also the effect by removing them with SOD and catalase. Based on the results, no significant change in enzyme linearity was observed with or without using ROS scavengers, showing that ROS are not altering enzymatic behavior.
A substantial decrease in substrate concentration can also lead to similar changes in enzyme linearity, but this hypothesis was rejected by determining the amount of oxidative substrate depletion. Simulation results for the substrates show that most of the substrates are not extensively consumed from their initial concentration and since the initial concentrations was five times the Km, this should not lead to nonlinear kinetics (Fig. 7). As for the reductive substrate of AOX, O2 (Garattini et al., 2003; Pryde et al., 2010), we have determined that its Km is approximately 2–16 μM, and based on the atmospheric pressure where the experiment was done, the concentration of oxygen is around 213 μM. We know that among the substrates that we used, even the substrate with the fastest turnover rate would consume only between 20 and 40 μmol of oxygen, leaving the concentration in the reaction vial more than five times the Km, and the reaction would be zero order with respect to oxygen.
To regenerate AOX after oxidation of substrate, we need to transfer electrons from the Moco through the iron-sulfur clusters to the flavin adenine dinucleotide before we reduce oxygen. If this electron transfer path is slow, reduced AOX will build up, and reduction of oxygen will become the rate-limiting step. This is consistent with the fact that a kinetic isotope effect was observed upon substrate oxidation on V/K but not Vmax (Alfaro et al., 2009). This hypothesis is also consistent with our time-course plots, where the fast initial rate decreases as increasingly more enzymes get trapped in their reduced state. To test this hypothesis, we used 5NQ as a source of reductive substrate that will compete with oxygen in accepting electrons from AOX to check whether a disruption of electron transfer is the reason for the loss in enzyme activity. Since 5NQ needs six electrons to be reduced to 5-aminoquinoline (Paragas et al., 2017a), this should change the rate of the second kinetic phase after the enzyme becomes reduced. The data in Fig. 8 are consistent with the slowing of electron transfer and a change in the rate-limiting step from oxidation to reduction; however, one caveat to this conclusion is that the rates for the slow reaction (k5) for all the substrates should be the same since the rate-limiting step on the second kinetic phase of the reaction is the oxidation of enzyme by O2 and should be substrate-independent; however, looking at the k5 values for the substrates, we can see up to a 3-fold difference. In addition to that, if this were the case, we would also expect similar-looking plots for substrates that exhibit similar k3 values, such as DACA and O6BG; but, looking at the plots, we can see O6BG time-course plot looks much more linear than DACA. This can be explained if we consider the effect of substrate inhibition. It appears that O6BG does not show any substrate inhibition (Barr et al., 2015), whereas the reported KI value for DACA was 91 μM (Paragas et al., 2017b). We hypothesize that the second substrate molecule would bind to the reduction site and therefore make the reduction happen even more slowly, the same effect we saw by using a reductive substrate 5NQ, and that is why the k5 value for DACA is lower than that of O6BG. It is worth mentioning that phthalazine also exhibits substrate inhibition, and the reported value of KI for this substrate is 250 μM (Obach et al., 2004). Since DACA is a more effective inhibitor of electron transfer to oxygen compared with pthalazine, however, DACA has a slower rate in the second kinetic phase. Attempts to fit substrate inhibition did not improve the overall fit, as might be expected, given that the model already can fit each single substrate data set very well. The fits are given in Supplemental Fig. 2 for O-6BG.
In this work, the intrinsic clearance values were also compared using the rate constants derived from the MAM and MM models. The results show a significant improvement of clearance estimation for MAM. Given that the initial rate calculations account only for how the enzyme behaves for a very short period, longer incubation times are needed for a more comprehensive assessment of the enzyme kinetics. Using the MM model leads to a considerable underprediction of intrinsic clearance in vitro owing to negligence of the fast initial turnover rate. One assumption behind the residual underprediction using MAM can be referred to the involvement of extrahepatic clearance. This factor has also been considered for in silico estimation of intrinsic clearance by AO (Jones and Korzekwa, 2013), and the in vivo-in vitro correlation plot is consistant with this assumption (Supplemental Fig. 5). We admit that we cannot be certain this is the case, although the known underestimation of V/K supports this conclusion. Furthermore, the rate of reaction, to some extent, can be predicted by the reactivity of the substrate that is oxidized, whereas if the second phase is oxidation of the enzyme, no such correlation would be expected to exist (Zhang et al., 2018).
Overall, the main goal of this article is to show that almost all AOX-catalyzed reactions are nonlinear over time and that ignoring this leads to an underestimation of clearance. We have shown that there can be up to 40-fold underprediction of the reaction rate by simply assuming linear kinetics. We believe that the constant underprediction of drug clearance by AOX is due to the rapid slowing of the reaction rate once the reaction is started and that even short incubations would not lead to an accurate determination of the kcat. In this study, we are using numerical fitting to get the closest approximation of the real initial rate value by fitting the metabolite formation over 4-hour period instead of only using the short “linear” region of the plot. MAM seems to do well in describing the enzymatic pathway in which the enzyme’s life is divided into two stages, the first being a fully active enzyme, the second being the stage where the enzyme forms metabolite at a slower rate.
Acknowledgments
We thank Dr. Dmitri R. Davydov for helping with oxygen Km measurements.
Abbreviations
- 5NQ
5-nitroquinoline
- AIC
Akaike information criterion
- AOX
aldehyde oxidase
- CLint
intrinsic clearance
- DACA
N-(2-dimethylamino)ethyl)acridine-4-carboxamide
- HAO
purified expressed human aldehyde oxidase
- HLC
human liver cytosol
- KI
dissociation constant for substrate inhibition
- Ki
equilibrium dissociation constant for a competitive inhibitor
- Km
Michaelis-Menten constant
- LC-MS/MS
liquid chromatography-tandem mass spectrometry
- MAM
modulated activity model
- MM
Michaelis-Menten
- MoCo
molybdenum pterin cofactor
- O6BG
O6-benzylguanine
- P450
cytochrome P450
- ROS
reactive oxygen species
- SOD
superoxide dismutase
- VMAX
maximum velocity
- V/K
intrinsic clearance
Authorship Contributions
Participation in research design: Abbasi, Rodgers, Jones.
Performed data analysis: Abbasi, Paragas, Joswig-Jones.
Wrote or contributed to the writing of the manuscript: Abbasi, Paragas, Jones.
Footnotes
This work was supported by the National Institute of General Medical Sciences [GM100874].
 This article has supplemental material available at dmd.aspetjournals.org.
References
- Alfaro JF, Joswig-Jones CA, Ouyang W, Nichols J, Crouch GJ, Jones JP. (2009) Purification and mechanism of human aldehyde oxidase expressed in Escherichia coli. Drug Metab Dispos 37:2393–2398. [DOI] [PMC free article] [PubMed] [Google Scholar]
- Amano T, Fukami T, Ogiso T, Hirose D, Jones JP, Taniguchi T, Nakajima M. (2018) Identification of enzymes responsible for dantrolene metabolism in the human liver: a clue to uncover the cause of liver injury. Biochem Pharmacol 151:69–78. [DOI] [PubMed] [Google Scholar]
- Barr J, Choughule K, and Jones J (2014) Enzyme kinetics, inhibition, and regioselectivity of aldehyde oxidase, in Enzyme Kinetics in Drug Metabolism: Fundamentals and Applications (Nagar S, Argikar U, and Tweedie D eds) pp 167–186, Humana Press, New York. [Google Scholar]
- Barr JT, Jones JP. (2013) Evidence for substrate-dependent inhibition profiles for human liver aldehyde oxidase. Drug Metab Dispos 41:24–29. [DOI] [PMC free article] [PubMed] [Google Scholar]
- Barr JT, Jones JP, Joswig-Jones CA, Rock DA. (2013) Absolute quantification of aldehyde oxidase protein in human liver using liquid chromatography-tandem mass spectrometry. Mol Pharm 10:3842–3849. [DOI] [PMC free article] [PubMed] [Google Scholar]
- Barr JT, Jones JP, Oberlies NH, Paine MF. (2015) Inhibition of human aldehyde oxidase activity by diet-derived constituents: structural influence, enzyme-ligand interactions, and clinical relevance. Drug Metab Dispos 43:34–41. [DOI] [PMC free article] [PubMed] [Google Scholar]
- Crouch RD, Hutzler JM, Daniels JS. (2018) A novel in vitro allometric scaling methodology for aldehyde oxidase substrates to enable selection of appropriate species for traditional allometry. Xenobiotica 48:219–231. [DOI] [PMC free article] [PubMed] [Google Scholar]
- Dalvie D, Kang P, Loi CM, Goulet L, and Nair S (2010a) Influence of heteroaromatic rings on ADME properties of drugs, in Metabolism, Pharmacokinetics and Toxicity of Functional Groups: Impact of Chemical Building Blocks on ADMET (Smith DA ed) Royal Society of Chemistry, Cambridge, UK.
- Dalvie D, Zhang C, Chen W, Smolarek T, Obach RS, Loi C-M. (2010b) Cross-species comparison of the metabolism and excretion of zoniporide: contribution of aldehyde oxidase to interspecies differences. Drug Metab Dispos 38:641–654. [DOI] [PubMed] [Google Scholar]
- Dolan ME, Roy SK, Fasanmade AA, Paras PR, Schilsky RL, Ratain MJ. (1998) O6-benzylguanine in humans: metabolic, pharmacokinetic, and pharmacodynamic findings. Journal of Clinical Oncology 16:1803–1810. [DOI] [PubMed] [Google Scholar]
- Garattini E, Fratelli M, Terao M. (2008) Mammalian aldehyde oxidases: genetics, evolution and biochemistry. Cell Mol Life Sci 65:1019–1048. [DOI] [PMC free article] [PubMed] [Google Scholar]
- Garattini E, Mendel R, Romão MJ, Wright R, Terao M. (2003) Mammalian molybdo-flavoenzymes, an expanding family of proteins: structure, genetics, regulation, function and pathophysiology. Biochem J 372:15–32. [DOI] [PMC free article] [PubMed] [Google Scholar]
- Garattini E, Terao M. (2012) The role of aldehyde oxidase in drug metabolism. Expert Opin Drug Metab Toxicol 8:487–503. [DOI] [PubMed] [Google Scholar]
- Hutzler JM, Tracy TS. (2002) Atypical kinetic profiles in drug metabolism reactions. Drug Metab Dispos 30:355–362. [DOI] [PubMed] [Google Scholar]
- Hutzler JM, Yang YS, Albaugh D, Fullenwider CL, Schmenk J, Fisher MB. (2012) Characterization of aldehyde oxidase enzyme activity in cryopreserved human hepatocytes. Drug Metab Dispos 40:267–275. [DOI] [PubMed] [Google Scholar]
- Jones JP, Korzekwa KR. (2013) Predicting intrinsic clearance for drugs and drug candidates metabolized by aldehyde oxidase. Mol Pharm 10:1262–1268. [DOI] [PMC free article] [PubMed] [Google Scholar]
- Kaye B, Offerman JL, Reid JL, Elliott HL, Hillis WS. (1984) A species difference in the presystemic metabolism of carbazeran in dog and man. Xenobiotica 14:935–945. [DOI] [PubMed] [Google Scholar]
- Kestell P, Dunlop IC, McCrystal MR, Evans BD, Paxton JW, Gamage RSKA, Baguley BC. (1999) Plasma pharmacokinetics of N-[2-(dimethylamino)ethyl]acridine-4-carboxamide in a phase I trial. Cancer Chemotherapy and Pharmacology 44:45–50. [DOI] [PubMed] [Google Scholar]
- Kitamura S, Tatsumi K. (1984) Involvement of liver aldehyde oxidase in the reduction of nicotinamide N-oxide. Biochem Biophys Res Commun 120:602–606. [DOI] [PubMed] [Google Scholar]
- Konishi K, Fukami T, Gotoh S, Nakajima M. (2017) Identification of enzymes responsible for nitrazepam metabolism and toxicity in human. Biochem Pharmacol 140:150–160. [DOI] [PubMed] [Google Scholar]
- Korzekwa KR, Krishnamachary N, Shou M, Ogai A, Parise RA, Rettie AE, Gonzalez FJ, Tracy TS. (1998) Evaluation of atypical cytochrome P450 kinetics with two-substrate models: evidence that multiple substrates can simultaneously bind to cytochrome P450 active sites. Biochemistry 37:4137–4147. [DOI] [PubMed] [Google Scholar]
- Krenitsky TA, Neil SM, Elion GB, Hitchings GH. (1972) A comparison of the specificities of xanthine oxidase and aldehyde oxidase. Arch Biochem Biophys 150:585–599. [DOI] [PubMed] [Google Scholar]
- Kundu TK, Hille R, Velayutham M, Zweier JL. (2007) Characterization of superoxide production from aldehyde oxidase: an important source of oxidants in biological tissues. Arch Biochem Biophys 460:113–121. [DOI] [PMC free article] [PubMed] [Google Scholar]
- Li H, Kundu TK, Zweier JL. (2009a) Characterization of the magnitude and mechanism of aldehyde oxidase-mediated nitric oxide production from nitrite. J Biol Chem 284:33850–33858. [DOI] [PMC free article] [PubMed] [Google Scholar]
- Li HT, Kundu TK, Zweier JL. (2009b) Aldehyde oxidase catalyzes nitrite reduction: an important nitric oxide producing pathway during ischemia. FASEB J 23. [Google Scholar]
- Lynch T, Price A. (2007) The effect of cytochrome P450 metabolism on drug response, interactions, and adverse effects. Am Fam Physician 76:391–396. [PubMed] [Google Scholar]
- Maia LB, Pereira V, Mira L, Moura JJ. (2015) Nitrite reductase activity of rat and human xanthine oxidase, xanthine dehydrogenase, and aldehyde oxidase: evaluation of their contribution to NO formation in vivo. Biochemistry 54:685–710. [DOI] [PubMed] [Google Scholar]
- Mendel RR. (2009) Cell biology of molybdenum. Biofactors 35:429–434. [DOI] [PubMed] [Google Scholar]
- Obach RS, Huynh P, Allen MC, Beedham C. (2004) Human liver aldehyde oxidase: inhibition by 239 drugs. J Clin Pharmacol 44:7–19. [DOI] [PubMed] [Google Scholar]
- Paragas EM, Humphreys SC, Min J, Joswig-Jones CA, Jones JP. (2017a) The two faces of aldehyde oxidase: oxidative and reductive transformations of 5-nitroquinoline. Biochem Pharmacol 145:210–217. [DOI] [PubMed] [Google Scholar]
- Paragas EM, Humphreys SC, Min J, Joswig-Jones CA, Leimkühler S, Jones JP. (2017b) ecoAO: a simple system for the study of human aldehyde oxidases role in drug metabolism. ACS Omega 2:4820–4827. [DOI] [PMC free article] [PubMed] [Google Scholar]
- Pryde DC, Dalvie D, Hu Q, Jones P, Obach RS, Tran T-D. (2010) Aldehyde oxidase: an enzyme of emerging importance in drug discovery. J Med Chem 53:8441–8460. [DOI] [PubMed] [Google Scholar]
- Rajapakse A, Linder C, Morrison RD, Sarkar U, Leigh ND, Barnes CL, Daniels JS, Gates KS. (2013) Enzymatic conversion of 6-nitroquinoline to the fluorophore 6-aminoquinoline selectively under hypoxic conditions. Chem Res Toxicol 26:555–563. [DOI] [PMC free article] [PubMed] [Google Scholar]
- Rosen AS, Fournié P, Darwish M, Danjou P, Troy SM. (1999) Zaleplon pharmacokinetics and absolute bioavailability. Biopharmaceutics & Drug Disposition 20:171–175. [DOI] [PubMed] [Google Scholar]
- Searle AJ, Willson RL. (1980) Glutathione peroxidase: effect of superoxide, hydroxyl and bromine free radicals on enzyme activity. Int J Radiat Biol Relat Stud Phys Chem Med 37:213–217. [DOI] [PubMed] [Google Scholar]
- Stoddart AM, Levine WG. (1992) Azoreductase activity by purified rabbit liver aldehyde oxidase. Biochem Pharmacol 43:2227–2235. [DOI] [PubMed] [Google Scholar]
- Weidert ER, Schoenborn SO, Cantu-Medellin N, Choughule KV, Jones JP, Kelley EE. (2014) Inhibition of xanthine oxidase by the aldehyde oxidase inhibitor raloxifene: implications for identifying molybdopterin nitrite reductases. Nitric Oxide 37:41–45. [DOI] [PMC free article] [PubMed] [Google Scholar]
- Weiss RF. (1970) The solubility of nitrogen, oxygen and argon in water and seawater. Deep-Sea Res 17:721–735. [Google Scholar]
- Zhang JW, Xiao W, Gao ZT, Yu ZT, Zhang JY. (2018) Metabolism of c-Met kinase inhibitors containing quinoline by aldehyde oxidase, electron donating and steric hindrance effect. Drug Metab Dispos 46:1847–1855. [DOI] [PubMed] [Google Scholar]
- Zientek M, Jiang Y, Youdim K, Obach RS. (2010) In vitro-in vivo correlation for intrinsic clearance for drugs metabolized by human aldehyde oxidase. Drug Metab Dispos 38:1322–1327. [DOI] [PubMed] [Google Scholar]


