Key Points
Question
Is peak expiratory flow (PEF) a clinically useful biometric indicator for degree of luminal obstruction and receipt of surgical intervention in idiopathic subglottic stenosis?
Findings
In this medical record review of 42 women, PEF was adequately sensitive and specific for predicting receipt of operative intervention when using a threshold of less than 4.4 liters per second (264 L/min). This spirometry measure compares favorably with the more complex measures of expiratory disproportion index and total peak flow.
Meaning
Measuring PEF is a simple, but valuable, clinical tool for monitoring progression of stenosis and predicting receipt of surgical intervention for idiopathic subglottic stenosis.
This medical record review of 42 patients compares the use of peak expiratory flow, expiratory disproportion index, and total peak flow measures for monitoring disease progression in patients with idiopathic subglottic stenosis.
Abstract
Importance
Because of the recurrent nature of idiopathic subglottic stenosis, routine follow-up is necessary for monitoring progression of stenosis. However, no easily accessible, standardized objective measure exists to monitor disease progression.
Objective
To determine whether peak expiratory flow (PEF) can be used as a reliable and easily accessible biometric indicator of disease progression relative to other validated spirometry measures in patients with idiopathic subglottic stenosis.
Design, Setting, and Participants
Prospectively collected data on PEF, expiratory disproportion index (EDI), and total peak flow (TPF) from 42 women with idiopathic subglottic stenosis without comorbid lower airway or parenchymal lung disease who were treated at a single tertiary referral center between 2014 and 2018 were analyzed. The mean follow-up period was 18.2 months (range, 2-40 months). Ten patients initially screened were not included in the analysis owing to comorbid glottic or supraglottic stenosis or nonidiopathic etiology.
Main Outcomes and Measures
Measurements of PEF, EDI, and TPF were taken at preoperative visits and at all other visits.
Results
Forty-two women (mean age, 51.5 years; 98% white [n = 41]) met the inclusion criteria. The area under the curve for PEF was 0.855 (95% CI, 0.784-0.926). The optimal cutoff value was 4.4 liters per second (264 L/min), with a sensitivity and specificity of 84.4% and 82.0%, respectively. The area under the curve for EDI was 0.853 (95% CI, 0.782-0.925). For TPF, this was 0.836 (95% CI, 0.757-0.916).
Conclusions and Relevance
This study provides evidence supporting the use of PEF as a simple, efficient, and accessible way of monitoring progression of idiopathic subglottic stenosis and predicting receipt of surgical intervention. Sensitivity and specificity of PEF were comparable to those of the more complex measures of TPF and EDI.
Introduction
Laryngotracheal stenosis (LTS) is a broad set of diagnoses encompassing a heterogeneous group of fibroinflammatory conditions relating to narrowing of the glottis, supraglottis, subglottis, and trachea.1 The subset of patients with isolated subglottic stenosis accounts for nearly half of LTS cases.2 Idiopathic subglottic stenosis (iSGS) is a rare and slowly progressive condition with an unknown primary cause that results in fibrosis of the subglottic airway. It generally presents in otherwise healthy middle-aged white women with symptoms of dyspnea and stridor.3,4,5,6
Current management of iSGS relies on a combination of surgical and adjuvant therapies based on physician preference and individual patient needs. Many patients can be treated successfully through endoscopic intervention, but owing to the recurrent nature of iSGS, greater than 85% of these patients required repeated intervention within 5 years.7 Routine follow-up is necessary to monitor for recurrence of stenosis between interventions and as a means of quantifying response to treatment.
The use of pulmonary function tests (PFTs) for the diagnosis of upper airway obstruction was first described in the 1960s, and several studies have since identified PFT values that can be used to follow gradual change in the degree of stenosis over time.8,9,10,11,12,13,14 In 2013, Nouraei et al9 established the expiratory disproportion index (EDI) as a highly sensitive and specific tool for differentiating LTS from other illnesses that present with similar symptoms, such as chronic obstructive pulmonary disease, asthma, and pulmonary fibrosis. In 2014, the same research group found strong correlations between treatment-related changes in total peak flow ([TPF]: peak expiratory flow [PEF] + peak inspiratory flow [PIF]) and the ratio of the area under the curve (AUC) of the flow-volume loop to forced vital capacity ([FVC]; ΔAUC total/FVC), with treatment-related changes in the stenosis.14 Given the complexity of these measures, we sought to validate the simple measurement of PEF rate as a biometric measure of the degree of luminal obstruction and the likely need for procedural intervention for iSGS. By design, our study population was limited to patients with iSGS as an explanatory trial maximizing the discriminating potential of spirometry testing in an ideal situation. Given the homogeneous nature of this population’s demographics and the tendency of the disease to follow a predictable course over time, the use of PFTs in evaluating these patients has the potential to reduce data variability and resolve small differences in the predictive abilities of the various spirometry values. The purpose of this study is to evaluate the ability of PEF, relative to the validated measures of TPF and EDI, to differentiate the degree of luminal obstruction and predict the receipt of surgical intervention in patients with iSGS.
Methods
Study Population
This study was approved by the institutional review board for Health Sciences Research at the University of Virginia (IRB-HSR No. 18128). Patient written informed consent was waived. Records of 52 adult patients referred for management of LTS between 2014 and 2018 were prospectively collected and retrospectively analyzed. Information about patient age, sex, medical comorbidities, tobacco use, disease etiology, and surgical history were obtained. Data regarding whether surgical intervention was recommended at each visit were also recorded. The decision to pursue operative intervention was based on a combination of patient symptoms and physical examination and laryngoscopy findings. The severity of subglottic stenosis was stratified endoscopically according to the Cotton-Myer grading system in which grade I tracheal stenosis refers to narrowing of the lumen of up to 50%, grade II refers to narrowing of 51% to 70%, grade III refers to narrowing of 71% to 99%, and grade IV refers to no detectable lumen.15 Spirometry performance was recorded from a digital Koko PC-based spirometer version 4.15 (nSpire Health) that is calibrated daily according to American Thoracic Society guidelines, and predicted values were calculated from the Hankinson spirometric reference set.16 Data were imported into IBM SPSS Statistics software (version 23) for analysis. Charts and graphs were created with Prism 7 for Mac OS X (GraphPad Software Inc).
The EDI and TPF Rate
The PEF was measured in liters per second and was reported as part of the standard spirometry output; PEF represents the maximum volume of air expired per minute or second during a single expiratory cycle. The EDI and TPF rate were calculated from each set of reported spirometry measurements. The EDI is the ratio of forced expiratory volume in 1 second (FEV1) measured in liters to PEF measured in liters per second multiplied by 100 (FEV1/PEF × 100).14 The TPF is the sum of the PEF and the absolute value of the PIF measured from flow-volume loop (TPF = PEF + |PIF|).12
Statistical Analysis
Variables are expressed as means, with 95% CIs, SDs, or binomial percentages as appropriate. To account for multiple measurements per patient, a mixed models analysis with compound symmetry covariance structure was used to analyze the effect of Cotton-Myer grade of stenosis on spirometry performance. A post hoc analysis of PEF, TPF, and EDI values was performed using receiver operating characteristic (ROC) curves to predict receipt of surgical intervention. This analysis was accomplished by ascribing spirometry values collected during clinic visits to binary outcome variables of operative intervention or no operative intervention within 2 months of the clinic visit. Optimal cutoff values for distinguishing the 2 groups were determined as the point on the ROC curve closest to (0,1), maximizing values for both sensitivity and specificity. The FEV1 was also included on the ROC curve as a comparative measurement known to be relatively unaffected by degree of extrathoracic airway obstruction.9 The AUCs for PEF, EDI, and TPF were compared with standardized ranges, in which 0.9 to 1.0 is considered excellent, 0.8 to 0.9 is good, 0.7 to 0.8 is fair, 0.6 to 0.7 is poor, and 0.5 to 0.6 is considered a failure.17 Preoperative and postoperative EDI, PEF, and TPF values were plotted, and means and percentage change were calculated.
Results
Patient Characteristics
Data from 52 patients were collected. Four patients were excluded from analysis owning to coexisting glottic or supraglottic stenosis, and 6 patients were excluded owing to nonidiopathic etiology of SGS. Demographic data from the remaining 42 patients with iSGS are summarized in the Table. All 42 patients were female. Forty-one patients were white, and 1 was Hispanic. Mean (SD) age at diagnosis was 51.5 (9.8) years. Twenty-five patients (60%) were obese (body mass index [BMI] calculated as weight in kilograms divided by height in meters squared, 30.0-34.9) or morbidly obese (BMI, >35.0). Four patients (10%) had a history of smoking, and none were current smokers. The study period ranged from 2 to 40 months per patient, with a mean follow-up period of 18.4 months.
Table. Demographic Data.
| Characteristic | Value (%)a |
|---|---|
| Patients with iSGS, No. | 42 |
| Sex | |
| Male | 0 |
| Female | 42 |
| Age, mean (range), y | 51.5 (32-72) |
| Weight, mean (range), kg | 89.4 (59-182) |
| Height, mean (range), cm | 163.2 (150-180) |
| Race | |
| White | 41 (98) |
| Hispanic | 1 (2) |
| BMI | |
| 20-24.9 (normal weight) | 7 (17) |
| 25-29.9 (overweight) | 10 (24) |
| 30-34.9 (obese) | 11 (26) |
| >35.0 (morbidly obese) | 14 (33) |
| Surgical interventions per patient, median (range), No. | 2 (0-7) |
| Smoking history | |
| Current | 0 |
| Former | 4 (10) |
| Never | 38 (91) |
| Cotton-Myer grade at time of surgeryb | |
| I | 1 (2) |
| II | 27 (54) |
| III | 22 (44) |
Abbreviations: BMI, body mass index (calculated as weight in kilograms divided by height in meters squared); iSGS, idiopathic subglottic stenosis.
Unless otherwise indicated, the value represents the number (percentage) of patients.
Surgeries for which operative notes were accessible.
No patient had a prior open tracheal resection, comorbid lower airway, or parenchymal lung disease based on medical history, thorough initial airway history, and when indicated, full PFTs with bronchodilator challenge. The number of lifetime endoscopic procedures per patient, including those performed at an outside institution, ranged from 0 to 7 with a median of 2 at the time of study completion. One patient had no prior endoscopic procedures. At the time of endoscopic intervention, 1 patient (2%) had grade I stenosis, 27 patients (54%) had grade II stenosis, and 22 patients (44%) had grade III stenosis. There were 251 spirometry measurements available among 42 patients, with a range of 2 to 15 measurements per patient.
PEF, EDI, and TPF vs Cotton-Myer Grade of Stenosis
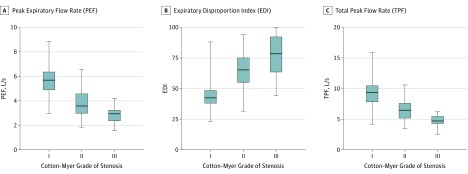
The mean PEFs for Cotton-Myer grade I, II, and III lesions were 5.6 (95% CI, 5.4-5.9), 4.1 (95% CI, 3.7-4.5), and 3.0 (95% CI, 2.5-3.4) liters per second, respectively. This translates to 336, 246, and 180 liters per minute. The mean EDIs for grade I, II, and III lesions were 44.6 (95% CI, 41.7-47.5), 62.2 (95% CI, 58.2-66.1), and 77.9 (95% CI, 73.2-82.5), respectively. The mean TPFs for grade I, II, and III lesions were 9.3 (95% CI, 8.8-9.8), 7.0 (95% CI, 6.4-7.6), and 5.1 (95% CI, 4.4-5.8) liters per scond, respectively. All 95% CIs were nonoverlapping (Figure 1).
Figure 1. The PEF, EDI, and TPF Stratified by Grade of Subglottic Stenosis.
The horizontal lines within the boxes represent median values. Whiskers mark minimum and maximum values. Boxes define interquartile ranges. The EDI is the ratio of forced expiratory volume in 1 second (FEV1) measured in liters to PEF measured in liters per second multiplied by 100 (FEV1/PEF × 100).
Utility of EDI, PEF, and TPF to Predict Operative Intervention
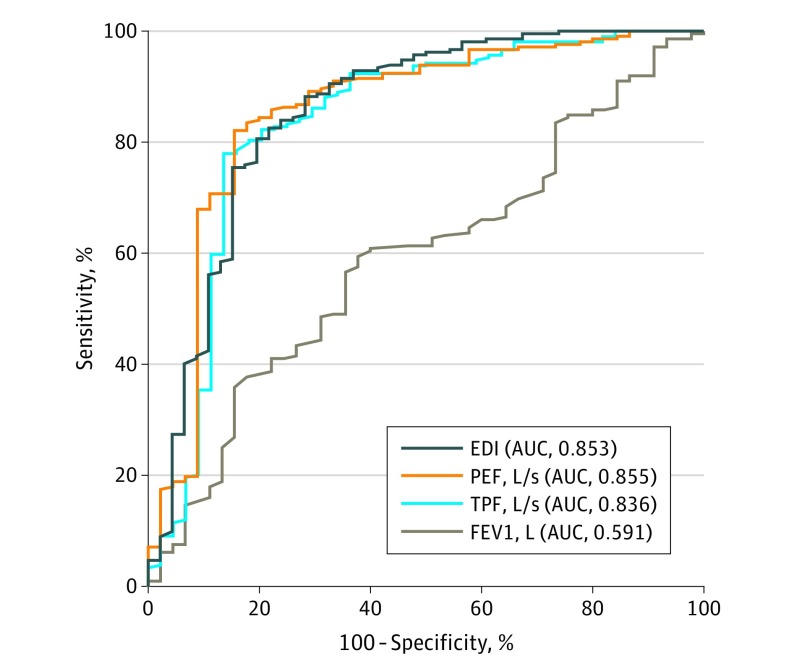
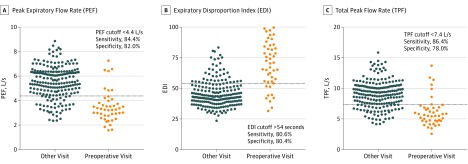
The area under the ROC curve for PEF was 0.855 (95% CI, 0.784-0.926). The optimal cutoff value, defined as that which maximizes sensitivity and specificity for differentiating between PEF values measured at preoperative visits and PEF values measured at all other visits, was 4.4 liters per second (264 L/min), with a sensitivity and specificity of 84.4% and 82.0%, respectively. In descriptive terms, a PEF cutoff of greater than 4.4 liters per second would not identify 15.6% of patients who would receive surgery in the next 2 months. Similarly, this cutoff would also incorrectly identify 18.0% of patients as possibly receiving surgery within the next 2 months. The area under the ROC curve for EDI was 0.853 (95% CI, 0.782-0.925). The optimal cutoff value for differentiating between EDI values measured at preoperative visits and all other visits was greater than 54.0, with a sensitivity and specificity of 80.6% and 80.4%, respectively. According to these data, an EDI cutoff of greater than 54.0 would not identify 19% of patients who would receive surgery in the next 2 months and would incorrectly identify 20% of patients as possibly receiving surgery within the next 2 months. The area under the ROC curve for TPF was 0.836 (95% CI, 0.757-0.916). The optimal cutoff value using TPF was 7.4 liters per second (444 L/min), with a sensitivity and specificity of 86.4% and 78.0%, respectively. A TPF cutoff of greater than 7.4 liters per second would not identify 13.6% of patients who would receive surgery in the next 2 months and would incorrectly identify 22.0% of patients as possibly receiving surgery within the next 2 months. The AUC for PEF, EDI, and TPF fell within the good category on the basis of the ranges outlined in the Methods section. Figure 2 shows the ROC curves for PEF, EDI, TPF, and FEV1, and Figure 3 shows scatter plots demonstrating how the study population’s PEF, EDI, and TPF values relate to the screening cutoffs. Of note, flow rate (TPF, PEF) and EDI follow an inverse relationship; for example, a low PEF or TPF and a high EDI are generally associated with a higher degree of stenosis.
Figure 2. Receiver Operating Characteristic Curves for Spirometry Measures .
The receiver operating characteristic curves demonstrate the sensitivity and specifity of the peak expiratory flow (PEF), expiratory disproportion index (EDI), total peak flow (TPF), and forced expiratory volume in 1 second (FEV1) for differentiating spirometry measures taken at preoperative visits and all other visits. AUC indicates area under the receiver operating curve.
Figure 3. Comparison of PEF, EDI, and TPF Values Taken at Preoperative Visits Compared With All Other Visits.
Each dot represents a single a visit. The horizontal line represents the optimal cutoff value for differentiating between these 2 groups of data to predict receipt of surgical intervention. For PEF and TPF, a value below the line suggests future operative intervention. For EDI, a value above the line suggests future operative intervention.
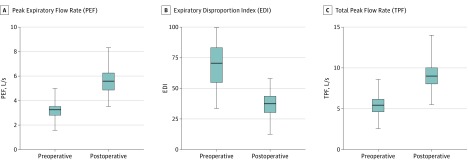
Figure 4 is a plot of preoperative and postoperative PEF, EDI, and TPF values. Mean preoperative and postoperative values for PEF were 3.19 (95% CI, 2.94-3.43) and 5.49 (95% CI, 5.14-5.84) liters per second, respectively, with a mean percentage change of 79.0% (95% CI, 64.6%-93.4%). For EDI, mean preoperative and postoperative values were 73.8 (95% CI, 68.2-78.6) and 44.9 (95% CI, 42.1-47.7), respectively, with a mean percentage change of −37.5% (95% CI, −41.1% to −33.9%). For TPF, mean preoperative and postoperative values were 5.36 (95% CI, 4.95-5.77) and 9.05 (95% CI, 8.46-9.64) liters per second, with a mean percentage change of 75.5% (95% CI, 60.9%-90.1%). All 95% CIs were nonoverlapping.
Figure 4. The EDI, PEF, and TPF Before and After Surgical Intervention.
The horizontal lines within the boxes represent median preoperative and postoperative values. Whiskers mark minimum and maximum values. Boxes define interquartile ranges. The EDI is the ratio of forced expiratory volume in 1 second (FEV1) measured in liters to PEF measured in liters per second multiplied by 100 (FEV1/PEF × 100).
Discussion
The natural history of iSGS requires monitoring for stenosis progression to determine the appropriate timing of surgical or procedural intervention. It is important to be able to objectively measure improvement to be able to compare novel treatments against the current standard of care. Currently, no formal recommendations exist regarding which spirometry indices have the greatest clinical utility for monitoring patients with iSGS.
In this study, we compared the utility of the PEF with established spirometry markers, TPF and EDI, for differentiating the severity of airway compromise in iSGS. The data suggest that PEF, EDI, and TPF are equally sensitive and specific measures for monitoring stenosis progression and predicting the receipt of surgical intervention. While all 3 values are similar in their ability to accomplish these tasks, the simplicity of measurement and widespread use of PEF for monitoring various breathing conditions makes it a more physician- and patient-friendly value than EDI or TPF. Furthermore, PEF is routinely found on a standard spirometry report, whereas the EDI and TPF are calculated from values found on a standard report, thus requiring an extra step on the part of the clinician.
The sensitivity and specificity of the PEF for identifying patients who receive surgery within 2 months is characterized as good, 84.4% and 82.0%, respectively. For example, of 100 patients with iSGS for whom we would recommend surgical intervention, PEF, EDI, and TPF will identify 84, 80, and 86 of those patients, respectively. While these values are not perfect, we believe the PEF provides an additional piece of data on which to base clinical decision making when interpreted in the context of each patient’s symptoms and physical examination and laryngoscopy findings.
This study validates and confirms previous studies on the utility of spirometry for monitoring upper airway stenosis. We found significant differences in mean EDI, PEF, and TPF values among patients with different Cotton-Myer grades of subglottic stenosis, which compares favorably with data published in 2013 by Nouraei et al9 and in 2014 by Nouraei et al.14 Our data also support the use of the PEF to identify treatment-related changes, given the significant difference between mean preoperative and postoperative values. According to data published by Nouraei et al14 in 2014, the change in the AUC for the flow-volume loop divided by FVC (ΔAUCtotal/FVC) was superior to the PEF and TPF for identifying treatment-related changes in patients with LTS.14 However, the ΔAUCtotal/FVC is not a clinically accessible value because it requires specialized software to calculate the area under the flow-volume loop. The PEF, in contrast, can be determined with a quick glance at the flow-volume loop or spirometry report.
It must be noted that the PEF is less useful than EDI for the initial diagnosis of subglottic stenosis. EDI has been shown to be a highly sensitive and specific tool for differentiating subglottic stenosis from parenchymal lung disease and lower airway disease.9 However, based on the data presented in this study, once a diagnosis is established, PEF can be used for longitudinal clinical surveillance. Our analysis showed that a specific threshold of greater than 4.4 liters per second can be used as an indicator that a patient is approaching operative intervention. While no single piece of data will replace a thorough history and physical examination and no single laboratory value can be used to identify patients for whom surgical intervention is appropriate, we believe that PEF can serve as a valuable adjunct to clinic-based care.
With regard to future study and application, our findings may be particularly relevant to patients in areas where access to care is poor who could benefit from telemedicine consultation between an airway specialist and their primary care clinician when regular travel to an airway center is not possible. This approach would be most reliable when the progression of disease is relatively predictable, as in iSGS, and does not preclude the need for longitudinal follow-up for airway visualization and to assess issues that may not be trackable on spirometry.
Limitations
The main limitation of this study is the relatively small number of patients and spirometry values used in the data analysis, particularly in the Cotton-Myer grade III group. Furthermore, each patient contributed a variable number of spirometry values over different time frames on the basis of the clinical need for visit frequency. As a result, those with more severe disease are seen in clinic more frequently and therefore have a disproportionate share of the spirometry values. A more structured data set would include spirometry values from standard benchmarks during each patient’s course of disease.
Conclusions
This study provides evidence to support the PEF, TPF, and EDI as relatively sensitive and specific measures for monitoring progression of disease and predicting receipt of intervention in patients with iSGS. Of these measurements, the PEF will likely prove to be the most valuable to the practicing airway specialist for longitudinal monitoring owing to its simplicity and inclusion on a standard spirometry report.
References
- 1.Gelbard A, Francis DO, Sandulache VC, Simmons JC, Donovan DT, Ongkasuwan J. Causes and consequences of adult laryngotracheal stenosis. Laryngoscope. 2015;125(5):1137-1143. doi: 10.1002/lary.24956 [DOI] [PMC free article] [PubMed] [Google Scholar]
- 2.McCaffrey TV. Classification of laryngotracheal stenosis. Laryngoscope. 1992;102(12 Pt 1):1335-1340. doi: 10.1288/00005537-199212000-00004 [DOI] [PubMed] [Google Scholar]
- 3.Gnagi SH, Howard BE, Anderson C, Lott DG. Idiopathic subglottic and tracheal stenosis: a survey of the patient experience. Ann Otol Rhinol Laryngol. 2015;124(9):734-739. doi: 10.1177/0003489415582255 [DOI] [PubMed] [Google Scholar]
- 4.Blumin JH, Johnston N. Evidence of extraesophageal reflux in idiopathic subglottic stenosis. Laryngoscope. 2011;121(6):1266-1273. doi: 10.1002/lary.21776 [DOI] [PubMed] [Google Scholar]
- 5.Gelbard A, Donovan DT, Ongkasuwan J, et al. Disease homogeneity and treatment heterogeneity in idiopathic subglottic stenosis. Laryngoscope. 2016;126(6):1390-1396. doi: 10.1002/lary.25708 [DOI] [PMC free article] [PubMed] [Google Scholar]
- 6.Valdez TA, Shapshay SM. Idiopathic subglottic stenosis revisited. Ann Otol Rhinol Laryngol. 2002;111(8):690-695. doi: 10.1177/000348940211100806 [DOI] [PubMed] [Google Scholar]
- 7.Perotin JM, Jeanfaivre T, Thibout Y, et al. Endoscopic management of idiopathic tracheal stenosis. Ann Thorac Surg. 2011;92(1):297-301. doi: 10.1016/j.athoracsur.2011.03.129 [DOI] [PubMed] [Google Scholar]
- 8.Kraft SM, Sykes K, Palmer A, Schindler J. Using pulmonary function data to assess outcomes in the endoscopic management of subglottic stenosis. Ann Otol Rhinol Laryngol. 2015;124(2):137-142. doi: 10.1177/0003489414548915 [DOI] [PubMed] [Google Scholar]
- 9.Nouraei SA, Nouraei SM, Patel A, et al. Diagnosis of laryngotracheal stenosis from routine pulmonary physiology using the expiratory disproportion index. Laryngoscope. 2013;123(12):3099-3104. doi: 10.1002/lary.24192 [DOI] [PubMed] [Google Scholar]
- 10.Tasche KK, Bayan S, Schularick NM, Wilson J, Hoffman HT. Utility of peak inspiratory flow in managing subglottic stenosis. Ann Otol Rhinol Laryngol. 2015;124(6):499-504. doi: 10.1177/0003489414565000 [DOI] [PubMed] [Google Scholar]
- 11.Empey DW. Assessment of upper airways obstruction. Br Med J. 1972;3(5825):503-505. doi: 10.1136/bmj.3.5825.503 [DOI] [PMC free article] [PubMed] [Google Scholar]
- 12.Nouraei SA, Winterborn C, Nouraei SM, et al. Quantifying the physiology of laryngotracheal stenosis: changes in pulmonary dynamics in response to graded extrathoracic resistive loading. Laryngoscope. 2007;117(4):581-588. doi: 10.1097/MLG.0b013e3180310574 [DOI] [PubMed] [Google Scholar]
- 13.Wassermann K, Gitt A, Weyde J, Eckel HE. Lung function changes and exercise-induced ventilatory responses to external resistive loads in normal subjects. Respiration. 1995;62(4):177-184. doi: 10.1159/000196444 [DOI] [PubMed] [Google Scholar]
- 14.Nouraei SM, Franco RA, Dowdall JR, et al. Physiology-based minimum clinically important difference thresholds in adult laryngotracheal stenosis. Laryngoscope. 2014;124(10):2313-2320. doi: 10.1002/lary.24641 [DOI] [PubMed] [Google Scholar]
- 15.Myer CM III, O’Connor DM, Cotton RT. Proposed grading system for subglottic stenosis based on endotracheal tube sizes. Ann Otol Rhinol Laryngol. 1994;103(4 Pt 1):319-323. doi: 10.1177/000348949410300410 [DOI] [PubMed] [Google Scholar]
- 16.Hankinson JL, Odencrantz JR, Fedan KB. Spirometric reference values from a sample of the general U.S. population. Am J Respir Crit Care Med. 1999;159(1):179-187. doi: 10.1164/ajrccm.159.1.9712108 [DOI] [PubMed] [Google Scholar]
- 17.Safari S, Baratloo A, Elfil M, Negida A. Evidence based emergency medicine; Part 5 receiver operating curve and area under the curve. Emerg (Tehran). 2016;4(2):111-113. [PMC free article] [PubMed] [Google Scholar]


