

Abstract
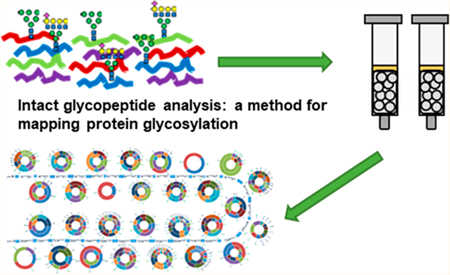
The Chinese hamster ovary (CHO) cell line is a major expression system for the production of therapeutic proteins, the majority of which are glycoproteins, such as antibodies and erythropoietin (EPO). The characterization glycosylation profile of therapeutic proteins produced from engineered CHO cells and therapeutic functions, as well as side effects, are critical to understand the important roles of glycosylation. In this study, a large scale glycoproteomic workflow was established and applied to CHO-K1 cells expressing EPO. The workflow includes enrichment of intact glycopeptides from CHO-K1 cell lysate and medium using hydrophilic enrichment, fractionation of the obtained intact glycopeptides (IGPs) by basic reversed phase liquid chromatography (bRPLC), analyzing the glycopeptides using LC-MS/MS, and annotating the results by GPQuest 2.0. A total of 10 338 N-linked glycosite-containing IGPs were identified, representing 1162 unique glycosites in 530 glycoproteins, including 71 unique atypical N-linked IGPs on 18 atypical N-glycosylation sequons with an overrepresentation of the N-X-C motifs. Moreover, we compared the glycoproteins from CHO cell lysate with those from medium using the in-depth N-linked glycoproteome data. The obtained large scale glycoproteomic data from intact N-linked glycopeptides in this study is complementary to the genomic, proteomic, and N-linked glycomic data previously reported for CHO cells. Our method has the potential to monitor the production of recombinant therapeutic glycoproteins.
Graphical Abstract
The Chinese hamster ovary (CHO) cell line is the major expression system used for the efficient production of recombinant proteins, the majority of which are therapeutic glycoproteins, including erythropoietin (EPO), coagulation factors, and antibodies.1 A major focus of current glycosylation engineering efforts is to produce therapeutic glycoproteins with optimal yield and human-like post-translational modifications (PTMs). Glyco-engineered CHO cells have been comprehensively investigated by different biological, analytical, and molecular engineering approaches, including genomics,2–6 proteomics,7 glycoproteomics,8 and glycomics,9,10 to understand the final characteristics of the recombinant therapeutic glycoproteins. These studies aim to optimize therapeutic glycoprotein drug production, thereby improving therapeutic efficacy and ultimately reducing side effects, toxicity, and cost in the pharmaceutical industry.
As one of the most prevalent protein modifications, N-linked glycosylation plays a vital role in many biological process, especially in protein folding, cell adhesion, cell-matrix interactions, cellular signaling, intracellular/extracellular targeting to organelles, and pathogenesis of different diseases.11‘12 The complexity of protein glycosylation, including multiple glycosites within a glycoprotein (macro-heterogeneity), site occupancy and different glycan structures at each glycosite (microheterogeneity), poses great challenges for a comprehensive analysis of glycoproteins expressed in a cell or organism to investigate the structural and functional role of glycans within glycoproteins. A number of methods have been used to characterize glycoproteins, including (i) glycosite identification using approaches, such as solid-phase extraction of glycosite-containing peptides (SPEG),13 lectin enrichment,14,15 and hydrophilic enrichment;16 (ii) glycome profiling, such as total native glycans,17 sialic acid derivatization,18–21 reducing end labeling through stable isotopic labeling,22–25 and permethylation;26–28 (iii) site-specific intact glycopeptide (IGP) analysis29–31 using methods, such as N-linked glycan and glycosite (NGAG)32 analysis, tool for rapid analysis of glycopeptide by permethylation (TRAP),33 electron-transfer/higher-energy collision dissociation (EThcD) mass spectrometry,34 stepped-energy HCD-MS/ MS method,35,36 and hydrophilic interaction liquid chromatography (HILIC) enrichment.37,38 Site-specific IGP analysis is widely considered to be the most promising strategy to comprehensively characterize glycoproteins. But the IGP analysis workflow including enrichment method, mass spectrometric analysis and annotated software still needs to be developed to increase the glycoproteome coverage and precision. Recently, highly comprehensive methods for IGP enrichment using HILIC-based methods were compared in our lab, and mixed anion exchange (MAX) extraction cartridges were selected as the optimal enrichment method for intact N-linked glycopeptides.39 In addition, two-dimensional (2D) fractionation methods, including bRPLC, gel electrophoresis (SDS-PAGE), and strong cation exchange (SCX-HPLC) are very helpful to further improve the coverage of peptides or glycopeptides.40–42
Glycosylation of therapeutic glycoproteins cannot be directly predicted by the genomic data. The expression of glycoproteins, glycoprotein biosynthesis, and constituents are dictated by the availability of nucleotide sugar synthesis, nucleotide sugar transporters, enzyme activities, and other cellular status, which lead to broad structural diversity. Structural and functional analyses showed that protein glycosylation, especially for bisecting N-acetylglucosamine, fucosylation, and sialylation, substantially impacts the functional activities and circulatory half-life of therapeutic glycoproteins.43,44 Control of recombinant protein glycosylation remains a key objective for the biopharmaceutical industry because of its established role in modulating a number of product-specific attributes.45 Therefore, establishing a comprehensive method to monitor the protein glycosylation is required for the quality control of glycoprotein drugs. Until now, studies on glycosylation of therapeutic glycoproteins produced in CHO cell have been mainly focused on the glycosites or on glycan structures.9,10 These studies are very important for the therapeutic protein glycosylation analysis, but they cannot provide site-specific and comprehensive characterization of the protein glycosylation. It has been shown that the site-specific glycan analysis on a single glycoprotein is critical to know the glycosylation of the therapeutic protein.46 So precise and comprehensive analysis of site-specific IGPs is critical to understand and control the glycosylation of glycoproteins produced in CHO cell expression systems.
In this study, we established a workflow for the large-scale characterization of intact N-linked glycopeptides using (1) MAX enrichment, (2) bRPLC fractionation, (3) mass spectrometry analysis using Q-Exactive instrumentation, and (4) data analysis and annotation in GPQuest 2.0.47,48 Using this method, we identified a total of 10 338 unique N-linked glycosite-containing IGPs, representing 1162 unique glycosites from 530 glycoproteins in human erythropoietin (EPO)-expressing CHO-K1 cell lysate and medium. From this study, 71 unique N-linked atypical IGPs were also identified, representing 18 unique glycosites with overrepresentation of the atypical sequon, N-X-C.
MATERIALS AND METHODS
Human EPO-Expressing CHO-K1 Cell Culture and Protein Digestion.
Human EPO-expressing CHO-K1 cells and medium were prepared by the National Institutes of Health (NIH). The cell culture and protein extraction methods were described in Supporting Information. Proteins from human EPO-expressing CHO-K1 cells and medium denatured in 8 M urea/1 M NH4HCO3 buffer were reduced by 10 mM TCEP at 37 °C for 1 h and alkylated by 15 mM iodoacetamide at room temperature for 30 min in the dark. The solutions were diluted 8-fold with ddH2O. Then sequencing grade trypsin (protein enzyme, 40:1, w/w; Promega, Madison, WI) was added to the samples and incubated at 37 °C overnight. The peptides were cleaned by C18 solid-phase extraction.
Enrichment of N-Linked Glycopeptides Using MAX Extraction Cartridges.
Oasis MAX extraction cartridges (Waters) were applied for enrichment of N-linked glycopeptides. Cartridges were sequentially conditioned in ACN three times, 100 mM triethylammonium acetate three times, water five times and finally 95% ACN (v/v) 1% TFA (v/v) five times. Samples were loaded twice. The non-glycopeptides were washed off by 95% ACN (v/v) 1% TFA (v/v) three times. Finally, glycopeptides were eluted in 50% ACN (v/v) 0.1% TFA (v/v), dried in a speed-vac, and desalted by C18 solid-phase extraction.
Peptide Fractionation by Basic Reversed-Phase Liquid Chromatography (bRPLC).
Basic reversed-phase liquid chromatography was used with extensive fractionation to reduce sample complexity and thus reduce the likelihood of glycopeptides being coisolated and cofragmented.49 IGPs (~100 μg) extracted by MAX extraction cartridges and global peptides (~4 mg) from Human EPO-expressing CHO-K1 cells and medium were injected by a 1220 Series HPLC (Agilent Technologies, Inc., CA) into a Zorbax Extend-C18 analytical column containing 1.8 μm particles at a flow rate of 0.2 mL/ min for IGPs or 3.5 μm particles at a flow rate of 1 mL/min for global peptides. The mobile-phase A consisted of 10 mM ammonium formate (pH 10) and B consisted of 10 mM ammonium formate and 90% ACN (pH 10). The bRPLC condition was described in Supporting Information.
Glycopeptide Enrichment and Deglycosylation.
For analysis of deglycosylated peptides, the tryptic digested peptides (3.5 mg) were fractionated by offline bRPLC. The glycopeptides of 24 fractions were enriched by MAX Extraction Cartridges. The captured glycopeptides were then deglycosylated by PNGase F (New England BioLabs). The deglycosylated peptides were desalted using Stagetip C18 (Thermo Scientific).
NanoLC-MS/MS Analysis.
The IGPs and deglycosylated peptides were subjected to two LC-MS/MS run per sample (or fraction) on a Q-Exactive mass spectrometer (Thermo Fisher Scientific, Bremen, Germany). The samples were resuspended with 3% ACN and 0.1% FA. The samples were first separated on a Dionex Ultimate 3000 RSLC nano system (Thermo Scientific) with a PepMap RSLC C18 column (75 μm × 50 cm, 2 μm, Thermo Scientific) protected by an Acclaim PepMap C18 column (100 μm × 2 cm, 5 μm, Thermo Scientific). The LC condition and MS parameters for IGPs and deglycosylated peptides were described in Supporting Information.
Data Analysis.
For deglycosylated peptides, acquired MS/MS spectra were searched using MS-GF+ against the RefSeq Cricetulus griseus protein database downloaded from the NCBI websites with the last update on June 01, 2016, which contained 46 402 proteins. Database search parameters were described in Supporting Information. For IGPs identification, the data were searched using an in-house developed glycopeptide analysis software GPQuest 2.0, based on GPQuest.47 The database of glycosites were the glycosite-containing peptide data from deglycopeptide methods. The human erythropoietin fasta protein sequence was also added to the protein database. The Cricetulus griseus glycan database was from the previous CHO cell glycomics profiling studies.10 The databases contain 57 653 predicted glycosites and 343 glycan structure entries. Database search parameters for IGPs were described in Supporting Information.
RESULTS AND DISCUSSION
Identification of N-Linked Glycosite-Containing Peptides.
The majority of therapeutic glycoproteins secreted from CHO cells were found to be heavily modified by N-linked glycosylation.4 Assessment of protein glycosylation in CHO cells is very important for understanding the quality of CHO-derived glycoproteins. Using multiple separation and analytical methodologies is helpful to expand the number of enriched glycopeptides and identified glycoproteins. In this study, we first identified the N-linked glycosylation sites and glycoproteins by PNGase F digestion. The tryptic peptides were fractionated by basic RPLC, then glycopeptides in each fraction were enriched by hydrophilic MAX extraction. After deglycosylation by PNGase F, the glycosite-containing peptides were analyzed by LC-MS/MS and identified by MS-GF+50,51 (Figure 1a). The assigned N-glycosite-containing peptides were filtered with 0.1% false discovery rate (FDR) at the glycopeptide spectrum match (PSM) level, 0.3% FDR at the peptide level, and 1.1% at the protein level with a 2 PSM requirement for each peptide. A total of 68 148 PSMs were identified from CHO-K1 cells, representing 4549 unique N-linked glycosite-containing peptides from 2276 proteins from 3.5 mg peptides (Table S1).
Figure 1.
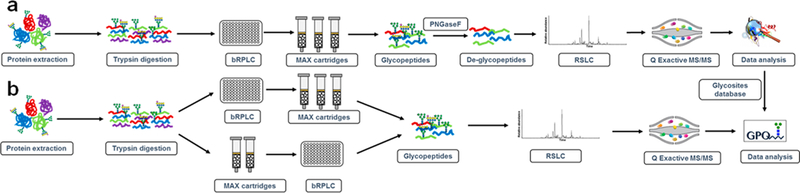
Workflows of intact glycopeptide analysis strategies for lysate and medium from human EPO-expressing CHO-K1 cells. (a) The workflow of large scale deglycosylated peptide analysis enriched by MAX extraction cartridges. The proteins were digested, fractionated and MAX enriched. The glycopeptides were then deglycosylated and analyzed by LC-MS/MS. (b) Different glycopeptide analysis strategies using MAX cartridge enrichment followed by fractionation or fractionation of global peptides, followed by enrichment of IGPs using MAX cartridges for large-scale IGPs analysis.
Intact N-Linked Glycopeptide Analysis Using Different Analytical Workflows.
To characterize the IGPs of the human EPO-expressing CHO-K1 cell line, different workflows were used in this study: (i) single LC-MS/MS analysis of enriched IGPs; (ii) direct analysis of global peptides using single LC-MS/MS or fractionation of global peptides by bRPLC followed by LC-MS/MS analysis; (iii) fractionation of global peptides using bRPLC followed by hydrophilic enrichment of IGPs from each fraction for LC-MS/MS analysis; and (iv) hydrophilic enrichment of IGPs followed by fractionation of enriched glycopeptides using bRPLC for LC-MS/MS analysis (Figure 1b). The prepared peptides were analyzed by a Q-Exactive mass spectrometer and annotated by GPQuest 2.0 using the glycosite-containing peptides described in the preceding section (Table S1) as the database. The intact N-linked glycopeptides were filtered using a 1% FDR.
For single LC-MS/MS analysis of nonenriched and enriched IGPs, IGPs enriched from 1 μg or 100 μg of CHO cell global peptides by hydrophilic MAX columns were analyzed by LC-MS/MS and glycopeptides were identified by GPQuest 2.0. Five and 950 PSMs of IGPs were identified from 1 μg and 100 μg of CHO cell global peptides, respectively (Figure S1). More than a 190-fold increase of PSM identification was achieved when the initial peptide amount was increased from 1 to 100 μg for intact glycopeptide enrichment. We then compared the direct analysis of global peptides with or without fractionation using bRPLC, followed by LC-MS/MS analysis. One microgram of global peptides were analyzed by single LC-MS/MS analysis or 100 μg global peptides were fractionated to 25 fractions and each fraction was analyzed by LC-MS/MS analysis. A total of 120 (from 1 μg) and 1442 (from 100 μg) PSMs of IGPs were identified, respectively (Figure S1). The inclusion of the bRPLC separation resulted in a greatly (>12- fold) increased number of identified PSMs. For large-scale identification of intact glycopeptides, (i) fractionation of peptides using bRPLC followed by MAX enrichment of IGPs from each fraction and (ii) MAX enrichment of IGPs followed by fractionation of enriched glycopeptides using bRPLC were established. Using a method entailing MAX enrichment followed by bRPLC (25 fractions), we were able to identify a total of 43 193 PSMs from 3.5 mg of global peptides, while 27 998 PSMs from an equal starting peptide amount were identified when the workflow started from the bRPLC fractionation step followed by MAX enrichment. There was a > 1.5-fold increase in PSM in the analysis of MAX-enriched IGPs followed by bRPLC strategy compared to the reverse method (Figure S1).
Analysis of the N-Linked IGPs in the Human Erythropoietin (EPO)-Expressing CHO-K1 Cell Lysate and Medium.
Using CHO-K1 cell lysate (3.5 mg peptides), 8391 unique N-linked glycosite-containing IGPs were identified, which matched with 1090 glycosites, 507 glycoproteins, and 187 glycan compositions. In addition, the established large-scale IGPs analysis workflow was applied to the characterization of IGPs from secreted proteins in CHO-K1 cell culture (3.5 mg peptides). A total of 7966 unique N-linked IGPs were identified in the medium of the CHO-K1 cells, which matched with 1041 glycosites, 485 glycoproteins, and 171 glycan structures. In total, 10 338 unique N-linked glycosite-containing IGPs were identified from EPO-expressing CHO-K1 cell lysate and culture medium, matching to 1162 glycosites, 530 glycoproteins, and 209 glycan compositions (Table S2 and Figure S2).
It is well-known that most glycoproteins are extracellular proteins (transmembrane or secreted proteins).52 Therefore, we predicted the subcellular location of identified glycoproteins using SignalP 4.153 and TMHMM 2.054 programs. Cell surface, secreted and transmembrane proteins were deemed as glycoproteins. The annotated signal peptides, protein glycosylation and gene ontology (GO) were evaluated in Uniprot. From the results, we found that 511 out of 530 (96.4%) identified proteins were highly likely to be glycoproteins, each of which contained either signal peptides, transmembrane helices, or reported glycosites (Table S3). These findings indicated the high specificity of our intact glycopeptide analysis workflow and the data analysis strategy toward comprehensive glycoproteomics characterization. The GO analysis also indicated that most of the glycoproteins were located at the cell surface or secreted to the extracellular space (Table S3). In addition, the molecular function of the identified glycoproteins was either binding or catalytic activity (Table S3).
To investigate the N-linked glycans from CHO cell lysate and medium, we characterized the IGPs by N-linked glycan classification. The identified 10,338 IGPs from both cell lysate and medium consisted of 4452 high-mannose type glycan-containing glycopeptides and 5886 complex or hybrid type glycan-containing glycopeptides. In these complex/hybrid glycan-containing glycopeptides, 3941 and 1471 were fucosylated and sialylated, respectively. High-mannose IGPs were the dominant type of glycopeptides (43.1%) and fucosylated IGPs were also very prevalent (38.1%), while sialylated glycopeptides were under represented (14.2%) among complex/hybrid IGPs in CHO cells (Figure 2a). The distribution of identified IGPs, glycoproteins and glycosites indicated that approximately 58.2% of the IGPs, 87.2% of the glycoproteins, and 83.5% of the glycosites were identified in both the cell lysate and the medium (Figure 2a and 2b). These findings suggest that most of the glycoproteins are common in cells and medium. However, the detailed structure of N-linked glycans on the glycoprotein differs between CHO cell lysate and medium. As an important component of glycoproteins, N-glycans and their site-specificity have not been thoroughly investigated in previously reported studies.55 In this study, glycans were assigned at their specific glycosylation sites through IGPs identification. Overall, 209 glycan structures were identified from human EPO-expressing CHO-K1 cell lysate and medium. Approximately 38.4% of the fucosylated N-linked glycans contained a core Fuc fragment ion (peptide + HexNAcFuc) that was present in the MS/MS spectra, indicating the core-fucosylated glycans (Figure 2c). In these N-linked fucosylated glycans, monofucosylated structures (46.8%) were the main type and the majority of the N-linked sialylated glycans were monosialylated (54.2%) (Figure 2c).
Figure 2.
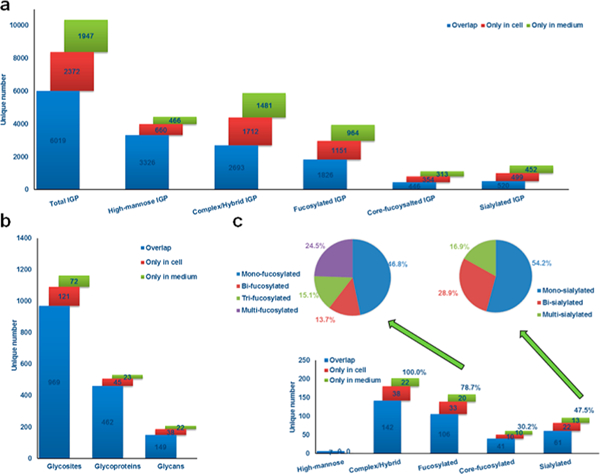
Depth of the identified IGPs in cell lysate and medium from human EPO-expressing CHO-K1 cells. (a) Identification and distribution of total and subtype IGPs identified from cells and medium. (b) Distribution of identified glycosites and glycoproteins in cell lysate and medium, showing that most glycoproteins are present in CHO-K1 cell lysate and medium. (c) Identification and distribution of glycans and the composition and distribution of fucosylated and sialylated N-linked glycans in cell lysate and medium.
Glycoprotein Heterogeneity in CHO Cells.
Glycosylation heterogeneity is a common feature of glycoproteins. Each protein can potentially be glycosylated at multiple glycosylation sites and each glycosylation site can be modified by different glycans. Using our large-scale N-linked glycoproteomic data, we are able to reveal the macroheterogeneity and microheterogeneity of glycoproteins in CHO cell lysate and medium. In the 530 N-linked glycoproteins identified from the intact glycoproteomic analysis, approximately 51.9% of the glycoproteins were identified with one N-linked glycosite, 24.2% of them were detected with two N-linked glycosites, and 10.4% with three N-linked glycosites. We identified a total of 55 (8.7%) glycoproteins that contained at least five glycosites (Figure 3a). The average number of N-linked glycosites was 2.2 per glycoprotein. To evaluate the relationship between the abundance of the glycoproteins and the index of protein glycosylation, we analyzed average protein abundance with the glycosite number on the same protein. We found that there is a positive relationship between the glycoprotein abundance and the index of its glycosylation with a P-value of 1.28 × 10⁻³, indicating that the number of glycosites per protein is directly correlated with protein abundance, and additional glycosylation sites could be present in the low abundance glycoproteins and identified if an increased amount of protein was used for glycopeptide analysis (Figure S3a). The 5 most heavily glycosylated glycoproteins were pro-low-density lipoprotein receptor-related protein 1 (30 unique N-linked glycosites), laminin subunit alpha-5 (19 unique N-linked glycosites), cation-independent mannose-6-phosphate receptor (18 unique N-linked glycosites), nicastrin (12 unique N-linked glycosites), and integrin alpha-3 (8 unique N-linked glycosites).
Figure 3.
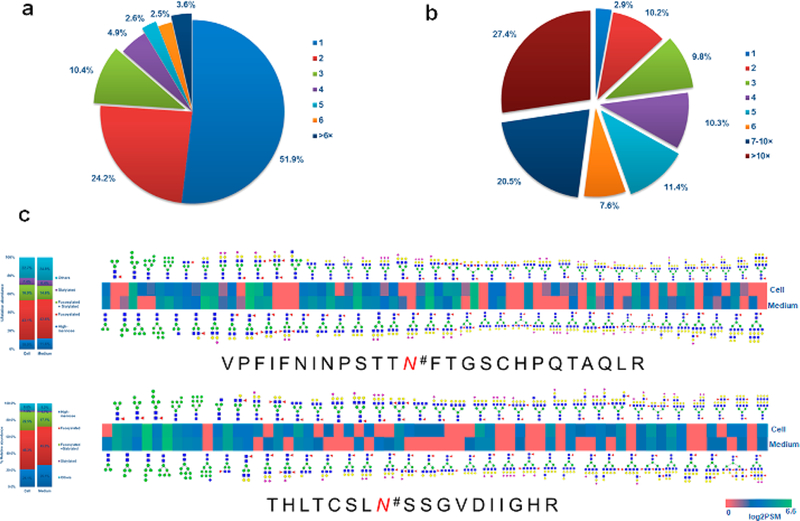
Heterogeneity of detected glycoproteins in CHO cell lysate and medium. (a) Distribution of glycosites per protein. (b) Distribution of glycans per glycosite. (c) Heat map of the differences in abundance of the subtypes of N-linked glycans between CHO cell lysate and medium on glycopeptide VPFIFNINPSTTN#FTGSCHPQTAQLR and THLTCSLN#SSGVDIIGHR. # indicates an N-linked glycosite.
From the total of 1162 N-linked glycosites, only 2.9% peptides carried a single glycan structure; approximately 10.2% and 9.8% glycosite-containing peptides were detected with two and three N-linked glycan structures at one glycosite, respectively. Notably, a group of 769 (66.9%) glycopeptides carried at least 5 N-linked glycan structures and 315 (27.4%) had at least 10 N-linked glycan structures at one glycosite (Figure 3b). The average number of N-linked glycan structures at one glycosite was 9.0. The number of glycans identified from each glycosite is directly related to the abundance of the glycosylated peptides with a P-value as 2.06 × 10⁻²⁰ (Figure S3b), indicating additional glycans could be present in the low abundance glycosites and could be identified if an increased amount of protein was used for glycopeptide analysis. In glycopeptide VPFIFNINPSTTN#FTGSCHPQTAQLR from lysosome-associated membrane glycoprotein and THLTCSLN#SSGVDIIGHR from basigin, we identified 74 and 66 N-linked glycan compositions (Figure 3c).
Consensus Motif Preferences of N-Linked Glycosylation at Canonical and Atypical N-Linked Glycosites.
The canonical N-linked glycopeptide sequon is known to be N-X- T/S (which X can be any amino acid except proline). In addition, some atypical N-glycosylation sequons have been discovered in recent years, such as N-X-C, N-X-V, and N-G- X.15,56 In the GPQuest 2.0 search engine, IGP identifications are determined based on the requirement of MS/MS spectra to contain oxonium ions and match to peptide or peptide + glycan fragment ions. Among the 10 338 identified MS/MS spectra, a total of 705 PSMs and 71 unique atypical N-linked IGPs were identified, which matched to 18 unique glycosites from 14 glycoproteins. On the basis of the spectra of atypical N-linked IGPs, two glycopeptides, TYN#IVLGSGQVVL-GMDMGLR + N2H6F0S0G0 from glycoprotein peptidyl-prolyl cis–trans isomerase FKBP9 and LCN#ECSEGSFHLSK + N2H6F0S0G0 from basement membrane-specific heparin sulfate proteoglycan core protein (Figure 4a), were identified. The observed oxonium ions, peptides and peptide + glycan- related fragment ions from both peptides matched well.
Figure 4.
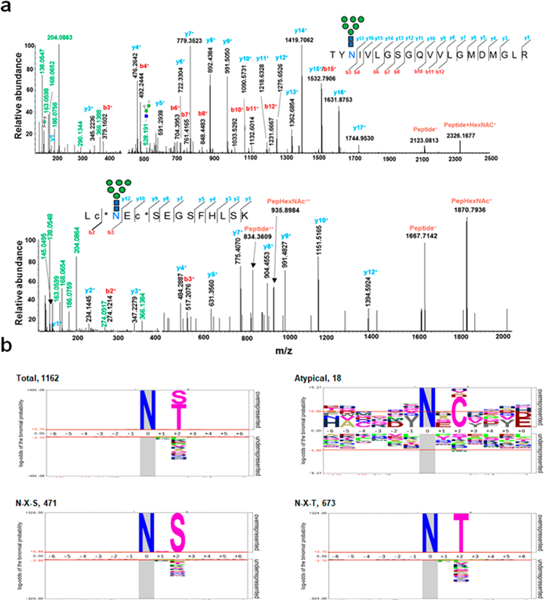
Identification of atypical N-linked glycopeptides and preference of N-glycosylation peptide consensus sequence. (a) Representative MS/MS spectra of the atypical N-glycopeptides of TYN#IVLGSGQVVLGMDMGLR + N2H6F0S0G0 from peptidyl-prolyl cis–trans isomerase FKBP9 and LCN#ECSEGSFHLSK + N2H6F0S0G0 from basement membrane-specific heparin sulfate proteoglycan core protein. # indicates an N-linked glycosite. (b) Distribution and preference of typical and atypical glycosite consensus sequence derived using pLogo.
To determine the preference of amino acids surrounding the canonical N-linked glycosylation sequons and discover other novel consensus sequons with our comprehensive data from this study, we compared the position-specific amino acid frequencies of the sequences (six amino acids from N-linked glycosylation sites at both termini) surrounding aspartic acid in both the canonical and the atypical N-linked glycopeptides using pLogo.57 A total of 1162 unique glycosites were identified, of which 673 contained an N-X-T motif, 471 contained an N-X-S motif and 18 atypical glycosite motifs, and the consensus sequons of the identified glycosites were analyzed. As we examined the canonical sequons in the data set, threonine was found to be more commonly present within the motif than serine at the +2 position (57.9% vs 40.5%). As expected, we found that proline was significantly under-represented in all the scenarios at position +1 and +3. Of the three atypical N-glycosylation sequons identified (N-X-C, N-G-X, and N-X-V), only N-X-C was significantly over-represented at 38.9% with a log-odds of binomial probabilities of +7.1 (Figure 4b).
Relative Abundance of N-Linked IGPs between Human EPO-Expressing CHO-K1 Cell Lysate and Medium.
To investigate the abundance of N-linked IGPs differentially expressed between the CHO cell lysate and the medium, we performed a comparative analysis of IGPs using label-free quantification methods based on spectral counting. Overall, 43 742 and 62 665 PSMs were identified from the cell lysate and medium, respectively. A total of 6763 and 7966 unique IGPs were identified from cell lysate and medium, respectively. The relative abundance profiling and linear correlation analysis indicated that the N-glycosylation of proteins in cell lysate and medium was strongly correlated, as indicated by a Pearson correlation of 0.931, indicating that the overall glycosylation profiles of glycans in the glycosites between cell lysate and medium showed a statistical association (Figure 5a). However, we also found that the relative abundance of some IGPs were significantly altered between the cell lysate and the medium, such as EASQN#ITYVCR-N2H6F0S0G0 with log2PSM ratio of cell/medium of 3.8, and LQQEFHCCGSN#NSQDWR-N4H5F0S1G0 with log2PSM ratio of cell/medium of 3.6; N#ETHSFCTACDESCK-N2H5F0S0G0 with log2 PSM ratio of cell/medium of 0.2, and LSPIHIALN#FSLDPK-N2H6F0S0G0 with log2 PSM ratio of cell/medium of 0.2. Interestingly, these variabilities in N-glycosylation indicated that, while there was no significant difference in the global protein glycosylation, the stoichiometry could change dramatically at some of the N-glycosites, suggesting unique functions of these glycosylation events at different cellular locations.
Figure 5.
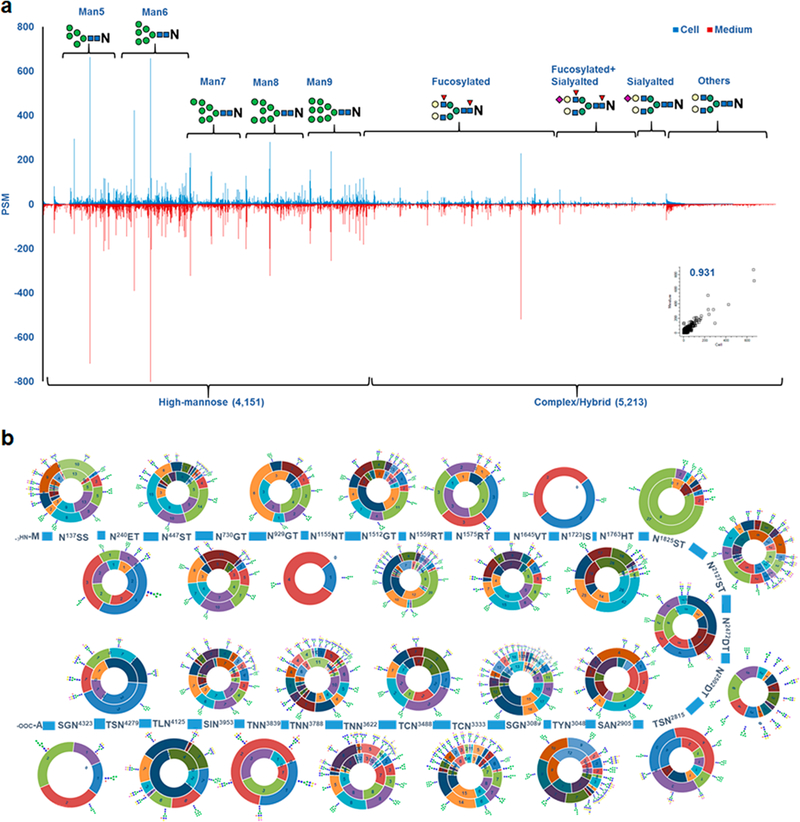
Relative abundance analysis of N-linked intact glycopeptides (IGPs). (a) Relative abundance profiling of IGPs between CHO cell lysate and medium, showing a strong correlation between the IGP abundance in cell lysate and medium. (b) The N-glycosylation of pro-low-density lipoprotein receptor-related protein 1 in cell lysate and medium, including the structure and relative abundance (PSM) of glycans on each glycosite. The inner circle shows the relative abundance in CHO cell lysate and the outer circle shows the relative abundance in medium.
Most importantly, through the application of in-depth glycoproteomic profiling we are able to present a map of the protein N-glycosylation patterns in CHO cell lysate and medium. As mentioned, pro-low-density lipoprotein receptor-related protein 1 was the most heavily glycosylated protein with 29 N-glycosites. The N-glycan map of pro-low-density lipoprotein receptor-related protein 1 with different glycosylation sites based on our findings is shown in Figure 5b and Table S4 indicating the high degree of N-glycan microheterogeneity. This map not only presents the structure of the glycans but also the relative abundance of glycans on the glycosites. It is readily observed from the map that N-linked high-mannose glycans were identified on nearly every glycosite, especially for Man5 and Man6. Some of the N-linked glycosylation sites were present only either the CHO-K1 cell lysate or medium. Glycosylation at N1155NT and N2502DT were identified only in the cell lysate, while N1723IS and N4279ST were only identified in the cell medium. We also noticed two trends for the glycosylation of neighbor glycosites: (i) the glycosylation is similar between neighboring glycosites compared to distal glycosites. For example, N1512GT and N1559RT were both abundant with high mannose and biantennary complex glycans. This is possibly because the glycotransferases or glycosidases recognize and are able to access part of the protein regions and modify these glycosites. (ii) The microheterogeneity was decreased when the glycosites were close to each other (i.e., glycosites N1723IS, N1763HT and N1825IS) (Figure S4). This phenomenon could occur because the glycan structure and site hindrance render the glycotransferase or glycosidase less accessible to the neighboring glycosites. Our results reveal that high-mannose glycan structures were typical in low degree microheterogeneity glycosites, while fucosylated glycan structures were common in high degree microheterogeneity glycosites.
N-Linked Glycosylation of EPO.
EPO is a model pharmaceutical protein in the development of CHO-based bioprocesses and the metabolic engineering of CHO cells for improved protein production.58 EPO glycosylation is important for its pharmacological properties. There have been many efforts to characterize the glycosylation of EPO in CHO cells, but most of the work focused on glycomics profiling or glycosite identification.59 With our large-scale IGPs identification method, the N-linked glycans of EPO at specific glycosylation sites were extensively characterized. Owing to the limitation that the first and second glycosites cannot be cleavage by trypsin, only two glycosite-containing peptides from EPO were identified with one peptide containing 2 glycosites (EAEN#ITTGCAEHCSLNEN#ITVPDTK and GQALLVN#SSQPWEPLQLHVDK (Table S5). For the third glycosite, we found that 62 glycans were assigned, and complex or hybrid glycans were more common than other forms in the third glycosite from EPO. Glycan structure, relative abundance, and distribution of the identified glycopeptide, GQALLVN#SSQPWEPLQLHVDK, are summarized in Figure S5, of which 12 glycans (inside the red frame) have been previously identified in EPO glycomics studies.60,61
CONCLUSIONS
In this study, we presented a large-scale analysis of intact N-linked glycopeptides identified from CHO cells using established glycoproteomic workflows involving the enrichment of IGPs by MAX extraction cartridges followed bRPLC with high-resolution mass spectrometry. These results demonstrate the feasibility of the comprehensive exploration of the N-linked glycosylation of CHO cell lysate and medium. We also note that the coverage of CHO cell glycosylation characterization could be extensively improved in the near future by employing methodologies, such as multiple proteases or top-down mass spectrometry.
Supplementary Material
ACKNOWLEDGMENTS
This work was supported by the National Heart, Lung and Blood Institute, Programs of Excellence in Glycosciences (PEG, Grant P01HL107153), National Cancer Institute, the Clinical Proteomic Tumor Analysis Consortium (CPTAC, Grant U24CA210985), and the Early Detection Research Network (EDRN, U01CA152813), and National Science Foundation (Grant 124230).
Footnotes
ASSOCIATED CONTENT
Supporting Information
The Supporting Information is available free of charge on the ACS Publications website at DOI: 10.1021/acs.anal-chem.8b03520.
Materials and methods, figures showing identification of peptide spectrum matches, identification of N-linked intact glycopeptides from CHO-K1 cell lysate and medium, relationship between the number of N-linked glycosylation sites and protein abundance, proportion of identified IGPs with different N-glycan compositions, relative abundance of specific glycan-containing forms of the glycosite-containing EPO peptide, and a table showing N-linked glycosylation of erythropoietin in CHO cell lysate and medium (PDF)
Tables showing glycosite-containing peptides identified from CHO cells, identification of intact glycopeptides from CHO-K1 cell lysate and medium, subcellular location, signal peptides, and transmembrane segments for identified glycoproteins, and N-glycosylation of pro-low-density lipoprotein receptor-related protein 1 (XLSX)
Notes
The authors declare no competing financial interest.
REFERENCES
- (1).Walsh G Nat. Biotechnol. 2014, 32, 992. [DOI] [PubMed] [Google Scholar]
- (2).Jones MB; Tomiya N; Betenbaugh MJ; Krag SS Biochem. Biophys. Res. Commun. 2010, 395, 36–41. [DOI] [PMC free article] [PubMed] [Google Scholar]
- (3).Chung CY; Yin B; Wang Q; Chuang KY; Chu JH; Betenbaugh MJ Biochem. Biophys. Res. Commun. 2015, 463, 211–215. [DOI] [PubMed] [Google Scholar]
- (4).Xu X; Nagarajan H; Lewis NE; Pan S; Cai Z; Liu X; Chen W; Xie M; Wang W; Hammond S; Andersen MR; Neff N; Passarelli B; Koh W; Fan HC; Wang J; Gui Y; Lee KH; Betenbaugh MJ; Quake SR; Famili I; Palsson BO; Wang J Nat. Biotechnol. 2011, 29, 735–741. [DOI] [PMC free article] [PubMed] [Google Scholar]
- (5).Lewis NE; Liu X; Li Y; Nagarajan H; Yerganian G; O’Brien E; Bordbar A; Roth AM; Rosenbloom J; Bian C; Xie M; Chen W; Li N; Baycin-Hizal D; Latif H; Forster J; Betenbaugh MJ; Famili I; Xu X; Wang J; Palsson BO Nat. Biotechnol. 2013, 31, 759–765. [DOI] [PubMed] [Google Scholar]
- (6).Birzele F; Schaub J; Rust W; Clemens C; Baum P; Kaufmann H; Weith A; Schulz TW; Hildebrandt T Nucleic Acids Res. 2010, 38, 3999–4010. [DOI] [PMC free article] [PubMed] [Google Scholar]
- (7).Baycin-Hizal D; Tabb DL; Chaerkady R; Chen L; Lewis NE; Nagarajan H; Sarkaria V; Kumar A; Wolozny D; Colao J; Jacobson E; Tian Y; O’Meally RN; Krag SS; Cole RN; Palsson BO; Zhang H; Betenbaugh MJ Proteome Res. 2012, 11, 5265–5276. [DOI] [PMC free article] [PubMed] [Google Scholar]
- (8).Yang Z; Halim A; Narimatsu Y; Jitendra Joshi H; Steentoft C; Ter-Borch Gram Schjoldager K; Alder Schulz M; Sealover NR; Kayser KJ; Bennett EP; Levery SB; Vakhrushev SY; Clausen H Mol. Cell. Proteomics 2014, 13, 3224. [DOI] [PMC free article] [PubMed] [Google Scholar]
- (9).Yang Z; Wang S; Halim A; Schulz MA; Frodin M; Rahman SH; Vester-Christensen MB; Behrens C; Kristensen C; Vakhrushev SY; Bennett EP; Wandall HH; Clausen H Nat. Biotechnol. 2015, 33, 842–844. [DOI] [PubMed] [Google Scholar]
- (10).North SJ; Huang HH; Sundaram S; Jang-Lee J; Etienne AT; Trollope A; Chalabi S; Dell A; Stanley P; Haslam SM J. Biol. Chem. 2010, 285, 5759–5775. [DOI] [PMC free article] [PubMed] [Google Scholar]
- (11).Cummings RD; Pierce JM Chem. Biol 2014, 21, 1–15. [DOI] [PMC free article] [PubMed] [Google Scholar]
- (12).Xu C; Ng DT Nat. Rev. Mol. Cell Biol. 2015, 16, 742–752. [DOI] [PubMed] [Google Scholar]
- (13).Zhang H; Li X.-j.; Martin DB; Aebersold R. Nat. Biotechnol. 2003, 21, 660–666. [DOI] [PubMed] [Google Scholar]
- (14).Kaji H; Saito H; Yamauchi Y; Shinkawa T; Taoka M; Hirabayashi J; Kasai K.-i.; Takahashi N; Isobe T. Nat. Biotechnol. 2003, 21, 667–672. [DOI] [PubMed] [Google Scholar]
- (15).Zielinska DF; Gnad F; Wisniewski JR; Mann M Cell 2010, 141, 897–907. [DOI] [PubMed] [Google Scholar]
- (16).Wada Y; Tajiri M; Yoshida S Anal. Chem. 2004, 76, 6560–6565. [DOI] [PubMed] [Google Scholar]
- (17).Fujitani N; Furukawa J; Araki K; Fujioka T; Takegawa Y; Piao J; Nishioka T; Tamura T; Nikaido T; Ito M; Nakamura Y; Shinohara Y Proc. Natl. Acad. Sci U. S. A. 2013, 110, 2105–2110. [DOI] [PMC free article] [PubMed] [Google Scholar]
- (18).Shah P; Yang S; Sun S; Aiyetan P; Yarema KJ; Zhang H Anal. Chem. 2013, 85, 3606–3613. [DOI] [PMC free article] [PubMed] [Google Scholar]
- (19).Yang S; Zhang L; Thomas S; Hu Y; Li S; Cipollo J; Zhang H Anal. Chem. 2017, 89, 6330–6335. [DOI] [PMC free article] [PubMed] [Google Scholar]
- (20).de Haan N; Reiding KR; Haberger M; Reusch D; Falck D; Wuhrer M Anal. Chem. 2015, 87, 8284–8291. [DOI] [PubMed] [Google Scholar]
- (21).Kammeijer GSM; Jansen BC; Kohler I; Heemskerk AAM; Mayboroda OA; Hensbergen PJ; Schappler J; Wuhrer M Sci. Rep. 2017, 7, 3733. [DOI] [PMC free article] [PubMed] [Google Scholar]
- (22).Yang S; Wang M; Chen L; Yin B; Song G; Turko IV; Phinney KW; Betenbaugh MJ; Zhang H; Li S Sci. Rep. 2015, 5, 17585. [DOI] [PMC free article] [PubMed] [Google Scholar]
- (23).Ruhaak LR; Steenvoorden E; Koeleman CA; Deelder AM; Wuhrer M Proteomics 2010, 10, 2330–2336. [DOI] [PubMed] [Google Scholar]
- (24).Yang G; Tan Z; Lu W; Guo J; Yu H; Yu J; Sun C; Qi X; Li Z; Guan FJ Proteome Res. 2015, 14, 639–653. [DOI] [PubMed] [Google Scholar]
- (25).Bigge JC; Patel TP; Bruce JA; Goulding PN; Charles SM; Parekh RB Anal. Biochem. 1995, 230, 229. [DOI] [PubMed] [Google Scholar]
- (26).Ciucanu I; Costello CE J. Am. Chem. Soc. 2003, 125, 16213. [DOI] [PubMed] [Google Scholar]
- (27).Kang P; Mechref Y; Klouckova I; Novotny MV Rapid Commun. Mass Spectrom. 2005, 19, 3421–3428. [DOI] [PMC free article] [PubMed] [Google Scholar]
- (28).Shubhakar A; Kozak RP; Reiding KR; Royle L; Spencer DI; Fernandes DL; Wuhrer M Anal. Chem. 2016, 88, 8562–8569. [DOI] [PubMed] [Google Scholar]
- (29).Scott NE; Parker BL; Connolly AM; Paulech J; Edwards AV; Crossett B; Falconer L; Kolarich D; Djordjevic SP; Hojrup P; Packer NH; Larsen MR; Cordwell SJ Mol. Cell. Proteomics 2011, 10, M000031–MCP201. [DOI] [PMC free article] [PubMed] [Google Scholar]
- (30).Parker BL; Thaysen-Andersen M; Solis N; Scott NE; Larsen MR; Graham ME; Packer NH; Cordwell SJ J. Proteome Res. 2013, 12, 5791–5800. [DOI] [PubMed] [Google Scholar]
- (31).Khatri K; Klein JA; White MR; Grant OC; Leymarie N; Woods RJ; Hartshorn KL; Zaia J Mol. Cell. Proteomics 2016, 15, 1895–1912. [DOI] [PMC free article] [PubMed] [Google Scholar]
- (32).Sun S; Shah P; Eshghi ST; Yang W; Trikannad N; Yang S; Chen L; Aiyetan P; Hoti N; Zhang Z; Chan DW; Zhang H Nat. Biotechnol. 2016, 34, 84–88. [DOI] [PMC free article] [PubMed] [Google Scholar]
- (33).Shajahan A; Supekar NT; Heiss C; Ishihara M; Azadi P Anal. Chem. 2017, 89, 10734–10743. [DOI] [PMC free article] [PubMed] [Google Scholar]
- (34).Yu Q; Wang B; Chen Z; Urabe G; Glover MS; Shi X; Guo L-W; Kent C; Li LJ Am. Soc. Mass Spectrom. 2017, 28, 1751–1764. [DOI] [PMC free article] [PubMed] [Google Scholar]
- (35).Cao Q; Zhao X; Zhao Q; Lv X; Ma C; Li X; Zhao Y; Peng B; Ying W; Qian X Anal. Chem. 2014, 86, 6804–6811. [DOI] [PubMed] [Google Scholar]
- (36).Liu M-Q; Zeng W-F; Fang P; Cao W-Q; Liu C; Yan GQ; Zhang Y; Peng C; Wu J-Q; Zhang X-J; Tu H-J; Chi H; Sun R-X; Cao Y; Dong M-Q; Jiang B-Y; Huang J-M; Shen HL; Wong CCL; He S-M; Yang P-Y Nat. Commun. 2017, DOI: 10.1038/s41467-017-00535-2. [DOI] [Google Scholar]
- (37).Takegawa Y; Deguchi K; Keira T; Ito H; Nakagawa H; Nishimura SJ Chromatogr. A 2006, 1113, 177–181. [DOI] [PubMed] [Google Scholar]
- (38).Zhang Z; Wu Z; Wirth MJ J. Chromatogr. A 2013, 1301, 156–161. [DOI] [PMC free article] [PubMed] [Google Scholar]
- (39).Yang W; Shah P; Hu Y; Toghi Eshghi S; Sun S; Liu Y; Zhang H Anal. Chem. 2017, 89, 11193–11197. [DOI] [PMC free article] [PubMed] [Google Scholar]
- (40).Jia X; Chen J; Sun S; Yang W; Yang S; Shah P; Hoti N; Veltri B; Zhang H Proteomics 2016, 16, 2989–2996. [DOI] [PMC free article] [PubMed] [Google Scholar]
- (41).Wang Y; Yang F; Gritsenko MA; Wang Y; Clauss T; Liu T; Shen Y; Monroe ME; Lopez-Ferrer D; Reno T; Moore RJ; Klemke RL; Camp DG; Smith RD Proteomics 2011, 11, 2019–2026. [DOI] [PMC free article] [PubMed] [Google Scholar]
- (42).Dowell JA; Frost DC; Zhang J; Li L Anal. Chem. 2008, 80, 6715–6723. [DOI] [PMC free article] [PubMed] [Google Scholar]
- (43).Hossler P; Khattak SF; Li Z. J. Glycobiology 2009, 19, 936–949. [DOI] [PubMed] [Google Scholar]
- (44).Walsh G; Jefferis R Nat. Biotechnol. 2006, 24, 1241–1252. [DOI] [PubMed] [Google Scholar]
- (45).Grainger RK; James DC Biotechnol. Bioeng. 2013, 110, 2970–2983. [DOI] [PubMed] [Google Scholar]
- (46).Dekkers G; Plomp R; Koeleman CA; Visser R; von Horsten HH; Sandig V; Rispens T; Wuhrer M; Vidarsson G Sci. Rep. 2016, 6, 36964. [DOI] [PMC free article] [PubMed] [Google Scholar]
- (47).Toghi Eshghi S; Shah P; Yang W; Li X; Zhang H Anal. Chem. 2015, 87, 5181–5188. [DOI] [PMC free article] [PubMed] [Google Scholar]
- (48).Hu Y; Shah P; Clark DJ; Ao M; Zhang H Anal. Chem. 2018, 90, 8065–8071. [DOI] [PMC free article] [PubMed] [Google Scholar]
- (49).Bekker-Jensen DB; Kelstrup CD; Batth TS; Larsen SC; Haldrup C; Bramsen JB; Sorensen KD; Hoyer S; Orntoft TF; Andersen CL; Nielsen ML; Olsen JV Cell Syst. 2017, 4, 587–599. [DOI] [PMC free article] [PubMed] [Google Scholar]
- (50).Kim S; Pevzner PA Nat. Commun. 2014, 5, 5277. [DOI] [PMC free article] [PubMed] [Google Scholar]
- (51).Granholm V; Kim S; Navarro JC; Sjolund E; Smith RD; Kall LJ Proteome Res. 2014, 13, 890–897. [DOI] [PMC free article] [PubMed] [Google Scholar]
- (52).Tian Y; Kelly-Spratt KS; Kemp CJ; Zhang H J. Proteome Res. 2010, 9, 5837–5847. [DOI] [PMC free article] [PubMed] [Google Scholar]
- (53).Nielsen H In Protein Function Prediction: Methods and Protocols; Kihara D, Ed.; Springer: New York, NY, 2017; pp 59–73. [Google Scholar]
- (54).Krogh A; Larsson B; von Heijne G; Sonnhammer ELL J. Mol. Biol. 2001, 305, 567–580. [DOI] [PubMed] [Google Scholar]
- (55).Hart GW; Copeland RJ Cell 2010, 143, 672–676. [DOI] [PMC free article] [PubMed] [Google Scholar]
- (56).Sun S; Zhang H Anal. Chem. 2015, 87, 11948–11951. [DOI] [PMC free article] [PubMed] [Google Scholar]
- (57).O’Shea JP; Chou MF; Quader SA; Ryan JK; Church GM; Schwartz D Nat. Methods 2013, 10, 1211–1212. [DOI] [PubMed] [Google Scholar]
- (58).Ley D; Seresht AK; Engmark M; Magdenoska O; Nielsen KF; Kildegaard HF; Andersen MR Biotechnol. Bioeng. 2015, 112, 2373–2387. [DOI] [PMC free article] [PubMed] [Google Scholar]
- (59).Stubiger G; Marchetti M; Nagano M; Grimm R; Gmeiner G; Reichel C; Allmaier G. J. Sep. Sci 2005, 28, 1764–1778. [DOI] [PubMed] [Google Scholar]
- (60).Jensen PH; Karlsson NG; Kolarich D; Packer NH Nat. Protoc. 2012, 7, 1299–1310. [DOI] [PubMed] [Google Scholar]
- (61).Yin B; Gao Y; Chung CY; Yang S; Blake E; Stuczynski MC; Tang J; Kildegaard HF; Andersen MR; Zhang H; Betenbaugh MJ Biotechnol. Bioeng. 2015, 112, 2343–2351. [DOI] [PubMed] [Google Scholar]
Associated Data
This section collects any data citations, data availability statements, or supplementary materials included in this article.