

Abstract
Improving the utilization of pharmacologic agents in the pediatric population yields significant, perhaps life‐long, benefits. Genetic factors related to the disposition of a medication or an alteration at the target receptor site contributes to the observed variability of exposure and response between individuals. An additional source of this variability specific to the pediatric population is ontogeny, where age‐specific changes during development may require dose adjustments to obtain the same levels of drug exposure and response. With significant improvements in characterizing both the ontogeny and genetic contributions of drug metabolizing enzymes, the time is right to begin placing more emphasis on response rather than only the dose‐exposure relationship. The amount of drug target receptors and the relative affinity for binding at that target site may require different levels of systemic exposure to achieve a desired response. Concentration‐controlled studies can identify the needed exposure for a response at the drug target, the level of expression of the target site in an individual patient, and the tools required to individualize response. Although pediatrics represents a large spectrum of growth and development, developing tools to improve drug delivery for each individual patient across the spectrum of the ages treated by clinicians remains valuable.
Implementation of precision therapeutics in children represents a unique opportunity to reevaluate the dose→exposure→response paradigm. Clinical Pharmacology provides the tool‐kit and set of skills to design studies, collect data, and build and validate models to ultimately anticipate the most probable clinical response to a medication at a selected dose, thereby leading to the ultimate goal of implementation of precision therapeutics in children. In pediatric clinical pharmacology, knowledge of the developmental trajectory of drug metabolizing enzymes and transporters involved in drug distribution has increased over the past several years; the focus can now change to drug targets in order to fully implement precision therapeutics. Approximately 50–70% of marketed drugs have not been studied well enough to provide labeling information and dosing information for pediatric specific indications.1 This limitation in labeling represents an opportunity for the field of pediatric clinical pharmacology as implementation of optimal treatment, maximizing therapeutic response while minimizing the risk of adverse events, early in life, or once pediatric‐onset diseases/disorders manifest has considerable potential to change the course of the disease process over the affected child's lifetime. Off‐label use of medications in children likely contributes to medication‐related rates of harm that are three times those of adults.2, 3 Implementation of effective treatment also has the potential to reduce the burden of adverse drug reactions in childhood (e.g., ototoxicity or nephrotoxicity due to aminoglycosides; cardiotoxicity from anthracyclines), consequences that will be borne by the child/family throughout the remainder of the child's life. In children, the process of growth and development, or ontogeny, is now recognized as an important factor influencing drug disposition, and knowledge of the developmental changes in multiple drug biotransformation enzymes and transporters involved in drug absorption, distribution, metabolism, and excretion continues to increase,4 although it is increasingly apparent that comparable data regarding the ontogeny of transporters are equally important.5 Additionally, exogenous factors like diet (breast feeding vs. formula feeding) need to be considered for the influence they can have on the ontogeny of drug biotransformation pathways or on the pathways themselves.6 Finally, comorbidities such as obesity, renal disease, cardiac pathology, or prematurity can alter the dose→exposure relationship and influence response.7
The issue of ontogeny of the targets of drug action (e.g., receptors, proteins, ion channels, other molecules, etc.) remains essentially unaddressed in the pediatric literature and thereby represents an opportunity to create new knowledge related to the dynamics of the exposure→response relationship during growth and development. Developmental changes in the expression of drug targets could have important implications for predicting drug response in different pediatric populations as a young child may not respond to a given concentration of a medication as anticipated based on adult data if the target of that drug is not expressed at that stage of development. This issue is addressed in a recent commentary by Marin,8 in which the age of onset of neurodevelopmental, behavioral, and psychiatric disorders, such as autism, attention‐deficit/hyperactivity disorder (ADHD), anxiety disorders, schizophrenia, bipolar, and major depressive disorders, are presented in the context of the dynamic changes in brain growth and timing of neurobiological processes occurring between prenatal life and maturation in adulthood. Developmental changes in the expression and function of neurotransmitter receptors and related biosynthesis and catabolism pathways accompanying maturation, let alone changes related to disease pathogenesis, adds complexity with respect to the consequences of using atypical psychotics, selective serotonin reuptake inhibitors, and stimulants to manage neurodevelopmental and behavioral disorders in children; in the absence of data regarding drug target (neurotransmitter receptor and reuptake transporter, for example) expression in autism and other developmental and behavioral disorders, establishing the exposure→response relationship becomes quite challenging. Accumulating data regarding the developmental trajectories of drug metabolizing enzymes and transporters over the past several years has greatly improved our understanding of the dose→exposure→response, and a similar focus on ontogeny and other sources of variability in the expression of drug targets in the central nervous system and elsewhere is essential to move the field forward. The use of targeted metabolomic panels to stratify patients according to antidepressant response in adults9 provides hope that similar strategies can be applied to children to characterize the ontogeny of drug response pathways in children.
Ultimately, what drives the decision to initiate therapeutic interventions is a specific desired clinical outcome; implementation of a precision therapeutic strategy should include knowledge of the factors that make each child unique with respect to the disposition and response of the therapeutic intervention. In addition to ontogeny, genetic variation is another factor that defines each child as a unique individual. Furthermore, the interaction between ontogeny, genetic variation, and other factors (e.g., environmental and pediatric disease‐specific) may not be apparent from prior experience in adults, and adds complexity to the dilemma faced by pediatricians seeking to optimize the clinical response. In the course of this paper, we will discuss several issues relevant to implementing precision therapeutics in pediatric patients. The complexity of the interaction between ontogeny and genetic variation in drug disposition and response will be introduced using pediatric studies of warfarin pharmacogenomics as a case study. Next, the central role of drug exposure in bridging the gap between drug dose and response to the medication will be assessed in a precision therapeutics context through consideration of the “response→exposure→dose” relationship, including the need to minimize variability in the dose→exposure relationship to facilitate studies investigating factors contributing to variability in the exposure→response relationship. We propose that implementing precision therapeutics at the level of an individual patient will require changes in the way that we think about existing data from “populations” that are applied to inform decisions in individual patients, and conclude with some challenges for the future.
Warfarin case study
Central to the implementation of precision therapeutics in children is the critical importance of genetic variation and ontogeny as key determinants of interindividual variability in drug disposition and response, and the use of this (and other available) information to determine the drug and dose that is “just right” for an individual child. The complexity of the interplay between ontogeny and genetic variation on both the dose→exposure and exposure→response relationships in a pediatric context is best exemplified by the case of warfarin, specifically the relationship between warfarin dose and therapeutic end points (primarily achievement of a stable International Normalized Ratio (INR) within a defined range). For warfarin, it is well established that younger children require larger weight‐based (mg/kg) doses than do older children or adults to achieve a comparable target INR response.10, 11, 12 This observed age effect has been largely attributed to age‐dependent changes in the ratio of liver mass to total body mass based on the data presented by Takahashi et al.,13 who demonstrated that the apparent oral clearance of unbound S‐warfarin adjusted for body weight was ~ 50% greater in prepubertal (mean 6 years; range 1–11 years) Japanese children compared with postpubertal (mean 14 years; range 12–18) children and adults; age‐dependent differences apparent after adjusting clearance for weight essentially were considered artefactual by these authors as the age‐dependent differences in clearance across the three age groups disappeared when values were expressed relative to estimated liver mass. These authors also observed that the pharmacodynamic response to warfarin also seemed to differ between children and adults, but additional investigation of age‐dependent differences in warfarin disposition and response received relatively little attention until the results of pharmacogenetics studies started appearing in the literature 10 years later.
Several studies of the pharmacogenetics of the response to vitamin K antagonists in children have been published since 201012, 13, 14, 15, 16, 17, 18, 19 and consistently have reported that children with vitamin K oxidoreductase complex 1 (VKORC1) ‐1639AA genotypes require significantly lower doses of warfarin to achieve the same target INR as children with VKORC1 ‐1639GG genotypes, similar to the results of adult studies.20 However, what is highly inconsistent among the pediatric studies is the relative importance of genetic (primarily VKORC1 and CYP2C9 genotype) and nongenetic/”developmental” factors as determinants of variability in the warfarin dose required to achieve a stable target INR. In contrast to adults in whom genetic factors account for 40–50% of variability in dose (VKORC1 genotype: 25–30%; CYP2C9 genotype 12–16%) and nongenetic factors (age, weight, concurrent medications, and smoking status) account for <20%,21 corresponding values from the pediatric studies are highly variable. For example, in the first pediatric study,22 age accounted for 28.3% of dose variability, and genetic factors contributed ~4% (3.7% for VKORC1 and 0.4% for CYP2C9). In six subsequent studies, the genetic contribution (predominantly VKORC1 genotype) was much larger, accounting for 11.9–52% of dose variability, but in four of these the contribution of age, height, and weight as surrogates for the “developmental” component (29.2–52.8% of dose variability) exceeded the genetic contribution (11.9–21.1%).11, 15, 17, 18 Noteworthy are the various ways that “dose” was expressed in the statistical analyses: uncorrected (mg15, 18), corrected for weight (mg/kg16) or transformed for normalization (mg1/2,11, 12 (mg/kg)1/2,22 and log(mg/kg)17). Equally inconsistent is the choice of “developmental” factor given that changes in age, height, and weight tend to be quite well‐correlated during growth and development.
The discrepancies in the relative contributions of genetic variation and age‐related factors described above raise the possibility that the “developmental’ component may be obscuring the genotype‐phenotype relationships expected from adult studies. Theoretically, then, limiting a study cohort to a relatively narrow age range should allow any effect related to age or developmental changes to be minimized. We noted that within our study cohort, study participants with Fontan circulations were more homogenous with respect to age compared with participants with non‐Fontan indications for warfarin treatment. Therefore, the statistical approach applied to the entire study cohort11 was applied to the Fontan and non‐Fontan groups separately, and the results are presented in Figure 1 . In each panel, the relationship between weight‐corrected dose (normalized by taking the square root) as a function of age is presented for all participants in the study. In Figure 1 a, Fontan patients are highlighted as solid black symbols, and no relationship between dose to achieve a stable INR and age is apparent by linear regression (r 2 = 0.071, P > 0.05). Review of the statistical analysis presented as a table adjacent to the dose vs. age plot reveals that for the Fontan patients, genetic factors accounted for a greater proportion of the observed variability than did age. In contrast, a significant relationship (r 2 = 0.617, P < 0.0001) exists between dose and age in participants receiving warfarin for indications other than a Fontan circulation (solid black symbols in Figure 1 b), with the contribution of age accounting for the majority of the observed variability in dose, whereas the contribution of genetic factors is ~ 5%, similar to that reported by Nowak‐Göttl et al.22
Figure 1.
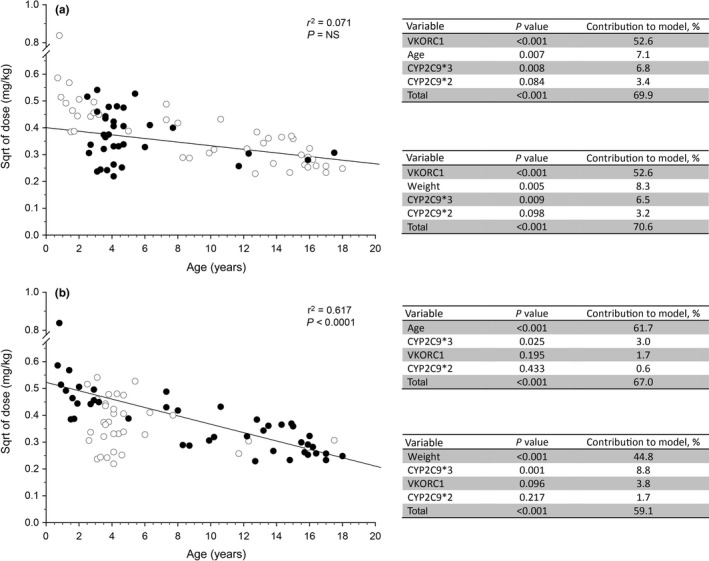
Subgroup analysis of the relative contribution of genetic and nongenetic factors to observed variability in warfarin dose required to achieve a stable International Normalized Ratio in children. Data from a previously published study11 were used to determine if “developmental” factors may be obscuring the genotype‐phenotype relationships expected from adult studies. Study participants with Fontan circulations were noted to be more homogenous with respect to age compared with participants with non‐Fontan indications for warfarin treatment. (a) The relationship between weight‐corrected dose (normalized by taking the square root (sqrt)) as a function of age is presented for all participants in the study (open symbols), and Fontan patients are highlighted as solid black symbols. Statistical analysis as described in the original study was applied to the Fontan subgroup, and the results are presented in tables adjacent to the plot; substitution of “age” with “weight” does not alter the observation that genetic factors account for more of the variability than developmental factors. (b) The relationship between weight‐corrected dose as a function of age is presented for all participants in the study as described above, and study participants receiving warfarin for indications other than a Fontan circulation are highlighted as solid black symbols. Statistical analysis as described in the original study was applied to the non‐Fontan subgroup, and the results are presented in the tables adjacent to the plot. A significant relationship (r 2 = 0.617, P < 0.0001) exists between dose and age, with the contribution of “age” accounting for the majority of the observed variability in dose. NS, not significant; VKORC1, vitamin K oxidoreductase complex 1.
The differences in relative contribution of genetic variation and developmental processes presented above are preliminary at best but if replicated have important implications for pediatric pharmacogenomics studies and implementation of precision therapeutics in children. First, it is unclear whether the differences in the Fontan and non‐Fontan patients presented in Figure 1 reflect removal of an obfuscating factor by restricting the analysis to a narrower age range, or whether there are fundamental differences related to disease pathophysiology of the underlying conditions requiring warfarin intervention in children. In this context, warfarin therapy is initiated following a Fontan procedure to minimize the risk of thrombosis in the Fontan circuit and embolization to the lung and/or central nervous system. In the pediatric pharmacogenomics studies discussed above, Fontan patients generally were titrated to a lower target INR range than non‐Fontan patients, and Fontan patients have been reported to require 25% lower doses of warfarin to achieve a comparable target INR compared with non‐Fontan patients with or without congenital heart disease10; there are a number of factors related to a single functioning ventricle that may affect warfarin disposition and response, including compromised hepatic blood flow and altered hepatic function.23 A recently published study of acenocoumarol in Dutch children found the presence of a Fontan circulation to account for 17.3% of the variability in the dose required to achieve the target INR, and confirmed that Fontan patients required a lower acenocoumarol dose even when stratified by INR range.19 Thus, different disease processes for the underlying indications for warfarin use may confound the interpretation of pediatric pharmacogenomics studies involving vitamin K antagonists. This possibility leads to a second important implication: treatment with warfarin was the primary inclusion criterion for the pediatric warfarin studies to ensure adequate cohorts for analysis, not an uncommon situation for any pediatric pharmacogenetic study. Thus, the practice of enrolling all pediatric patients based primarily on use of a specific medication, without consideration of underlying disease process—for vitamin K antagonists, enrolled patients may be receiving a drug for primary prevention of a thromboembolic event or prophylaxis to prevent recurrent thromboembolic events, both of which may be cardiac or noncardiac in origin, and post‐Fontan procedure—risks defeating the purpose of conducting the study in the first place. Furthermore, these observations have implications for development of dosing algorithms for use in pediatric patient populations. Whereas Fontan patients represented at least 50% of the cohorts in several of the other studies, none was included in the Nowak‐Göttl cohort13 (only 5% non‐Fontan cardiac patients) in which genetic factors were observed to make the least contribution to warfarin dose variability.22 Thus, if genotype‐phenotype associations do actually differ between Fontan and non‐Fontan patients within pediatric cohorts, a single “pediatric” dosing algorithm may not perform equally well in all children treated with a given vitamin K antagonist. Finally, the relatively high percentage of Fontan patients in the warfarin‐treated pediatric population raises concerns about the suitability of dosing algorithms scaled from adult data to pediatric populations that may not share the pathophysiology associated with warfarin therapy in adults.
This warfarin case study also illustrates a key challenge in pediatric therapeutics—the need for improved mechanistic insights into the effects of increasing age, and specifically the processes involved in growth (e.g., changes in height, weight, and body composition) and development (e.g., progression through the various Tanner stages to achieve full sexual maturity) on drug disposition and response. In the context of warfarin, CYP2C9 activity is generally considered to be mature after 5 months of life,24 such that age‐dependent differences in the warfarin dose‐response relationship are unlikely to be due to CYP2C9 ontogeny. From a drug response perspective, Vear et al.,17 detected a significant VKORC1‐age interaction that accounted for 3% of dose variability, raising the possibility that the magnitude of the effect of VKORC1 genotype may differ between younger and older children, consistent with a previous report by Kato et al.,25 who observed age‐dependent differences in the relationship between INR and weight‐adjusted dose between patients less than and older than 6.6 years of age in a VKORC1 genotype–dependent manner. Albeit limited, available data suggest that VKORC1 expression remains constant after birth. Baker et al.26 have reported that vitamin K epoxide reductase activity did not differ between postmortem liver samples from children aged 1−6 months (n = 9) and 1–10 years of age (n = 10). Furthermore, in a study of the developmental trajectory of two VKORC1 splice variants in 48 pediatric liver samples ranging in age from birth to 17 years of age, we observed that the VKORC1‐1639G/G genotype was associated with a 2.3‐fold increased expression of the canonical transcript compared with GA and AA genotypes (P < 0.001) but no relationship with age. Similar results were observed for a splice variant lacking exon 2. Thus, VKORC1 ontogeny does not seem to account for the developmental effect observed in pediatric warfarin pharmacogenetic studies. On the other hand, developmental trajectories of the vitamin K–dependent clotting factors II, VII, IX, and X are distinct from those of the vitamin K‐dependent inhibitors protein C and protein S, as well as individual components of the fibrinolytic system,27 further confirming that treatment with vitamin K antagonists in children is not easily extrapolated from adult experience.
Essentially absent from pediatric (and adult) pharmacogenomic studies of vitamin K antagonists have been measures of exposure. Takahashi et al.,13 reported that the relationship between unbound concentration of S‐warfarin in plasma and the corresponding INR value was different between prepubertal children and adults, implying that age‐dependent differences in the pharmacodynamic response to warfarin may also be present, but deconvolution of the relative contributions of ontogeny and genetic variation to variability in the warfarin dose→exposure→response relationship will require measurement of not only systemic drug exposure (and especially concentrations of unbound drug) but also measurement of vitamin K concentrations (e.g., dietary intake likely to change as children grow older) to be incorporated into study designs.
Response→exposure→dose
The traditional approach to drug development and pharmacology training in general is built around the dose→exposure→response relationship—determination of the dose that, on average, optimizes therapeutic benefit and risk of toxicity in the patient population to which the drug is prescribed. However, in the current age of “‐omic” technology and the availability and accessibility to large amounts of individual patient‐level data, we believe now is the time to reconsider this relationship from the perspective of the individual patient and the provider seeking to implement precision therapeutics in his or her patient. In this context, a response→exposure→dose approach acknowledges that treatment with a medication is initiated with the intent of achieving some predefined therapeutic goal, implicit or explicit. Ideally, one would have knowledge of the drug exposure required to achieve the therapeutic goal while minimizing the risk of toxicity in that individual patient and then would prescribe (individualize) the dose necessary to achieve the desired exposure for that patient. The desired exposure is a function of factors affecting the level of expression or function of the drug target, whereas the dose required to achieve the desired exposure is a function of those factors involved in drug absorption, distribution, metabolism, and excretion. A fundamental knowledge deficit limiting implementation of precision therapeutics at the present time is an understanding of the drug exposure necessary to achieve a high probability of desired therapeutic response given the level of expression of the drug target (e.g., receptors, ion channels, and enzymes) in an individual patient. A major challenge when investigating variability in the response to a medication is differentiating poor clinical response that is a function of inadequate exposure from poor clinical response due to decreased expression/absence or reduced function of the target of drug action. The issue of variability in drug exposure assumes increasing importance for drugs that are substrates for polymorphic pathways, such as observed with CYP2D6 genotype and atomoxetine administration in children with ADHD.28 One may argue that dose escalation provides an opportunity to tailor a dose to the desired therapeutic response for an individual patient, but this argument is less than satisfactory in situations like behavioral disorders, in which a child's return to school (and a parent's return to work) is dependent on achieving clinical response quickly, situations in which approved doses have a ceiling and exposure remains low due to ultrarapid metabolizer genotypes,29 or in situations in which drug target function is compromised and response is unlikely regardless of exposure. Strategies to minimize variability in the dose→exposure relationship, therefore, provide an opportunity to investigate factors contributing to variability in the exposure→response relationship; just as administering the same dose of a medication to a population allowed genetic polymorphisms in drug biotransformation pathways to be revealed, administration of the same drug exposure should allow the contribution of genetic and other factors influencing drug response to be revealed.
Consider the situation in which the functional consequence of a genetic variant in a regulatory region affects the level of expression of the gene product. The relationship between drug concentration (as a surrogate for exposure) and the observed response for each genotype (homozygous reference sequence (Ref/Ref; blue curves, dotted lines and rectangles), homozygous variant (Var/Var; red curves, dotted lines and rectangles) and heterozygous genotype (Ref/Var; green curves, dotted lines and rectangles)), can be visualized as three parallel concentration‐response curves (Figure 2 ). In Figure 2 a, each copy of the variant allele is associated with a twofold decrease in expression, analogous to the reported effects of VKORC1 ‐1639G>A in the context of warfarin pharmacogenetics. Within the log‐linear region of the curves, the observed response associated with a given drug concentration (% inhibition of VKORC1 activity or reduction in norepinephrine uptake, for example) will be a function of the drug target genotype; the same concentration will produce a different response, depending on the drug target genotype. Similarly, the range of responses (designated as rectangles adjacent to the y‐axis colored according to the corresponding genotype curve) expected for a twofold range in drug concentrations (shaded rectangle) will differ, depending on drug target genotype (Figure 2 b). Viewed from a different perspective, to achieve the same therapeutic goal (horizontal shaded rectangle reflecting 30–70% inhibition in Figure 2 c) groups defined by drug target genotype or level of target expression will require unique ranges of exposures. However, when clearance of a drug is dependent on a polymorphic pathway and a given dose results in a wide range of exposures within the treated population, it is not possible to determine the contribution of variability at the level of the drug target to observed variability in drug response as it is obscured by the confounding effect of wide variability in exposure (Figure 1 d). Utilizing study designs incorporating dose individualization to administer the same drug exposure to all study participants reduces the variability in drug response due solely to variability in exposure and has the potential to reveal the contribution of variability at the level of the drug target (Figure 1 b).
Figure 2.
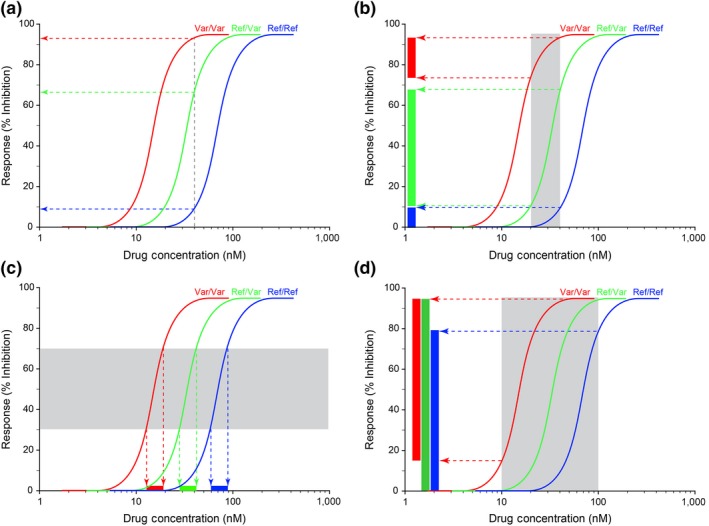
Rationale for the Respose→Exposure→Dose paradigm. The relationship between drug concentration (as a surrogate for exposure) and the observed response for each genotype (homozygous reference sequence (Ref/Ref; blue curves, dotted lines and rectangles), homozygous variant (Var/Var; red curves, dotted lines and rectangles), and heterozygous genotype (Ref/Var; green curves, dotted lines and rectangles)), can be visualized as three parallel concentration‐response curves. (a) Each copy of the variant allele for a theoretical drug target is associated with an approximately twofold decrease in target expression, as has been reported for the ‐1639G>A allele for vitamin K oxidoreductase complex 1 (VKORC1), the target of warfarin action.57 The observed response at a given drug concentration is a function of the drug target genotype, and differs for each genotype. (b) Similarly, a twofold range of concentrations (gray shaded area) will be associated with a range of responses that differ by drug target genotype (rectangles adjacent to the y‐axis colored according to the corresponding genotype curve). (c) To achieve the same therapeutic goal across the population, each group as defined by drug target genotype or level of expression will require a unique range of exposures. (d) When genetic variation in drug clearance results in a wide range of exposures for a given dose, the contribution of variation in drug target to the observed variability in drug response is obscured by the variability in exposure and cannot be detected. The shaded area is analogous to the 10‐fold range of area under the concentration‐time curve (AUC) reported for atomoxetine in the product label.
The concept of exposure‐controlled clinical studies is not a novel concept. Almost 30 years ago, Peck30 first proposed concentration‐controlled clinical trials as an alternative to more traditional study designs involving administration of the same dose, and subsequent publications have further explored the concept.31, 32 In April 2003, the US Food and Drug Administration released a Guidance for Industry entitled “Exposure‐Response Relationships – Study Design, Data Analysis, and Regulatory Applications.”33 One of the challenges inherent in conducting concentration/exposure‐controlled clinical trials is the requirement for a method to determine the dose required to achieve a target exposure, especially when the dose‐exposure relationship is influenced by genetic variation in the predominant clearance pathway. With increasing interest in the potential of model‐informed drug dosing to facilitate individualization of drug dosing,34 in early April 2018, the US Food and Drug Administration issued a Request for Comments on the 2003 Guidance document35 given the goal of advancing model‐informed drug development in the most recent version of the Prescription Drug User Fee Act (PDUFA VI). Clearly, application of model‐informed dosing to individualize the dose of medication required to achieve the drug exposure associated with the desired therapeutic response for a given degree of drug target expression or function is critical for clinical implementation of precision therapeutics.
Think “individual,” not population
A particular challenge when conducting investigations in the pediatric age range relates to the inherent heterogeneity of a study population due to developmental trajectories associated with growth (increases in height and weight) and sexual maturation. For example, a pediatric study may include patients ranging in age from 2−18 years, but even if a study is restricted to a narrower range, say 10–15 years, considerable heterogeneity in terms of individual characteristics, such as height, weight, or stage of development may still persist within that age range. In the context of a clinical study, the demographic characteristics of the study cohort are generally expressed as a mean ± SD for age, height, weight, etc.; in other words, individual participants contribute to the characteristics of the “population,” and study outcomes or results (e.g., pharmacokinetic parameters) are reported as the mean ± SD for the entire cohort. In contrast, implementation of precision therapeutics implies that relevant features and characteristics unique to the individual should drive the decision of drug and dose, rather than simply prescribing the dose that, on average, results in the desired response in the treated population to each individual in the population. Thus, we need to shift our focus from “populations” and “averages” to “individuals.” For example, it is common practice to describe participants in a study in the context of population distribution of demographic factors, whereas implementation of precision therapeutics requires consideration of a patient's unique characteristics that define them as individuals with respect to drug distribution and response. Figure 3 illustrates this point by depicting the demographic characteristics of children and adolescents participating in a longitudinal phenotyping study as population distributions with respect to their age and height at the first study visit (Figure 3 a) or as unique individuals defined by their age, weight, height, gender, and Tanner stage of sexual maturation (Figure 3 b); the color or size of each symbol could also be changed to represent genetic factors, such as CYP2D6 genotype or phenotype. Given the heterogeneity of a pediatric population, it may not be reasonable to expect that administration of the same dose to any one of these patients will result in the same degree of clinical response in all patients. Thus, a major challenge for implementing precision therapeutics in pediatrics (or adults), is identifying as many sources of variability in drug disposition and response as possible and incorporating those factors as input into clinical decision support tools.
Figure 3.
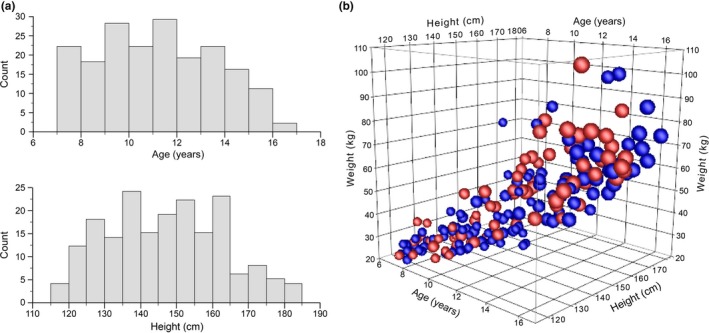
Representation of study participants as a “population” or as “individuals.” Demographic data at enrollment in a longitudinal phenotyping study investigating changes in CYP2D6 activity during puberty. (a) Frequency histograms of the age and height of study participants at the first study visit. (b) The same data as a, except that each participant is represented as an individual according to their unique age, height and weight (three axes), sex (women = red spheres; men = blue spheres), and Tanner stage for breast development (women) or testicular size (men) indicated by the size of the spheres, ranging from stage 1 (smallest spheres) to stage 5 (largest spheres).
Additional sources of variability beyond ontogeny and genetic variation (e.g., interindividual variability within a genotype group)
Even within specified genotype groups, large variations in the amount of drug exposure may occur. In the case of atomoxetine, a single dose, CYP2D6 genotype‐stratified pharmacokinetic study was performed with grouping based on genotype‐predicted phenotype (“activity score”) in 23 children and adolescents with ADHD. As anticipated, there were large differences in systemic exposure based on area under the concentration‐time curve (AUC) between the extremes of phenotype: poor metabolizers at one end of the spectrum and extensive metabolizers at the other (29.6‐fold when corrected for dose). However, even within each activity score stratum, systemic exposure varied considerably.28 For example, after correcting for the dose administered (0.5 mg/kg), the range in AUC values observed in the CYP2D6 poor metabolizer group was quite large in absolute terms; ~40–60 μM*hours, a difference of 20 area units but quite small in relative terms (1.5‐fold) compared with the extensive metabolizer group, which showed a much smaller absolute range (2–10 μM*hours) but a fourfold to fivefold range in values in relative terms.28 Indeed, in vivo phenotyping studies have confirmed that considerable (>1 order of magnitude) interindividual variability within CYP2D6 genotype groups exists36 and, thus, in addition to CYP2D6 genotype, contribute to interindividual variability in the clearance of CYP2D6 substrates. In the case of atomoxetine, CYP2D6‐mediated 4‐hydroxylation may be the primary clearance pathway, but additional pathways, such as CYP2C19‐mediated N‐demethylation, also contribute to the clearance of the parent compound. Thus, pharmacogenetic considerations affecting the primary clearance pathway may represent a step toward precision therapeutics, but genotype alone is unlikely to account for all observed variability in a drug‐related phenotype and, therefore, is not sufficient for fully informative precision dosing tools.
The results of an SLCO1B1 genotype‐stratified pharmacokinetic study of simvastatin in children and adolescents with dyslipidemia provides another example of the importance of looking beyond genetic variation in primary clearance pathways.37 Although the genotype‐phenotype association for SLCO1B1 c.521T>C and simvastatin acid AUC reported in adults38 could be replicated in a pediatric cohort, the magnitude of the effect was larger in children.37 More important, however, was the extent of variability in simvastatin acid AUC within the SLCO1B1 c.521 TT and TC genotype groups—17‐fold and 8‐fold, respectively, observed in the pediatric study. To some extent, this rather extensive variability within the c.521 TT and TC genotype groups was due to the observation that 25% of the pediatric patients in this study cohort had negligible simvastatin acid concentrations over the study period. It remains unclear whether this observation is related to decreased simvastatin acid formation (i.e., developmental differences in that expression of enzymes responsible for hydrolysis of simvastatin lactone between children and adults), presystemic biotransformation, or enhanced clearance of simvastatin acid. The important observation is that within genotype variability in simvastatin acid AUC (17‐fold and 8‐fold for the c.521 TT and TC groups, respectively) exceeded the 2.5‐fold difference in mean AUC observed between the two genotype groups, indicating that dosing algorithms based solely on SLCO1B1 genotype will be not be adequate to reduce variability in the dose→exposure relationship. Furthermore, identifying the factor(s) responsible for low simvastatin acid exposure is critical to determine children/adolescents that may be unlikely to respond to the drug simply due to inadequate concentrations of the therapeutically active form of the drug. A similar SLCO1B1 genotype‐stratified pharmacokinetic study of pravastatin in children with dyslipidemia confirmed both the expected genotype‐phenotype relationship in systemic exposure based on adult experience as well as the considerable (> 10‐fold) variability in dose‐normalized AUC within c‐521TT and c.521TC genotype groups39). However, factors contributing to the within genotype interindividual variability seem to be statin‐specific as for pravastatin, extent of presystemic isomerization of pravastatin to 3α‐pravastatin in the acidic conditions of the stomach after oral administration contributed to interindividual variability in pravastatin AUC in the c.521TC group, whereas unexpectedly high systemic exposure to pravastatin in four individuals with SLCO1B1 c.521TT genotypes seemed related to body mass index z‐score (> +2.5) and to be unique to pravastatin as these four high outliers did not display unusual disposition of simvastatin acid in the simvastatin study.
Multiple factors may contribute to interindividual variability among children with nominally the same genotype, including renal function, concurrent medications, inflammation, and other disease processes, among others. One factor currently receiving considerable attention is obesity. One in six children in the United States meet criteria for obesity, and yet dosing guidelines are severely lacking for this growing population of children,40, 41 especially because obese patients traditionally are excluded from clinical trials. The pediatric obesity epidemic brings with it increasing need for pediatricians to treat obesity‐related comorbidities (e.g., type II diabetes mellitus, hypertension, and hypercholesterolemia)42, 43 that traditionally have not had their origins in childhood, a situation that has resulted in a critical therapeutic information gap. One example of this challenge occurs with gastroesophageal reflux disease, a condition that is six times more prevalent in obese children44 and most commonly treated with proton pump inhibitors (PPIs), substrates for polymorphically expressed hepatic CYP2C19.45 Recently published studies of pantoprazole pharmacokinetics in obese children and adolescents provide evidence that, after adjusting for mg/kg dose received, systemic exposure to the PPI pantoprazole is twofold higher in obese children compared with nonobese age‐matched, sex‐matched, and CYP2C19‐genotype‐matched peers.46 Furthermore, although dosing based on lean body weight results in systemic exposures comparable with those associated with therapeutic response in nonobese children and adults,47 one should not ignore the possibility that physiologic changes accompanying obesity, such as a proinflammatory state48 or nonalcoholic fatty liver disease,49 may contribute altered expression and activity of drug clearance pathways.50 One consequence of an altered dose‐exposure relationship for pantoprazole and potentially other PPIs in obese children is an increased risk of toxicity, such as osteopenia and pulmonary infection.51, 52, 53 PPIs generally are considered to have a broad therapeutic index and, thus, may not be considered high priority candidate drugs for a precision therapeutics approach. However, the combination of considerable variability (> 100‐fold) in the plasma concentrations of parent drugs after dose normalization and the contribution of obesity to the observed variability implies that failing to consider genetic and nongenetic factors of medications perceived to be relatively innocuous may place some children at risk of poor therapeutic response or unnecessary toxicity, although a clear exposure→response relationship for osteopenia and pulmonary infections remains to be established. Similarly, investigation of the effect of nongenetic factors, such as the Fontan circulation and warfarin disposition and response discussed above as well as obesity and accompanying pathophysiologic changes, on the expression and function of drug targets remains relatively unexplored. Even after considering multiple predictors, there still may be large interindividual variability remaining, and model‐informed precision dosing can consider this remaining interindividual variability in dosing considerations so that the dose optimizes the probability of achieving the desired “target” or “response” for a patient with a specific set of predictors.
Application of “population” data to “individual” children
Genetic testing to aid in disease diagnosis and to individualize treatment is becoming increasingly more prevalent with the advent of commercial testing, particularly in the fields of cancer and psychiatry/behavioral medicine. One of the richest areas with respect to genetic association studies of drug response in children involves the use of stimulants for the treatment of ADHD.54 When a statistically significant association between treatment response and a particular gene and variant is observed, it is tempting to include that gene/variant in a commercially available panel to guide drug selection for an individual patient. However, application of population data to predict treatment response in individual children is not straight forward. For example, two separate studies have reported a statistically significant association between a single nucleotide polymorphism (SNP) in the regulatory region of the adrenergic α2A receptor gene (‐1291 C>G; rs1800544) and response to methylphenidate in children with ADHD.55, 56 The results of these studies have been presented in support of including this SNP in commercial panels; for each study, sufficient information is provided to construct 2 × 2 tables from which sensitivity, specificity, positive predictive value (PPV), and negative predictive value (NPV) can be determined. Data from da Silva et al.,55 are presented in Table 1 along with calculated values for sensitivity, specificity, PPV, and NPV (results from McCracken et al.,56 are presented in Table 2 ). To assess the value of these data to inform decisions for an individual patient, consider the situation in which the test has been conducted, and a child with ADHD is reported to have a G allele–containing genotype. Of most interest to the pediatrician (and parent) is the probability that the child will improve following methylphenidate administration—the PPV. In this situation, the PPV is estimated to be 72.5% based on data from one study55, 56 and 40% in the other,55, 56 in other words, one suggests that this genotype is associated with improvement, whereas the SNP is associated with no improvement in the other study. Both studies have rather small sample sizes, n = 5955 and n = 58,56 involve different disease phenotypes (ADHD, primarily inattentive type vs. autism spectrum disorder with comorbid hyperactivity), and different clinical end points (response defined as ≥ 50% decrease in SNAP‐IV score vs. “much improved” or “very much improved” on Clinical Global Impression). In the absence of prospective validation of the test to determine disease phenotypes/patient populations in which the test has value, widespread adoption is not warranted at this time.
Table Table 1.
A 2 × 2 table constructed from data reported by da Silva et al. 55 on the association between allelic variants of rs1800544 in ADRA2 and clinical response to methylphenidate in ADHD, primarily inattentive type ( P = 0.016), from which the corresponding values for sensitivity, specificity, PPV, and NPV have been calculated
| Improvement | No improvement | ||
|---|---|---|---|
| ADRA2 rs1800544 G allele present (G/G or G/C) | 29 | 11 | 40 |
| ADRA2 rs1800544 G allele absent (C/C) | 9 | 10 | 19 |
| 38 | 21 | 59 |
ADHD, attention‐deficit/hyperactivity disorder; ADRA2, adrenergic α2A receptor gene; NPV, negative predictive value; PPV, positive predictive value.
Sensitivity: 29/38 = 76.3%.
Specificity: 10/21 = 47.6%.
PPV: 29/40 = 72.5%.
NPV: 10/19 = 52.6%.
Table Table 2.
A 2 × 2 table constructed from data reported by McCracken et al. 56 on the association between allelic variants of rs1800544 in the adrenergic α2A receptor gene and clinical response to methylphenidate in autism spectrum disorder with comorbid hyperactivity ( P < 0.02), from which the corresponding values for sensitivity, specificity, PPV, and NPV have been calculated
| Responder | Nonresponder | ||
|---|---|---|---|
| ADRA2 rs1800544 G allele present (G/G or G/C) | 12 | 18 | 30 |
| ADRA2 rs1800544 G allele absent (C/C) | 20 | 8 | 28 |
| 32 | 26 | 58 |
ADRA2, adrenergic α2A receptor gene; NPV, negative predictive value; PPV, positive predictive value.
Sensitivity: 12/32 = 37.5%.
Specificity: 8/26 = 30.8%.
PPV: 12/30 = 40.0%.
NPV: 8/28 = 28.6%.
Conclusions and future directions
Much progress has been made the past several years characterizing the ontogeny of drug metabolizing enzymes and their contribution to variability in the dose→exposure relationship during growth and development. Much less attention has been paid to the role of ontogeny and genetic variation of drug targets on observed variability in drug response and how the exposure→response relationship changes from the neonatal period through adolescence and into adulthood. The current challenge for pediatric clinical pharmacology and its application in the form of precision therapeutics for children of all ages is to shift our focus beyond ontogeny and genetic variation in genes associated with drug disposition to those associated with drug response. Doing so is not a trivial task. First, the availability of analytical platforms capable of detecting drugs and metabolites with high sensitivity from small sample volumes has been an important development facilitating the generation of pharmacokinetic data from various pediatric populations. The availability of pediatric‐friendly, objective measures of drug response is a completely different matter, but metabolomic analyses and patterns of biochemical changes in response to medicines may prove valuable. This is subject to first understanding how patterns and pathways change during growth and development. Second, it is extremely difficult to differentiate between lack of response that is due simply to inadequate drug exposure, even at the maximum recommended dose, from lack of response to low expression/absence of a drug target or nonsynonymous genetic variation within the coding region of the gene that alters the function of the drug target or its interaction with the drug. As a potential solution for this latter challenge, we believe that exposure‐escalation studies (as opposed to dose‐escalation studies) should be considered. Implicit in any concentration‐controlled or exposure‐controlled study is the requirement for validated tools to individualize dosing to achieve the desired exposure, and, thus, sufficient knowledge of genetic and other factors contributing to variability in drug disposition to build reliable tools. Thus, a challenge for the future is to move beyond descriptive analysis of drug disposition in children to the development of prospective models that facilitate investigation of exposure→response relationships.
Funding
Eunice Kennedy Shriver National Institute of Child Health and Human Development (NICHD) NICHD 5T32HD069038, American Heart Association National Affiliate Clinical Research Program (13CRP17110023), and Eunice Kennedy Shriver NICHD U54‐HD0900258.
Conflict of Interest
As an Associate Editor for Clinical and Translational Science, V.S. was not involved in the review or decision process for this paper. The authors declared no competing interests for this work.
References
- 1. Roberts, R. , Rodriguez, W. , Murphy, D. & Crescenzi, T. Pediatric drug labeling: improving the safety and efficacy of pediatric therapies. JAMA 290, 905–911 (2003). [DOI] [PubMed] [Google Scholar]
- 2. Kimland, E. & Odlind, V. Off‐label drug use in pediatric patients. Clin. Pharmacol. Ther. 91, 796–801 (2012). [DOI] [PubMed] [Google Scholar]
- 3. Fortescue, E.B. et al Prioritizing strategies for preventing medication errors and adverse drug events in pediatric inpatients. Pediatrics 111, 722–729 (2003). [DOI] [PubMed] [Google Scholar]
- 4. Leeder, J.S. & Meibohm, B. Challenges and opportunities for increasing the knowledge base related to drug biotransformation and pharmacokinetics during growth and development. Drug Metab. Dispos. 44, 916–923 (2016). [DOI] [PubMed] [Google Scholar]
- 5. Brouwer, K.L. et al Human ontogeny of drug transporters: review and recommendations of the Pediatric Transporter Working Group. Clin. Pharmacol. Ther. 98, 266–287 (2015). [DOI] [PMC free article] [PubMed] [Google Scholar]
- 6. Blake, M.J. , Abdel‐Rahman, S.M. , Pearce, R.E. , Leeder, J.S. & Kearns, G.L. Effect of diet on the development of drug metabolism by cytochrome P‐450 enzymes in healthy infants. Pediatr. Res. 60, 717–723 (2006). [DOI] [PubMed] [Google Scholar]
- 7. Harskamp‐van Ginkel, M.W. et al Drug dosing and pharmacokinetics in children with obesity: a systematic review. JAMA Pediatr. 169, 678–685 (2015). [DOI] [PMC free article] [PubMed] [Google Scholar]
- 8. Marin, O. Developmental timing and critical windows for the treatment of psychiatric disorders. Nat. Med. 22, 1229–1238 (2016). [DOI] [PubMed] [Google Scholar]
- 9. Ji, Y. et al Glycine and a glycine dehydrogenase (GLDC) SNP as citalopram/escitalopram response biomarkers in depression: pharmacometabolomics‐informed pharmacogenomics. Clin. Pharmacol. Ther. 89, 97–104 (2011). [DOI] [PMC free article] [PubMed] [Google Scholar]
- 10. Streif, W. et al Analysis of warfarin therapy in pediatric patients: a retrospective cohort study of 319 patients. Blood 94, 3007–3014 (1999). [PubMed] [Google Scholar]
- 11. Shaw, K. et al VKORC1 and CYP2C9 genotypes are predictors of warfarin‐related outcomes in children. Pediatr. Blood Cancer 61, 1055–1062 (2014). [DOI] [PubMed] [Google Scholar]
- 12. Biss, T.T. et al VKORC1 and CYP2C9 genotype and patient characteristics explain a large proportion of the variability in warfarin dose requirement among children. Blood 119, 868–873 (2012). [DOI] [PubMed] [Google Scholar]
- 13. Takahashi, H. et al Developmental changes in pharmacokinetics and pharmacodynamics of warfarin enantiomers in Japanese children. Clin. Pharmacol. Ther. 68, 541–555 (2000). [DOI] [PubMed] [Google Scholar]
- 14. Johnson, J.A. et al Clinical Pharmacogenetics Implementation Consortium Guidelines for CYP2C9 and VKORC1 genotypes and warfarin dosing. Clin. Pharmacol. Ther. 90, 625–629 (2011). [DOI] [PMC free article] [PubMed] [Google Scholar]
- 15. Moreau, C. et al Vitamin K antagonists in children with heart disease: height and VKORC1 genotype are the main determinants of the dose requirement. Blood 119, 861–867 (2012). [DOI] [PMC free article] [PubMed] [Google Scholar]
- 16. Nguyen, N. , Anley, P. , Yu, M.Y. , Zhang, G. , Thompson, A.A. & Jennings, L.J. Genetic and clinical determinants influencing warfarin dosing in children with heart disease. Pediatr. Cardiol. 34, 984–990 (2013). [DOI] [PubMed] [Google Scholar]
- 17. Vear, S.I. , Ayers, G.D. , van Driest, S.L. , Sidonio, R.F. , Stein, C.M. & Ho, R.H. The impact of age and CYP2C9 and VKORC1 variants on stable warfarin dose in the pediatric population. Br. J. Haematol. 165, 832–835 (2014). [DOI] [PMC free article] [PubMed] [Google Scholar]
- 18. Hawcutt, D.B. et al Pharmacogenetics of warfarin in a paediatric population: time in therapeutic range, initial and stable dosing and adverse effects. Pharmacogenomics J. 14, 542–548 (2014). [DOI] [PMC free article] [PubMed] [Google Scholar]
- 19. Maagdenberg, H. et al The pediatric acenocoumarol dosing algorithm: the Children Anticoagulation and Pharmacogenetics Study. J. Thromb. Haemost. 16, 1732–1742 (2018). [DOI] [PubMed] [Google Scholar]
- 20. Johnson, J.A. et al Clinical Pharmacogenetics Implementation Consortium. Clinical Pharmacogenetics Implementation Consortium Guidelines for CYP2C9 and VKORC1 genotypes and warfarin dosing. Clin. Pharmacol. Ther. 90, 625–629 (2011). [DOI] [PMC free article] [PubMed] [Google Scholar]
- 21. Bourgeois, S. et al A multi‐factorial analysis of response to warfarin in a UK prospective cohort. Genome Med. 8, 2 (2016). [DOI] [PMC free article] [PubMed] [Google Scholar]
- 22. Nowak‐Göttl, U. et al In pediatric patients, age has more impact on dosing of vitamin K antagonists than VKORC1 or CYP2C9 genotypes. Blood 116, 6101–6105 (2010). [DOI] [PubMed] [Google Scholar]
- 23. Rychik, J. et al The precarious state of the liver after a Fontan operation: Summary of a multidisciplinary symposium. Pediatr. Cardiol. 33, 1001–1012 (2012). [DOI] [PMC free article] [PubMed] [Google Scholar]
- 24. Koukouritaki, S.B. et al Developmental expression of human hepatic CYP2C9 and CYP2C19. J. Pharmacol. Exp. Ther. 308, 965–974 (2004). [DOI] [PubMed] [Google Scholar]
- 25. Kato, Y. et al Effect of VKORC1 genotype on the warfarin dose requirements in Japanese pediatric patients. J. Metab. Pharmacokin. 26, 295–299 (2011). [DOI] [PubMed] [Google Scholar]
- 26. Baker, A.K. , Gaedigk, R. , Leeder, J.S. Ontogeny and genetic variation of VKORC1, CYP2C9 and CYP4F2 in pediatric liver. Pediatric Academic Societies and Asian Society for Pediatric Research Joint Meeting 2014; Vancouver, BC Publication 2180.3.
- 27. Andrew, M. , Vegh, P. , Johnston, M. , Bowker, J. , Ofosu, F. & Mitchell, L. Maturation of the hemostatic system during childhood. Blood 80, 1998–2005 (1992). [PubMed] [Google Scholar]
- 28. Brown, J.T. , Abdel‐Rahman, S.M. , van Haandel, L. , Gaedigk, A. , Lin, Y.S. & Leeder, J.S. Single dose, CYP2D6 genotype‐stratified pharmacokinetic study of atomoxetine in children with ADHD. Clin. Pharmacol. Ther. 99, 642–650 (2016). [DOI] [PMC free article] [PubMed] [Google Scholar]
- 29. de Leon, J. Translating pharmacogenetics to clinical practice: do cytochrome P450 2D6 ultrarapid metabolizers need higher atomoxetine doses? J. Am. Acad. Child Adolesc. Psychiatry 54, 532–534 (2015). [DOI] [PubMed] [Google Scholar]
- 30. Peck, C. The randomized concentration‐controlled clinical trial (CCT): an information‐rich alternative to the randomized placebo controlled clinical trial (PCT). Clin. Pharmacol. Ther. 47, 203–214 (1990). [Google Scholar]
- 31. Sanathanan, L.P. & Peck, C.C. The randomized concentration‐controlled trial: an evaluation of its sample size efficiency. Control. Clin. Trials 12, 780–794 (1991). [DOI] [PubMed] [Google Scholar]
- 32. Kraiczi, H. , Jang, T. , Ludden, T. & Peck, C.C. Randomized concentration‐controlled trials: motivations, use, and limitations. Clin. Pharmacol. Ther. 74, 203–214 (2003). [DOI] [PubMed] [Google Scholar]
- 33. Guidance for Industry ‐ Exposure‐Response Relationships‐Study Design, Data Analysis, and Regulatory Applications. In: U.S. Department of Health and Human Services FaDA, Center for Drug Evaluation and Research, Center for Biologics Evaluation and Research, editor. 2003.
- 34. Darwich, A.S. et al Why has model‐informed precision dosing not yet become common clinical reality? Lessons from the past and a roadmap for the future. Clin. Pharmacol. Ther. 101, 646–656 (2017). [DOI] [PubMed] [Google Scholar]
- 35. Brennan, Z. FDA wants to know what prevents exposure‐response analyses in drug development. <https://www.raps.org/news-and-articles/news-articles/2018/4/fda-wants-to-know-what-prevents-exposure-response> (2018).
- 36. Gaedigk, A. , Simon, S.D. , Pearce, R.E. , Bradford, L.D. , Kennedy, M.J. & Leeder, J.S. The CYP2D6 activity score: translating genotype information into a qualitative measure of phenotype. Clin. Pharmacol. Ther. 83, 234–242 (2008). [DOI] [PubMed] [Google Scholar]
- 37. Wagner, J.B. et al Impact of SLCO1B1 genotype on pediatric simvastatin acid pharmacokinetics. J. Clin. Pharmacol. 58, 823–833 (2018). [DOI] [PubMed] [Google Scholar]
- 38. Pasanen, M.K. , Neuvonen, M. , Neuvonen, P.J. & Niemi, M. SLCO1B1 polymorphism markedly affects the pharmacokinetics of simvastatin acid. Pharmacogenet. Genomics 16, 873–879 (2006). [DOI] [PubMed] [Google Scholar]
- 39. Wagner, J. et al Pharmacokinetics of pravastatin in pediatric dyslipidemia: clinical impact of genetic variation on statin disposition. Cardiology 2016: 19th Annual Update on Pediatric and Congenital Cardiovascular Disease. Orlando, FL: (2016). [Google Scholar]
- 40. Harskamp‐van Ginkel, M.W. et al Drug dosing and pharmacokinetics in children with obesity: a systematic review. JAMA Pediatr. 169, 678–685 (2015). [DOI] [PMC free article] [PubMed] [Google Scholar]
- 41. Rowe, S. , Siegel, D. & Benjamin, D.K. Jr. Best Pharmaceuticals for Children Act ‐ Pediatric Trials Network Administrative core gaps in drug dosing for obese children: A systematic review of commonly prescribed emergency care medications. Clin. Ther. 37, 1924–1932 (2015). [DOI] [PMC free article] [PubMed] [Google Scholar]
- 42. Spivak, H. , Hewitt, M.F. , Onn, A. & Half, E.E. Weight loss and improvement of obesity‐related illness in 500 U.S. patients following laparoscopic adjustable gastric banding procedure. Am. J. Surg. 189, 27–32 (2005). [DOI] [PubMed] [Google Scholar]
- 43. El‐Serag, H.B. , Graham, D.Y. , Satia, J.A. & Rabeneck, L. Obesity is an independent risk factor for GERD symptoms and erosive esophagitis. Am. J. Gastroenterol. 100, 1243–1250 (2005). [DOI] [PubMed] [Google Scholar]
- 44. Koebnick, C. , Getahun, D. , Smith, N. , Porter, A.H. , Der‐Sarkissian, J.K. & Jacobsen, S.J. Extreme childhood obesity is associated with increased risk for gastroesophageal reflux disease in a large population‐based study. Int. J. Pediatr. Obes. 6, e257–e263 (2011). [DOI] [PubMed] [Google Scholar]
- 45. Ward, R.M. & Kearns, G.L. Proton pump inhibitors in pediatrics: mechanism of action, pharmacokinetics, pharmacogenetics, and pharmacodynamics. Paediatr. Drugs 15, 119–131 (2013). [DOI] [PMC free article] [PubMed] [Google Scholar]
- 46. Shakhnovich, V. et al Obese children require lower doses of pantoprazole than non‐obese peers to achieve equal systemic drug exposures. J. Pediatr. 193, 102–108e1 (2018). [DOI] [PMC free article] [PubMed] [Google Scholar]
- 47. Shakhnovich, V. et al Lean body weight dosing avoids excessive systemic exposure to proton pump inhibitors for children with obesity. Pediatr. Obes. 311, 06 (2018). [DOI] [PMC free article] [PubMed] [Google Scholar]
- 48. Singer, K. & Lumeng, C.N. The initiation of metabolic inflammation in childhood obesity. J. Clin. Invest. 127, 65–73 (2017). [DOI] [PMC free article] [PubMed] [Google Scholar]
- 49. Xanthakos, S.A. et al High prevalence of nonalcoholic fatty liver disease in adolescents undergoing bariatric surgery. Gastroenterology 2015;149:623–634. [DOI] [PMC free article] [PubMed] [Google Scholar]
- 50. Li, H. et al Pediatric cytochrome P450 activity alterations in nonalcoholic steatohepatitis. Drug Metab. Dispos. 45, 1317–1325 (2017). [DOI] [PMC free article] [PubMed] [Google Scholar]
- 51. Kwok, C.S. , Yeong, J.K. & Loke, Y.K. Meta‐analysis: risk of fractures with acid‐suppressing medication. Bone 48, 768–776 (2011). [DOI] [PubMed] [Google Scholar]
- 52. Freedberg, D.E. et al Use of proton pump inhibitors is associated with fractures in young adults: a population‐based study. Osteopors. Int. 26, 2501–2507 (2015). [DOI] [PMC free article] [PubMed] [Google Scholar]
- 53. Chung, E.Y. & Yardley, J. Are there risks associated with empiric acid suppression treatment of infants and children suspected of having gastroesophageal reflux disease? Hosp. Pediatr. 3, 16–23 (2013). [DOI] [PubMed] [Google Scholar]
- 54. Froehlich, T.E. , McGough, J.J. & Stein, M.A. Progress and promise of attention‐deficit hyperactivity disorder pharmacogenetics. CNS Drugs 24, 99–117 (2010). [DOI] [PMC free article] [PubMed] [Google Scholar]
- 55. da Silva, T.L. et al Adrenergic alpha2A receptor gene and response to methylphenidate in attention‐deficit/hyperactivity disorder‐predominantly inattentive type. J. Neural. Transm. (Vienna) 115, 341–345 (2008). [DOI] [PubMed] [Google Scholar]
- 56. McCracken, J.T. et al Positive effects of methylphenidate on hyperactivity are moderated by monoaminergic gene variants in children with autism spectrum disorders. Pharmacogenomics J. 14, 295–302 (2014). [DOI] [PMC free article] [PubMed] [Google Scholar]
- 57. Rieder, M.J. et al Effect of VKORC1 haplotypes on transcriptional regulation and warfarin dose. N. Engl. J. Med. 352, 2285–2293 (2005). [DOI] [PubMed] [Google Scholar]