

Abstract
Ceftazidime‐avibactam is a novel β‐lactam/β‐lactamase inhibitor combination for the treatment of serious infections caused by resistant gram‐negative pathogens. Population pharmacokinetic (PopPK) models were built to incorporate pharmacokinetic (PK) data from five phase III trials in patients with complicated intra‐abdominal infection (cIAI), complicated urinary tract infection (cUTI), or nosocomial (including ventilator‐associated) pneumonia. Ceftazidime and avibactam pharmacokinetics were well‐described by two‐compartment disposition models, with creatinine clearance (CrCL) the key covariate determining clearance variability. Steady‐state ceftazidime and avibactam exposure for most patient subgroups differed by ≤ 20% vs. healthy volunteers. Probability of PK/pharmacodynamic (PD) target attainment (free plasma ceftazidime > 8 mg/L and avibactam > 1 mg/L for ≥ 50% of dosing interval) was ≥ 94.9% in simulations for all patient subgroups, including indication and renal function categories. No exposure‐microbiological response relationship was identified because target exposures were achieved in almost all patients. These modeling results support the approved ceftazidime‐avibactam dosage regimens (2000‐500 mg every 8 hours, adjusted for CrCL ≤ 50 mL/min).
Study Highlights.
WHAT IS THE CURRENT KNOWLEDGE ON THE TOPIC?
PopPK models of ceftazidime and avibactam in patients with cIAI and cUTI, which showed that CrCL is the key covariate determining clearance, were used to support dose selection and adjustments for patients with renal impairment in phase III trials.
what question did this study address?
What is the impact of different patient covariates and infections/site of infections, including nosocomial pneumonia, bacteremia, and augmented renal clearance, on ceftazidime and avibactam PK and on the probability of PD target attainment?
WHAT DOES THIS STUDY ADD TO OUR KNOWLEDGE?
PTAs derived from PopPK modeling incorporating data from phase III trials were > 90% across all indications (cIAI, cUTI, including pyelonephritis, and nosocomial pneumonia, including ventilator‐associated pneumonia) and patient subgroups, and supported an MIC breakpoint of 8 mg/L against Enterobacteriaceae and Pseudomonas aeruginosa.
HOW MIGHT THIS CHANGE CLINICAL PHARMACOLOGY OR TRANSLATIONAL SCIENCE?
These analyses demonstrate the value of PopPK models and joint PTA simulations to guide combination drug (e.g., antibiotic and inhibitor) development decisions.
There is an urgent need for new antimicrobial treatments to combat increasing antimicrobial resistance1 among gram‐negative pathogens, such as Enterobacteriaceae and Pseudomonas aeruginosa, which are frequently involved in serious bacterial infections.2, 3, 4 Avibactam is a first‐in‐class novel non‐β‐lactam β‐lactamase inhibitor, which restores the in vitro activity of β‐lactams, including ceftazidime, against Ambler class A, class C, and some class D β‐lactamase‐producing pathogens,5, 6, 7 including those producing Klebsiella pneumoniae carbapenemase and OXA‐48 carbapenemases, but not metallo‐β‐lactamases.8, 9, 10 Ceftazidime‐avibactam is approved in both the United States and Europe for the treatment of adults with complicated intra‐abdominal infection (cIAI; in combination with metronidazole), complicated urinary tract infection (cUTI; including pyelonephritis), hospital‐acquired pneumonia (HAP), and ventilator‐associated pneumonia (VAP).11, 12
Ceftazidime‐avibactam has been extensively studied in phase II13, 14 and III clinical trials in adult patients with cIAI (n = 857) and cUTI (n = 731), including in patients with infections caused by ceftazidime‐nonsusceptible organisms,15, 16, 17, 18 and in a phase III trial in patients with nosocomial pneumonia (NP) including VAP (n = 436).19 These trials each included sparse pharmacokinetic (PK) sampling protocols and these patient PK data were used to develop and update the ceftazidime and avibactam population PK (PopPK) models iteratively during clinical development.20, 21, 22 Early models using data from healthy subjects and phase II studies20 were updated in subsequent iterations with phase III data as these became available.21, 22 Covariate effects were broadly consistent throughout the iterations and the main factors explaining variability in exposure of both ceftazidime and avibactam were patient population (patients vs. healthy subjects) and creatinine clearance (CrCL), a surrogate for renal function.20, 21, 22 Both ceftazidime and avibactam concentration‐time courses were well‐described by a linear two‐compartment PK model. These early models were used in Monte Carlo simulations and probability of target attainment (PTA) analyses to support selection of ceftazidime‐avibactam dosage regimens in phase III trials, including in patients with various levels of renal function. The early models also supported the initial 2015 US Food and Drug Administration approval of ceftazidime‐avibactam in cIAI and cUTI, including pyelonephritis, thereby enabling an expedited approval pathway, which has subsequently been recognized by the European regulatory authorities.23, 24
The PopPK analyses described here, which incorporate data from the ceftazidime‐avibactam phase III trials across all indications, evaluate the actual performance of the ceftazidime‐avibactam dosage regimen used in these trials by (i) determining the impact of patient characteristics of potential clinical interest on ceftazidime and avibactam PK and (ii) evaluating PTA against a range of pharmacodynamic (PD) targets in patients with cIAI, cUTI, and NP, including VAP, and in different clinical scenarios, including various levels of renal function.
Methods
Analysis data and model construction
PopPK data sets were assembled for ceftazidime and avibactam using data from four phase III cIAI or cUTI trials (RECLAIM 1 and 2 (analyzed as a single trial with one database),15 and RECLAIM 3,15, 16 RECAPTURE 1 and 2 (analyzed as a single trial with one database),17 and REPRISE18), one phase III NP trial (REPROVE), two phase II trials (cIAI13 and cUTI14), and 11 phase I trials. All trials were conducted in accordance with the Helsinki Declaration of 1975 (as revised in 1983) and approved by local/institutional ethics committees.
The data sets included healthy volunteers and patients, and the PopPK modeling utilized individual baseline covariate information, chronological records of serum creatinine (for CrCL calculations), and the full dosing and plasma sampling history. The range of estimated CrCL (Cockcroft‐Gault equation) in the ceftazidime data set was 8–488 mL/min. The avibactam data set included subjects with normal renal function to end‐stage renal disease (ESRD), as well as subjects with sepsis and augmented renal clearance (ARC; defined as measured CrCL ≥ 140 mL/min (8‐hour urine collection) and specific to study CXL‐PK‐04 (Table S1)); the estimated CrCL range was 11–610 mL/min.
Ceftazidime‐avibactam plasma concentration‐time data were analyzed using nonlinear mixed effects modeling, which in earlier PopPK analyses described the PK of both ceftazidime and avibactam as a two‐compartment disposition model with first‐order elimination from a central compartment following i.v. infusion, parameterized by clearance (CL), volume of the central compartment (V c), intercompartmental clearance (Q), and volume of the peripheral compartment (V p).22 The first‐order conditional estimation with interaction (FOCE‐INTER) method in nonlinear mixed‐effects modeling (NONMEM) version 7.2 (Hanover, MD) was used for model building (Data S1). The previous models (including covariates) were run with the updated data set, including patients from REPROVE, and the population effect for patients with NP on V c and CL was added. Outliers (conditional weighted residual error > 4) were excluded prior to covariate model building. As the ceftazidime data set lacked data for subjects with severe renal impairment, it was necessary to incorporate individual estimates of ceftazidime CL from patients with renal insufficiency reported in the literature into the base model (Data S2).
After covariate model building completion, which included assessment of additional covariates and refinement of previous covariate effects, different structures of the variance covariance matrix of random effects were evaluated. The final PopPK models were then rerun with and without outliers. Abnormally high ceftazidime concentrations (> 750 mg/mL) were excluded from the final model. To further improve prediction of the observed data at the 10th percentile, the final models were re‐estimated with the Stochastic Approximation Expectation Maximization method with Importance Sampling.
Selection of covariates
Covariate selection was performed using a forward‐addition process followed by backward deletion (i.e., stepwise covariate model). Covariates tested included: disease status/indication (e.g., NP, VAP, or cIAI), ARC (specific to study CXL‐PK‐04 (Table S1), with subjects in other studies classified as non‐ARC), markers of systemic disturbances (e.g., white blood cell (WBC) count ≤ 12,000/μL, presence of fever, systemic inflammatory response syndrome or bacteremia, Acute Physiology and Chronic Health Evaluation version II (APACHE II > 10), sex, age, obesity status and body weight, race, CrCL/ESRD, dialysis, study phase, geographic region, and NP with ventilation (NPv) on the day of PK sampling (recorded as the presence of a ventilator in the hospital room, which includes patients with VAP or HAP who were ventilated on the day of PK sampling). The APACHE II score is an integrated measure of disease severity for intensive care patients, with higher scores signifying greater disease severity. Predicted mortality rises steeply for scores > 10 (> 10% mortality), and this represents a reasonable cutoff for defining more severely ill patients.25 The effect on avibactam PK of concomitant administration of organic anion transporter 1 (OAT1) and OAT3 inhibitors (probenecid, cimetidine, and diclofenac) was also evaluated, given that avibactam is a substrate for these transporters in vitro.26
Covariate effects with significance levels of P = 0.01 during forward inclusion were carried forward for backward elimination testing with an acceptance criterion of P = 0.001. All covariates identified as being statistically significant during model building were subjected to clinical relevance criteria. Categorical covariates that resulted in < 20% change relative to reference in the associated parameter, and continuous covariates that did not result in a ≥ 20% difference in the associated parameter at the 5th and/or 95th percentiles of the covariate relative to the covariate median, were generally deemed clinically irrelevant and dropped from the final model. Exceptions were made for covariates of particular clinical interest with < 20% impact, or where the effect size was close to 20%.
Model evaluation
Standard diagnostic plots were used throughout model development to assess the ability of each model to describe the observed data, including observed vs. individual predicted and population predicted concentrations, and weighted residuals (WRES)/conditional WRES/individual WRES vs. population predicted or time.
Bootstrap resampling techniques were used to evaluate the stability of the final model and to estimate nonparametric confidence intervals (CIs) for the model parameters. The same set of subjects as in the analysis data set was used to generate 200 bootstrapped data sets. The median and 90% CIs of the PK parameter estimates fitted to these 200 resampled data sets were compared with the original PK estimates from the final model.
Visual predictive checks (VPCs) were used to evaluate the predictive performance of the final model. A prediction‐corrected VPC was performed using the VPC algorithm in Perl‐speaks‐NONMEM version 3.7.6. A total of 1000 replicates (i.e., data sets) were simulated using the final models. Within each simulated replication, the 10th, 50th, and 90th percentiles of the simulated concentrations were computed by the nominal sampling time. By taking the 10th and 90th percentiles of the within‐replicate statistic values, a 90% CI for each statistic was derived. Model performance was assessed based on the perceived congruence between the model‐derived CIs and the observed data.
PK parameter calculations and simulations in phase III patients
Empirical Bayes estimates of individual PK parameters for all phase III subjects were used to derive secondary parameters (e.g., maximum plasma concentration at steady state (C max,ss) and area under the plasma concentration‐time curve at steady‐state (AUCss,0–24)). The C max,ss and AUCss,0–24 for ceftazidime and avibactam were calculated for subgroups of clinical interest to verify acceptable exposure. Concentration‐time courses of ceftazidime and avibactam were simulated for phase III patients with ≥ 1 PK sample in the final PopPK data sets using observed CrCL taken closest to the PK sampling day (day 3). These were used to calculate individual PK/PD target attainment in phase III subjects, as described below.
PK/PD targets
A joint PK/PD target for ceftazidime and avibactam was used to assess the suitability of the phase III dosage regimens. The joint target was defined as simultaneous achievement of 50% time (during each dosing interval) free plasma concentrations exceed ceftazidime‐avibactam minimal inhibitory concentration (MIC) of 8 mg/L for ceftazidime (50% fT > 8 mg/L), and 50% fT above a threshold concentration (C T) of 1 mg/L for avibactam (50% fT > 1 mg/L).27 The 50% fT > MIC is an established PK/PD target for ceftazidime and other cephalosporins;28, 29, 30, 31 a target of 8 mg/L was chosen based on global surveillance studies in which a ceftazidime‐avibactam MIC of ≤ 8 mg/L was observed to include ≥ 90% of clinical isolates of Enterobacteriaceae and P. aeruginosa.32, 33, 34, 35, 36 For avibactam, the PK/PD index was derived from hollow fiber and murine models of infection and determined as %fT > C T.37, 38, 39 In hollow fiber experiments using various strains of ceftazidime‐resistant Enterobacteriaceae with fixed concentrations of ceftazidime and varying concentrations of avibactam, C T values of 0.15–0.28 mg/L were sufficient to restore ceftazidime activity; when the concentration of avibactam was fixed in the presence of varying concentrations of ceftazidime, a C T ≤ 0.5 mg/L restored the activity of ceftazidime.37 In neutropenic mouse thigh and lung infection models using various strains of ceftazidime‐resistant P. aeruginosa, %fT > 1 mg/L values of ~16–24% were associated with stasis, and values of ~20–55% were associated with 2log10 reductions in bacterial density.38 Accordingly, the avibactam target C T value for both Enterobacteriaceae and P. aeruginosa was set to 1 mg/L.27
The joint PK/PD target was applied to the predicted PK profiles in phase III patients to determine individual target attainment, and was also used in PTA simulations. There was no relationship between C T and MIC for any of the bacterial strains tested.37, 38, 39 However, to further explore the performance of the phase III ceftazidime‐avibactam dosage regimens, a sensitivity analysis of more conservative joint PK/PD targets was also evaluated in PTA simulations.
Exposure‐response analysis
PK target attainment analyses used free plasma concentrations (taken to be 85% and 92% of total plasma concentrations for ceftazidime and avibactam, respectively). To explore exposure‐response relationships by indication, estimates of %fT > MIC ceftazidime, %fT > MIC ceftazidime‐avibactam, and %fT > C T for avibactam, were calculated from simulated ceftazidime and avibactam profiles. The %fT > MIC (2, 4, and 8 mg/L) for ceftazidime and %fT > C T (0.5, 1, 2, and 4 mg/L) for avibactam were also estimated to explore fully target attainment for the approved doses using a range of targets beyond those determined from nonclinical studies. Logistic regression of overall microbiological response as a function of each exposure metric was conducted for patients with both baseline MIC data and ceftazidime and avibactam exposure metrics. In addition to the above dichotomous targets, a continuous end point, defined as %fT > MIC COR, was also evaluated for its potential utility in predicting clinical outcome. MIC COR is an avibactam‐corrected ceftazidime MIC calculated as a function of the avibactam concentration and the MIC of ceftazidime against a pathogen evaluated in the presence and absence of 4 mg/L avibactam, and fluctuates over time in conjunction with avibactam exposure.
Exposure and PTA simulations
PTA simulations were based on the final PK models for ceftazidime and avibactam developed using pooled data from the phase III RECLAIM, REPRISE, RECAPTURE, and REPROVE trials. To account for the correlation between ceftazidime and avibactam random effects, the random effects were bootstrapped using the approaches detailed in the supplement. To avoid any bias in PTA caused by shrinkage toward the median of post hoc parameters and ensure the results were conservative, the random effects were inflated by a factor inversely proportional to the estimated shrinkage.
PTA simulations were conducted for 5000 simulated patients for each indication and renal function group. Covariate records for 5000 simulated patients were obtained by sampling with replacement from phase III patients in each population that had normal renal function on the PK day (i.e., CrCL > 80 mL/min). Simulations incorporated covariate distributions appropriate to each patient population and between‐patient variability, but excluded residual error and uncertainty in the population parameters. For cIAI, simulations were performed for all patients, Chinese, non‐Chinese, and non‐Japanese Asians patients. For NP, simulations were for all patients with NP, only patients with VAP, only non‐VAP patients, and only NPv patients. Simulations were also performed for cUTI, NP, including VAP, non‐VAP, and NPv, for Chinese patients and/or non‐Chinese, non‐Japanese Asians. Simulations of patients with renal impairment were for label‐recommended dosage adjustments by category, and CrCL values were assumed to follow a uniform distribution within the designated range for each category.
Results
Analysis populations
An overview of the clinical studies included in the PopPK models is provided in Table S1. The final ceftazidime data set included 9155 observations from 1975 adult subjects: 86 healthy subjects (4.4%), 696 patients with cUTI (35.2%), 781 patients with cIAI (39.5%), and 412 patients with NP (20.9%). The final avibactam data set included 13,735 observations from 2249 subjects: 345 healthy subjects or subjects with renal impairment from phase I studies (15.3%), 705 patients with cUTI (31.3%), 786 patients with cIAI (34.9%), and 413 patients with NP (18.4%). Demographic data are summarized in Tables S2 and S3.
Final PopPK models
The ceftazidime and avibactam PopPK data were well‐described by a two‐compartment disposition model. Parameter estimates from the final models are shown in Tables 1 and 2; equations for the covariate relationships are in Data S3. Parameter estimates from the full analysis data sets differed from the median bootstrap estimates by < 20% except for intercompartmental clearance for ceftazidime, and the parameter estimates from bootstrapping were within the CIs (Tables S4 and S5). Prediction‐corrected VPCs (Figures 1, 2 and S1–S8) demonstrated that the final models reflected the observed data and were suitable for use in simulations. Goodness‐of‐fit plots for ceftazidime and avibactam (Figures S9 and S10) showed that the models exhibited minimal bias.
Table 1.
Parameter estimates for the final ceftazidime PopPK model
| Parameter (units) | Estimate | %RSE | BSV (CV%) |
|---|---|---|---|
| Slope 1: CrCL < 100 mL/min, slope1*CrCL | 0.0103036 | 0.409 | NA |
| Slope 2: CrCL ≥ 100 mL/min, slope1*100 + slope2*(CrCL–100) | 0.001252 | 8.84 | NA |
| θ1: CL (L/h) | 6.95 | 1.7 | 42.3 |
| θ2: V c (L) | 10.5 | 13.1 | 105 |
| θ3: Q (L/h) | 31.5 | 18.8 | 259 |
| θ4: V p (L) | 7.57 | 9 | 110 |
| θ5: Population effect on CL (cIAI) | 1.16 | 2.2 | NA |
| θ6: Population effect on CL (NP) | 0.999 | 2.4 | NA |
| θ7: Race effect on CL (ASN) | −0.161 | 11.8 | NA |
| θ8: Race effect on CL | −0.0855 | 27 | NA |
| θ9: Population effect on V c (cUTI) | 1.03 | 11.1 | NA |
| θ10: Population effect on V c (cIAI or NP) | 1.14 | 9.9 | NA |
| θ11: Population effect on V c (cUTI/acute pyelonephritis) | −0.185 | 41.2 | NA |
| θ12: Race effect on V c (ASN, CHN, JPN) | −0.27 | 18.6 | NA |
| θ13: WT effect on V c | 1.01 | 12.6 | NA |
| θ14: Population effect on V c (NPv) | 0.297 | 45.4 | NA |
| Shrinkage (%) or correlationa | |||
| ηCL2 | 0.179 | 3.3 | 11.4 |
| ηVc 2 | 1.10 | 10.2 | 31.2 |
| ηV c–ηCL covarianceb | −0.189 | 15.2 | r = −0.42 |
| ηV p 2 | 1.21 | 8.8 | 17.5 |
| ηV p–ηCL covarianceb | 0.383 | 5.1 | r = 0.82 |
| ηV p–ηV c covarianceb | −0.972 | 7.3 | r = −0.84 |
| ηQ2 | 6.70 | 15.5 | 27.46 |
| ηQ–ηCL covarianceb | 0.883 | 10.1 | r = 0.81 |
| ηQ–ηV c covarianceb | −0.643 | 43.1 | r = −0.24 |
| ηQ–ηV p covarianceb | 1.73 | 14.5 | r = 0.61 |
| Residual noise | |||
| Proportional error, phase Ib | 0.04 | 0.5 | 2.9 |
| Additive error, phase Ib | 26489 | 7.5 | 2.9 |
| Proportional error, phase II and phase IIIb | 0.114 | 2.1 | 9.5 |
| Additive error, phase II and phase IIIb | 18.4 | 447 | 9.5 |
ASN, non‐Japanese, non‐Chinese Asian; BSV, between‐subject variability; CHN, Chinese; cIAI, complicated intra‐abdominal infection; CL, clearance; CrCL, creatinine clearance; cUTI, complicated urinary tract infection; CV%, coefficient of variation; JPN, Japanese; η, individual random subject effect; NA, not assessed; NP, nosocomial pneumonia; NPv, NP with the presence of a ventilator in the hospital room on the day of PK sampling, which includes ventilator‐associated pneumonia and hospital‐acquired pneumonia in patients who were receiving ventilation on the day of sampling; θ, typical value of PK parameter; PK, pharmacokinetic; Q, intercompartmental clearance; %RSE, % relative standard error; V c, volume of the central compartment; V p, volume of the peripheral compartment; WT, body weight.
Correlation coefficient (r) between random effects.
Reported as variance.
Table 2.
Parameter estimates for the final avibactam PopPK model
| Parameter (units) | Estimate | %RSE | BSV (CV%) |
|---|---|---|---|
| θ1: CL (L/h) | 10.2 | 1.8 | 59.1 |
| θ2: V c (L) | 11.1 | 9.9 | 107.1 |
| θ3: Q (L/h) | 5.44 | 13.9 | 122.2 |
| θ4: V p (L) | 6.91 | 6.5 | 252.2 |
| θ5: CL estimate for patients with ESRD | 0.0678 | 8.3 | NA |
| θ6: CL estimate for patients on dialysis | 20.8 | 9.6 | NA |
| θ7: Power CrCL (< 80) on CL | 1.05 | 2.4 | NA |
| θ8: Linear CrCL (≥ 80) on CL | 0.00279 | 3.7 | NA |
| θ9: Population effect on V c (cIAI, phase II), V c*(1 + θ9) | 1.92 | 25.4 | NA |
| θ10: Population effect on CL (cIAI, phase II), CL*(1 + θ10) | 0.406 | 23.2 | NA |
| θ11: Population effect on V c (cUTI), V c*(1 + θ11) | 0.434 | 24 | NA |
| θ12: Population effect on V c (cIAI, phase III, NP), V c*(1 + θ11) | 0.329 | 28.6 | NA |
| θ13: Scaling factor for CrCL in subjects with ARC, CL = TVCL*(1 + θ8*θ13* [CrCL–80]) | 0.992 | 17.4 | NA |
| θ14: WT on V c (WT/70.0)θ14 | 1.08 | 7.8 | NA |
| θ15: APACHE II on CL, CL*(1 + θ15) | −0.197 | 8.7 | NA |
| θ 22: ASN on CL, CL*(1 + θ22) | −0.0865 | 20.2 | NA |
| θ 28: NPv on V c,V c*(1 + θ28) | 0.175 | 53.3 | NA |
| Shrinkage (%)a | |||
| ηCL2 | 0.349 | 2 | 7.29 |
| ηV c 2 | 1.147 | 6 | 28.15 |
| ηV c–ηCLb | 0.125 | 15.6 | r = 0.2 |
| ηV p 2 | 1.494 | 7 | 13.52 |
| ηV p–ηCLb | 0.611 | 3.6 | r = 0.85 |
| ηV p–ηV c b | −0.426 | 18 | r = −0.33 |
| ηQ2 | 6.359 | 8.1 | 14.18 |
| ηQ–ηCLb | 1.231 | 4.1 | r = 0.83 |
| ηQ–ηV c b | −0.978 | 16.8 | r = −0.36 |
| ηQ–ηV p b | 3.059 | 7.1 | r = 0.99 |
| Residual noise | |||
| θ17: Proportional error, phase I | 0.173 | 0.1 | NA |
| θ18: Additive variability, phase I | 44.6 | 0.5 | NA |
| θ19: Proportional variability, phase II | 0.492 | 3 | NA |
| θ 20: Proportional variability, phase III | 0.363 | 1.1 | NA |
APACHE II, Acute Physiology and Chronic Health Evaluation II; ARC, augmented renal clearance; ASN, non‐Japanese, non‐Chinese Asian; BSV, between‐subject variability; cIAI, complicated intra‐abdominal infection; CL, clearance; CrCL, creatinine clearance; cUTI, complicated urinary tract infection; CV%, coefficient of variation; ESRD, end‐stage renal disease; η, individual random subject effect; NA, not assessed; NP, nosocomial pneumonia; NPv, NP with the presence of a ventilator in the hospital room on the day of PK sampling, which includes ventilator‐associated pneumonia and hospital‐acquired pneumonia in patients who were receiving ventilation on the day of sampling; θ, typical value of PK parameter; PK, pharmacokinetic; Q, intercompartmental clearance; %RSE, % relative standard error; TVCL, typical value of CL; V c, volume of the central compartment; V p, volume of the peripheral compartment; WT, body weight.
Correlation coefficient (r) between random effects.
Reported as variance.
Figure 1.
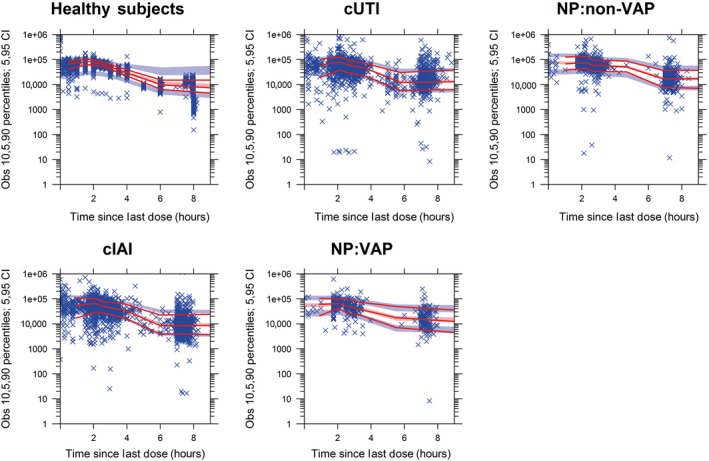
Prediction‐corrected visual predictive check stratified by population for ceftazidime. Solid lines represent medians and 10th and 90th percentiles of observed data. Shaded regions encompass 90% of the simulated (n = 1,000) values of the predicted medians (red) and 10th and 90th percentiles (blue). Data points represent the observed data (ng/mL). CI, confidence interval; cIAI, complicated intra‐abdominal infection; cUTI, complicated urinary tract infection; non‐VAP, not ventilator‐associated pneumonia; NP, nosocomial pneumonia; Obs, observations; VAP, ventilator‐associated pneumonia.
Figure 2.

Prediction‐corrected visual predictive check stratified by population for avibactam. Solid lines represent the median of the observed data. Shaded regions encompass 90% of the simulated (n = 5,000) values of the predicted medians, 5th, and 95th percentiles. Data points represent the observed data (ng/mL). AVI, avibactam; cIAI, complicated intra‐abdominal infection; cUTI, complicated urinary tract infection; non‐VAP, not ventilator‐associated pneumonia; NP, nosocomial pneumonia; VAP, ventilator‐associated pneumonia.
Ceftazidime
CrCL was the key covariate predicting ceftazidime CL (Table 1). The relationship was close to proportional at CrCL < 100 mL/min; for CrCL ≥ 100 mL/min the regression slope of ceftazidime CL vs. CrCL was very shallow (12.5% increase in CL per 100 mL/min increase in CrCL above 100 mL/min). No other covariate effects on CL in phase III patients exceeded the predefined threshold for clinical relevance (± 20%). Noteworthy small covariate effects on ceftazidime CL that were retained in the final model (as exceptions to the general rule) were indication (16% higher CL for patients with cIAI vs. healthy subjects and patients with cUTI) and racial/regional origin (Chinese patients had 9% lower CL and non‐Chinese, non‐Japanese Asians had 16% lower CL than non‐Asians).
The covariate effects on ceftazidime V c that were included in the final model were: indication/indication subgroups, Asian race, body weight, pyelonephritis, and NPv (Table 1). Estimated effects exceeding ± 20% were: 27% lower V c for Asian compared with non‐Asian patients; 29.7% higher V c for patients with NPv than for non‐NPv patients; 24% lower and 26% higher V c for patients with body weight at the 10th percentile (50 kg) and 90th percentile (94 kg), respectively, compared with those of median weight (70 kg).
All fixed‐effect parameters were estimated with good precision, with all relative standard errors (RSEs) < 27% except for the effect of acute pyelonephritis on V c (41.2%) and the effect of NPv on V c (45.4%). Interindividual random effects with a correlation parameter estimated among CL, V c, V p, and Q were also well estimated, with %RSEs generally < 16%.
Avibactam
CrCL was the key covariate predicting the CL of avibactam (Table 2). For patients with CrCL < 80 mL/min, CL dependence on CrCL was estimated as a power function of 1.05 indicating an approximately linear relationship. For patients with CrCL ≥ 80 mL/min, the relationship between CL and CrCL was modeled as a shallow linear function such that avibactam CL increased by 27.9% for an increase of 100 mL/min in CrCL over 80 mL/min. For patients with ESRD, CL was 0.0678 L/h off dialysis and 20.8 L/h on‐dialysis. The largest covariate effect on CL in phase III patients aside from renal function was a 19.7% decrease for APACHE II score > 10. Also noteworthy was an estimated 8.65% lower CL (translating to a 9.5% increase in AUC) for non‐Chinese, non‐Japanese Asians compared with that for patients of other racial origins and this covariate was also retained in the final model.
The covariate effects on avibactam V c that were retained in the final model and relevant to phase III subjects were body weight, indication, and NPv status (Table 2). Subjects at the 10th (51 kg) or 90th percentile of body weight (95 kg) had estimated V c, respectively, 29% lower or 39% higher than the median weight (70 kg). The V c was 32.9% and 43.4% higher for phase III patients with cIAI and patients with NP and patients with cUTI, respectively, compared with healthy subjects. Patients with NPv had estimated V c 17.5% higher than non‐NPv patients. All fixed effect parameters were estimated with good precision, with %RSEs generally < 29%, except for the NPv effect on V c (53.3%). Inter‐individual random effects, with correlation parameters estimated among CL, V c, V p, and Q were also well estimated, with all %RSEs < 18%. Correlation between some of the random effect parameters was high (−0.36 < r 2 < 0.99).
Exploratory exposure‐response analysis
The exposure‐response analyses included 359 patients with cIAI, 420 patients with cUTI, and 124 patients with NP who had one or more aerobic gram‐negative pathogen isolated at baseline. Almost all individual ceftazidime %fT > MIC ceftazidime‐avibactam and avibactam %fT > C T values were close to 100%. The low treatment failure rates in the phase III trials limited investigation of clinical PK/PD relationships, and no meaningful exposure‐response relationships were observed. Higher avibactam C T targets and C T targets corrected for MIC in the presence and absence of avibactam were investigated as an exploratory analysis; again, there were no meaningful exposure‐response relationships noted. Unfavorable overall microbiological response was relatively infrequent among patients with cIAI and patients with cUTI (5.8% and 15.5%, respectively) but more prevalent among patients with NP (38.7%).
Individual predicted exposures and joint PK/PD target attainment in phase III patients
Ceftazidime exposures were similar in patients with cUTI and patients with NP, and lower in patients with cIAI (up to 23.0% lower AUCss,0–24; Table 3). Avibactam exposures were similar in patients with cUTI and patients with cIAI and higher in patients with NP (up to 28.0% higher AUCss,0–24). Patients with VAP had ~20% lower AUCss,0–24 and C max,ss for both ceftazidime and avibactam than non‐VAP patients, reflecting their higher V c and CrCL. Actual joint PK/PD target attainment rates (50% fT > 8 mg/L for ceftazidime and 50% fT > 1 mg/L for avibactam) were > 97% for cIAI, cUTI, and NP, including VAP and non‐VAP subgroups (Table 3). Joint target attainment rates were > 93% across all other evaluated subgroups, except for the 8–15 mL/min renal function group (n = 4), which was too small for meaningful comparison (Table 3). Exposure and joint target attainment rates were comparable among patients with and without baseline bacteremia, APACHE II score > 10, systemic inflammatory response syndrome (SIRS) at baseline, fever at baseline, or concomitant use of OAT1/OAT3 inhibitor(s), with Cmax,ss and AUCss,0–24 differing by ≤25%. Age‐related or obesity‐related changes in exposure seemed to be adequately captured by changes in CrCL. For high CrCL, AUCss,0–24 decreased, however, joint target attainment remained >95% in the 150–180 mL/min and 180–395 mL/min subgroups, reflecting the relatively small increases in ceftazidime and avibactam CL at higher CrCL. Japanese patients had higher ceftazidime and avibactam exposure than the white/other reference population and achieved 100% joint target attainment.
Table 3.
Individual predicted ceftazidime and avibactam steady‐state exposures and joint PK/PD target attainment for subgroups of actual phase III patients with cIAI, cUTI, and NP
| n | Ceftazidime | Avibactam | Joint PK/PD target attainment rate, % (95% CI)a | |||
|---|---|---|---|---|---|---|
| C max,ss geometric mean (CV), mg/L | AUCss,0–24 geometric mean (CV), m·h/L | C max,ss geometric mean (CV), mg/L | AUCss,0–24 geometric mean (CV), m·h/L | |||
| Patient population | ||||||
| cUTI | 648 | 77.9 (114.2) | 979 (119.7) | 12.1 (161.9) | 138 (164.1) | 98.5 (97.5, 99.4) |
| cIAI | 703 | 66.9 (105.0) | 749 (114.0) | 12.8 (155.3) | 132 (152.0) | 98.6 (97.7, 99.5) |
| NP | 413 | 72.9 (125.2) | 950 (131.0) | 14.2 (166.1) | 169 (168.5) | 99.0 (98.1, 100.0) |
| Non‐VAP | 275 | 79.0 (120.0) | 1016 (122.0) | 15.5 (166.9) | 183 (168.7) | 99.6 (98.9, 100.0) |
| VAP | 138 | 61.9 (127.0) | 830 (142.7) | 12 (157.6) | 146 (163.0) | 97.8 (95.4, 100.0) |
| Bacteremia at baseline | ||||||
| No | 1465 | 71.9 (116.1) | 881 (125.5) | 12.6 (157.3) | 141 (161.2) | 98.6 (98.0, 99.2) |
| Yes | 88 | 73.6 (102.8) | 919 (120.1) | 14.2 (164.1) | 161 (161.3) | 100.0 (NA) |
| Baseline APACHE II score | ||||||
| ≤ 10 | 677 | 67.0 (105.0) | 748 (113.8) | 12.7 (154.3) | 131 (150.6) | 98.5 (97.6, 99.4) |
| > 10 | 438 | 72.3 (124.3) | 938 (130.9) | 14.3 (167.0) | 170 (168.7) | 99.1 (98.2, 100.0) |
| Missingb | 649 | 77.9 (114.1) | 979 (119.7) | 12.1 (161.8) | 138 (164.0) | 98.5 (97.5, 99.4) |
| SIRS at baseline | ||||||
| No | 770 | 72.3 (108.9) | 895 (120.5) | 12.8 (159.2) | 143 (162.0) | 99.1 (98.4, 99.8) |
| Yes | 773 | 71.5 (121.3) | 869 (129.7) | 12.6 (157.1) | 142 (161.3) | 98.3 (97.4, 99.2) |
| Missing | 10 | 83.5 (130.2) | 977 (123.7) | 12.1 (115.1) | 129 (116.4) | 100.0 (NA) |
| Baseline WBC count (cells/μL) | ||||||
| ≤ 12,000 | 876 | 74.6 (110.9) | 923 (118.9) | 12.8 (159.1) | 145 (161.7) | 98.9 (98.2, 99.6) |
| > 12,000 | 486 | 67.6 (119.4) | 801 (128.4) | 12.5 (160.4) | 136 (161.5) | 98.6 (97.5, 99.6) |
| Missing | 191 | 72.0 (121.4) | 924 (136.8) | 12.3 (145.3) | 147 (158.6) | 98.4 (96.7, 100.0) |
| Fever at baseline | ||||||
| No | 1166 | 71.9 (113.4) | 888 (123.9) | 12.9 (154.5) | 146 (159.2) | 99.1 (98.5, 99.6) |
| Yes | 343 | 72.1 (121.8) | 859 (130.3) | 12.2 (165.7) | 134 (167.4) | 98.3 (96.9, 99.6) |
| Missing | 44 | 75.1 (117.3) | 929 (118.4) | 11.8 (180.9) | 132 (164.7) | 93.2 (85.7, 100.0) |
| Age (years) | ||||||
| 18–65 | 1192 | 70.0 (113.5) | 800 (122.7) | 12.5 (167.1) | 131 (166.8) | 98.4 (97.7, 99.1) |
| > 65–75 | 284 | 77.1 (109.4) | 997 (107.6) | 13.2 (119.0) | 156 (118.4) | 99.6 (99.0, 100.0) |
| > 75–89 | 288 | 76.8 (120.5) | 1102 (120.6) | 14.0 (169.6) | 180 (164.7) | 98.6 (97.3, 100.0) |
| Concomitant use of OAT1/OAT3 inhibitor(s) | ||||||
| No | 1631 | 71.7 (115.2) | 869 (124.4) | 12.8 (160.5) | 142 (162.3) | 98.6 (98.0, 99.2) |
| Yes | 133 | 78.5 (103.5) | 934 (114.7) | 13.7 (165.4) | 150 (158.5) | 99.2 (97.8, 100.0) |
| Obesity | ||||||
| Normal | 1441 | 73.0 (115.5) | 878 (124.2) | 13.0 (160.2) | 144 (161.4) | 98.7 (98.1, 99.3) |
| Obesity I (29.9 ≤ BMI < 34.9 kg/m2) | 208 | 67.9 (111.8) | 841 (125.2) | 12.0 (178.4) | 136 (179.1) | 97.6 (95.5, 99.7) |
| Obesity II (34.9 ≤ BMI < 39.9 kg/m2) | 74 | 73.7 (109.6) | 894 (115.2) | 13.2 (139.7) | 141 (140.0) | 100.0 (NA) |
| Obesity III (BMI ≥ 39.9 kg/m2) | 32 | 64.2 (93.6) | 806 (119.4) | 9.7 (116.9) | 115 (128.5) | 100.0 (NA) |
| Missing | 9 | 70.9 (87.0) | 959 (106.5) | 14.2 (83.4) | 172 (112.8) | 100.0 (NA) |
| Race | ||||||
| White/other | 1209 | 68.6 (112.9) | 848 (125.0) | 12 (159.4) | 135 (161.3) | 98.3 (97.6, 99.1) |
| Asian (non‐Chinese; non‐Japanese) | 248 | 82.2 (118.4) | 968 (121.9) | 14.9 (166.5) | 166 (170.8) | 99.6 (98.8, 100.0) |
| Chinese and Taiwanese | 262 | 77.6 (112.5) | 884 (120.5) | 14.7 (154.9) | 151 (155.1) | 98.9 (97.6, 100.0) |
| Japanese | 45 | 90.4 (82.6) | 1021 (94.8) | 16.1 (134.3) | 164 (130.9) | 100.0 (NA) |
| Asian population | ||||||
| China (only) | 251 | 78.4 (111.2) | 892 (119.6) | 14.9 (155.6) | 153 (155.8) | 98.8 (97.5, 100.0) |
| Japan | 45 | 90.4 (82.6) | 1021 (94.8) | 16.1 (134.3) | 164 (130.9) | 100.0 (NA) |
| Korea | 77 | 79.9 (97.2) | 952 (106.5) | 13.0 (135.9) | 144 (138.1) | 98.7 (96.2, 100.0) |
| Taiwan | 12 | 59.4 (130.1) | 728 (130.3) | 10.2 (109.9) | 115 (121.5) | 100.0 (NA) |
| Vietnam | 45 | 78.6 (109.1) | 852 (105.2) | 14.6 (116.5) | 146 (119.9) | 100.0 (NA) |
| Day 3 CrCL, mL/min (simulated ceftazidime‐avibactam treatment regimen)c | ||||||
| 8–15 (750‐187.5 mg q24 h) | 4 | 34.3 (173.3) | 551 (121.9) | 6.3 (305.6) | 86.3 (220.6) | 75.0 (32.6, 100.0) |
| > 15–30 (750‐187.5 mg q12 h) | 20 | 50.4 (139.5) | 789 (116.5) | 10.9 (174.1) | 155 (143.6) | 100.0 (NA) |
| > 30–50 (1000‐250 mg q8 h) | 128 | 58.8 (120.5) | 938 (122.9) | 10.2 (147.6) | 148 (153.3) | 98.4 (96.3, 100.0) |
| > 50–80 (2000‐500 mg q8 h) | 418 | 90.0 (108.0) | 1213 (110.4) | 15.3 (142.9) | 186 (144.5) | 99.0 (98.1, 100.0) |
| > 80–150 (2000‐500 mg q8 h) | 955 | 72.9 (105.9) | 828 (112.4) | 13.2 (165.5) | 138 (163.4) | 99.0 (98.3, 99.6) |
| > 150–180 (2000‐500 mg q8 h) | 123 | 58.5 (93.0) | 652 (112.8) | 9.9 (124.5) | 103 (137.5) | 98.4 (96.1, 100.0) |
| > 180–610 (2000‐500 mg q8 h) | 116 | 51.2 (109.6) | 542 (108.1) | 9.9 (171.6) | 96 (155.9) | 95.7 (92.0, 99.4) |
APACHE II, Acute Physiology and Chronic Health Evaluation II; AUCss,0–24, area under the plasma concentration vs. time curve at steady state; BMI, body mass index; CI, confidence interval; cIAI, complicated intra‐abdominal infections; C max,ss, maximum plasma concentration at steady state; CrCL, creatinine clearance; cUTI, complicated urinary tract infections; Non‐VAP, not ventilator‐associated pneumonia; CV, coefficient of variation; NA, not applicable; NP, nosocomial pneumonia; OAT1/OAT3, organic anion transporter 1/organic anion transporter 3; PD, pharmacodynamic; PK, pharmacokinetic; q8 h, every 8 hours; q12 h, every 12 hours; q24 h, every 24 hours; SIRS, systemic inflammatory response syndrome; VAP, ventilator‐associated pneumonia; WBC, white blood cell.
The joint PK/PD target was defined as 50% fT > 8 mg/L for ceftazidime and 50% fT > 1 mg/L for avibactam.
APACHE II scores were collected for patients with cIAI and NP only, hence, these data were not available for the 648 patients with cUTI; data were missing for 1 patient with cIAI.
Subjects with CrCL < 50 mL/min were assumed to receive the labeled dosage regimen appropriate to their level of renal insufficiency.
Exposure and PTA simulations
For simulated patients with normal renal function (CrCL > 80 mL/min), geometric mean exposure parameters for ceftazidime differed by < 10% in the cIAI, NPv, and VAP populations. Compared with patients with cIAI, ceftazidime geometric mean C max,ss and AUCss,0–24 were 19% and 29% higher for patients with cUTI, respectively, and 24% and 31% higher for non‐VAP patients, respectively (Table 4). Simulated avibactam exposure parameters differed by < 10% across cIAI, cUTI, NPv, and VAP patient populations with normal renal function (Table 4). Non‐VAP patients had higher avibactam exposures, with geometric mean C max,ss and AUCss,0–24 28% and 36% higher, respectively, than patients with cIAI (Table 4). For patients with NP overall, avibactam C max,ss and AUCss,0–24 were 11% and 21% higher, respectively, than for patients with cIAI, reflecting the contribution of the non‐VAP subset.
Table 4.
Steady‐state exposure for ceftazidime and avibactam and probability of joint PK/PD target attainment in simulated patients by indication and renal function category
| Renal function category (CrCL); ceftazidime‐avibactam dosing regimena | Patient population | Ceftazidime | Avibactam | Joint PTA, %a | ||
|---|---|---|---|---|---|---|
| C max,ss geometric mean (CV), mg/L | AUCss,0–24 geometric mean (CV), m·h/L | C max,ss geometric mean (CV), mg/L | AUCss,0–24 geometric mean (CV), m·h/L | |||
| Normal (> 80 mL/min); 2000‐500 mg q8 h | cIAI | 61.1 (44) | 683 (45) | 11.5 (83) | 121 (72) | 94.9 |
| cUTI | 73 (47) | 880 (49) | 11.2 (87) | 126 (82) | 95.2 | |
| NP | 65.4 (53) | 805 (55) | 12.8 (94) | 147 (89) | 98.3 | |
| NPv | 56.8 (51) | 723 (56) | 11.2 (82) | 131 (75) | 97.2 | |
| VAP | 55.1 (59) | 719 (64) | 10.7 (85) | 129 (79) | 96.1 | |
| Non‐VAP | 75.7 (43) | 894 (48) | 14.7 (92) | 164 (93) | 100.0 | |
| Mild impairment (51 to < 80 mL/min); 2000‐500 mg q8 h | cIAI | 79.6 (44) | 1080 (45) | 14.3 (84) | 172 (71) | 99.0 |
| cUTI | 94.5 (48) | 1330 (49) | 13.6 (88) | 172 (82) | 98.7 | |
| NP | 86 (53) | 1260 (55) | 16 (95) | 211 (87) | 98.9 | |
| NPv | 76 (52) | 1160 (56) | 14.2 (82) | 193 (73) | 98.4 | |
| VAP | 74.8 (60) | 1160 (62) | 13.9 (88) | 193 (78) | 97.6 | |
| Non‐VAP | 97.1 (44) | 1370 (48) | 17.7 (93) | 226 (92) | 100.0 | |
| Moderate impairment (31 to < 50 mL/min); 1000‐250 mg q8 h | cIAI | 54.2 (45) | 871 (45) | 9.82 (86) | 143 (72) | 99.3 |
| cUTI | 65.5 (49) | 1070 (49) | 9.49 (90) | 142 (83) | 99.1 | |
| NP | 59.7 (54) | 1020 (55) | 11.1 (97) | 175 (88) | 98.8 | |
| NPv | 53.4 (54) | 940 (56) | 9.97 (84) | 161 (74) | 98.3 | |
| VAP | 52.8 (62) | 941 (62) | 9.77 (90) | 160 (78) | 97.7 | |
| Non‐VAP | 66.7 (45) | 1110 (48) | 12.3 (96) | 189 (92) | 100.0 | |
| Severe 1 impairment (16 to < 30 mL/min); 750‐187.5 mg q12 h | cIAI | 47.6 (46) | 768 (47) | 8.88 (92) | 130 (73) | 99.0 |
| cUTI | 57.8 (52) | 947 (51) | 8.61 (96) | 129 (84) | 98.6 | |
| NP | 52.3 (56) | 903 (56) | 10 (101) | 159 (88) | 98.8 | |
| NPv | 46.8 (56) | 829 (57) | 8.96 (88) | 146 (75) | 97.9 | |
| VAP | 46.4 (65) | 830 (64) | 8.81 (95) | 145 (79) | 97.3 | |
| Non‐VAP | 58.4 (46) | 982 (50) | 11 (100) | 171 (93) | 100 | |
| Severe 2 impairment (6 to < 15 mL/min); 750‐187.5 mg q24 h | cIAI | 53.7 (49) | 860 (50) | 10.4 (100) | 151 (76) | 99.3 |
| cUTI | 65.5 (56) | 1060 (55) | 10.1 (104) | 150 (89) | 98.8 | |
| NP | 59.1 (59) | 1010 (60) | 11.7 (109) | 186 (92) | 99.2 | |
| NPv | 52.6 (61) | 924 (62) | 10.4 (94) | 169 (79) | 98.7 | |
| VAP | 52.3 (70) | 929 (68) | 10.3 (102) | 170 (84) | 98.0 | |
| Non‐VAP | 65.5 (48) | 1090 (55) | 12.8 (107) | 198 (98) | 100.0 | |
| ESRD; 750‐187.5 mg q48 h | cIAI | 9.7 (105) | 127 (70) | 85 (59) | 1570 (65) | 99.6 |
| cUTI | 9.3 (107) | 127 (80) | 105 (66) | 1940 (70) | 99.5 | |
| NP | 10.7 (113) | 157 (85) | 96.1 (70) | 1860 (74) | 99.5 | |
| NPv | 9.5 (95) | 143 (71) | 87.2 (72) | 1720 (75) | 99.1 | |
| VAP | 9.3 (103) | 143 (76) | 86.2 (81) | 1700 (81) | 98.8 | |
| Non‐VAP | 11.8 (108) | 168 (90) | 106 (60) | 2040 (69) | 100.0 | |
AUCss,0–24, area under the plasma concentration vs. time curve at steady state; cIAI, complicated intra‐abdominal infection; C max,ss, maximum plasma concentration at steady state; CrCL, creatinine clearance; cUTI, complicated urinary tract infection; CV, coefficient of variation; ESRD, end‐stage renal disease; Non‐VAP, not ventilator‐associated pneumonia; NP, nosocomial pneumonia; NPv, NP with ventilator in the hospital room on the day of PK sampling, which includes ventilator‐associated pneumonia and hospital‐acquired pneumonia in patients who were receiving ventilation on the day of sampling; PD, pharmacodynamic; PK, pharmacokinetic; PTA, probability of target attainment; q8 h, every 8 hours; q12 h, every 12 hours; q24 h, every 24 hours; q48 h, every 48 hours; VAP, ventilator‐associated pneumonia.
Labelled dose adjustments for patients with renal insufficiency.
Joint PK/PD target was defined as 50% fT > 8 mg/L for ceftazidime and 50% fT > 1 mg/L for avibactam.
[Correction updated on October 26, 2018, after initial online publication: The headings “Ceftazidime” and “Avibactam” in the top row of Table 4 were transposed.]
Across all indications, patients with mild renal impairment (CrCL 51 to < 80 mL/min) had higher predicted ceftazidime and avibactam exposure parameters than those with normal renal function receiving the same dose (Table 4). Patients with moderate (CrCL 31 to < 50 mL/min) or severe (CrCL 6 to < 30 mL/min) renal impairment receiving the appropriate label dose adjustments had lower predicted ceftazidime and avibactam C max,ss than those with normal renal function, while maintaining slightly higher AUCss,0–24. In dose‐adjusted patients with ESRD, simulated ceftazidime C max,ss and AUCss,0–24 were 139–156% and 220–238%, respectively, higher than in patients with normal renal function; for avibactam, these values were 80–87% and 101–111%, respectively, higher. Simulations for the ESRD population did not account for drug removal through hemodialysis; hence, these high exposures represent a worst‐case scenario. PTA simulations demonstrated that PTA exceeded 94.9% at a ceftazidime‐avibactam MIC of 8 mg/L across all indications and renal function subgroups (Table 4). Joint PTA plotted as a function of ceftazidime‐avibactam MIC in simulated patients with cIAI, cUTI, and NP with normal renal function is shown in Figure 3. Greater than 90% PTA was maintained for more joint stringent targets up to 60% fT >8 mg/L for ceftazidime and 60% fT > 1 mg/L for avibactam (data not shown).
Figure 3.

Simulated joint probability of target attainment (PTA) as function of ceftazidime‐avibactam minimum inhibitory concentration (MIC) in 5000 simulated patients with complicated intra‐abdominal infection (cIAI), complicated urinary tract infection (cUTI), or nosocomial pneumonia (NP) with normal renal function receiving ceftazidime‐avibactam 2000‐500 mg every 8 hours. Joint target attainment was defined as 50% fT > 8 mg/L for ceftazidime, and 50% fT > 1 mg/L for avibactam.
Discussion
PopPK modeling of antimicrobial therapies and simulations for PTA analysis are recognized techniques for optimizing dosing for efficacy and safety.40, 41 They also play a role in the determination of interpretative criteria (breakpoints), particularly when pathogens isolated in clinical studies have a limited range of MICs.42
These PopPK models for ceftazidime and avibactam described well the PK of both drugs in phase III patients with cIAI, cUTI, and NP. The main factors influencing variability in exposure of both avibactam and ceftazidime, primarily renal function, were well‐characterized. The final models were qualified using VPCs and deemed suitable for use in PTA simulations. Major strengths of the modeling include the inclusion of a high proportion of patient PK data, the inclusion of subjects with renal function varying from ARC to ESRD, and the comprehensive set of covariates examined. Ceftazidime and avibactam are predominately excreted by the kidneys, so understanding the effects of reduced and augmented renal function on exposure is vital. Examining covariates relating to critical illness and septic shock was also important because these can significantly affect the volume of distribution and exposure of many other antimicrobial agents.43, 44, 45, 46
The PopPK models accurately predicted exposure in patients with varying degrees of renal function: CL of both avibactam and ceftazidime was close to proportional at CrCL < 80 mL/min and < 100 mL/min, respectively, and at higher CrCL values, drug CL increased only modestly with increasing CrCL. Comparison of the model‐predicted AUCss,0–24 between phase III patients across all indications with normal renal function and those with mean estimated CrCL > 150 mL/min showed that small reductions in ceftazidime and avibactam exposure in patients with high CrCL had no impact on target attainment rates, which were > 95.7%. These data confirm the final dosing recommendations using exposure and PTA data from all phase III trials,47 and indicate that dose adjustments are only necessary for patients with CrCL < 50 mL/min, in whom clearance of ceftazidime and avibactam is appreciably reduced; dose adjustments are not warranted for patients with ARC.
In phase III patients, individual target attainment at a ceftazidime‐avibactam MIC of 8 mg/L exceeded 97% in all indications, as well as other subgroups of potential clinical significance, including obesity, SIRS, fever, elevated WBCs, concomitant OAT1/OAT3 inhibitors, and bacteremia. This reflects the limited impact of covariates other than CrCL on ceftazidime and avibactam exposure, and demonstrates that the ceftazidime‐avibactam dosage regimen of 2000‐500 mg q8 h for patients with CrCL > 50 mL/min provides appropriate plasma concentration profiles for nearly all patients, including those with severe systemic disturbances, advanced age, high CrCL, and obesity.
In PTA simulations using the updated PopPK models, the proposed ceftazidime‐avibactam regimens, including dose adjustments for renal impairment, provided PTA > 90% in every patient subgroup studied in phase III trials across cUTI, cIAI, and NP (including HAP and VAP) indications. PTA simulations were performed using re‐inflated post hoc PK parameters to account for shrinkage, which is a more conservative approach than generally applied. In addition, calculations were based on a robust joint target, providing a high degree of confidence that both ceftazidime and avibactam will reach required plasma concentrations. A > 90% PTA for the joint PK/PD target of ≥ 50% fT > 8 mg/L for ceftazidime and ≥ 50% fT > C T of 1 mg/L for avibactam supports a ceftazidime‐avibactam MIC breakpoint of 8 mg/L against both Enterobacteriaceae and P. aeruginosa. Of note, the modeling of β‐lactam/β‐lactamase inhibitor combinations is an evolving field with various approaches being adopted by the sponsors of different recently developed combinations and those currently in investigation. Our approach involved defining fixed joint PK/PD targets that were conservative with respect to the exposure levels assumed to be required for clinical efficacy. Other investigators have started to develop mechanistic‐based modeling approaches, including for the ceftazidime‐avibactam combination.48, 49, 50
In conclusion, PopPK models of ceftazidime and avibactam incorporating phase III data from patients with cIAI, cUTI, and NP, found several covariates influence variability in exposure to both agents. However, CrCL was the only covariate with a sufficiently large effect to warrant dose adjustments. These analyses provide confidence that the approved ceftazidime‐avibactam dosage regimens (including adjustments for CrCL ≤ 50 mL/min), provide sufficient exposures for patients with all approved indications and across a range of clinical circumstances considered challenging for other antibiotics, such as bacteremia, SIRS, obesity, ARC, and mechanical ventilation.
Data sharing
Upon request, and subject to certain criteria, conditions and exceptions see (https://www.pfizer.com/science/clinical-trials/trial-data-and-results for more information), Pfizer will provide access to individual de‐identified participant data from Pfizer‐sponsored global interventional clinical studies conducted for medicines, vaccines, and medical devices (i) for indications that have been approved in the United States and/or the European Union or (ii) in programs that have been terminated (i.e., development for all indications has been discontinued). Pfizer will also consider requests for the protocol, data dictionary, and statistical analysis plan. Data may be requested from Pfizer trials 24 months after study completion. The de‐identified participant data will be made available to researchers whose proposals meet the research criteria and other conditions, and for which an exception does not apply, via a secure portal. To gain access, data requestors must enter into a data access agreement with Pfizer.
Prior presentation
These data have been presented in part at the American Association of Pharmaceutical Scientists (AAPS) Annual Meeting and Exposition, October 25–29, 2015, Orlando, FL, USA (abstract 2472), and at the 27th European Congress of Clinical Microbiology and Infectious Diseases (ECCMID), April 22–25, 2017, Vienna, Austria (abstract 2628).
Funding
The PopPK and PTA analyses were sponsored by AstraZeneca. The clinical studies NXL104‐1001; NXL104‐1002; NXL104‐1003; and NXL104‐1004 were sponsored by Novexel Pharmaceuticals, and rights were subsequently acquired by AstraZeneca; D4280C00010 (NCT01291602); D4280C00011 (NCT01430910); D4280C00020 (NCT01920399); RECLAIM 1 and 2 (NCT01499290 and NCT01500239); RECLAIM 3 (NCT01726023); REPRISE (NCT01644643); RECAPTURE 1 and 2 (NCT01595438 and NCT01599806); and REPROVE (NCT01808092) were originally sponsored by AstraZeneca and are now sponsored by Pfizer; and studies CXL‐PK‐01; CXL‐PK‐03; CXL‐PK‐04 (NCT01624246); and CXL‐PK‐06 were sponsored by Forest Laboratories, a subsidiary of Allergan PLC. AstraZeneca's rights to ceftazidime‐avibactam were acquired by Pfizer in December 2016.
Conflict of Interest
Jianguo Li and Shampa Das are former employees of and shareholders in AstraZeneca. Diansong Zhou is an employee of and shareholder in AstraZeneca. Mark Lovern, Michelle Green, Craig Comisar, and Yuan Xiong are employees of Certara Strategic Consulting (formerly Quantitative Solutions), and James Wright is an employee of Wright Dose Ltd, both of which received funding from AstraZeneca for support and assistance with the PopPK analyses. Merran MacPherson is a former employee of Wright Dose Ltd. and also holds shares in AstraZeneca. Joannellyn Chiu and Jeremy Hing are former employees of Certara Strategic Consulting. Todd Riccobene and Timothy J. Carrothers are employees of and shareholders in Allergan (formerly Actavis, formerly Forest Laboratories).
Author Contributions
All authors wrote the manuscript. J.L., D.Z., T.R., T.J.C., and S.D. designed the research. J.L., M.L., M.L.G., J.C., D.Z., C.C., X.Y., J.H., M.M., J.G.W., T.R., T.J.C., and S.D. performed the research. M.L., M.J.L., J.C., C.C., X.Y., and J.H. analyzed the data.
Supporting information
Data S1. Model code file.
Data S2. Supplementary methods.
Data S3. Supplementary results.
Table S1. Summary of clinical studies included in the PopPK model.
Table S2. Summary of ceftazidime subject baseline demographic characteristics by study type and indication.
Table S3. Summary of avibactam subject baseline demographic characteristics by study type and indication.
Table S4. Point estimates and 90% confidence intervals for the final population pharmacokinetic parameter estimates for ceftazidime from bootstrap resampling.
Table S5. Point estimates and 90% confidence intervals for the final population pharmacokinetic parameter estimates for avibactam from bootstrap resampling.
Figure S1. Ceftazidime prediction‐corrected visual predictive checks stratified by study phase and indication.
Figure S2. Ceftazidime prediction‐corrected visual predictive checks stratified by age categories.
Figure S3. Ceftazidime prediction‐corrected visual predictive checks stratified by CrCL categories.
Figure S4. Ceftazidime prediction‐corrected visual predictive checks stratified by CrCL and BMI categories of interest.
Figure S5. Avibactam prediction‐corrected visual predictive check stratified by study phase and indication.
Figure S6. Avibactam prediction‐corrected visual predictive check stratified by age categories.
Figure S7. Avibactam prediction‐corrected visual predictive check stratified by CrCL categories.
Figure S8. Avibactam prediction‐corrected visual predictive check stratified by CrCL and BMI categories of interest.
Figure S9. Goodness‐of‐fit of observed vs. predicted population and individual ceftazidime concentrations, conditional weighted residual error vs. population prediction and conditional weighted residual vs. time.
Figure S10. Goodness‐of‐fit of observed vs. predicted population and individual avibactam concentrations, conditional weighted residual error vs. population prediction and conditional weighted residual vs. time.
Acknowledgments
The authors thank all the subjects and investigators involved in the trials included in the PopPK models, and Nidal Al‐Huniti of AstraZeneca for contributions to the PopPK analysis. Medical writing support was provided by Mark Waterlow BSc, CMPPTM of Prime Medica Ltd, Knutsford, Cheshire, UK, and funded by AstraZeneca and Pfizer. The design and conduct of the studies, as well as analysis of the study data and opinions, conclusions, and interpretation of the data, are the responsibility of the authors.
References
- 1. Carlet, J. , Jarlier, V. , Harbarth, S. , Voss, A. , Goossens, H. & Pittet, D. Ready for a world without antibiotics? The pensieres antibiotic resistance call to action. Antimicrob. Resist. Infect. Control 1, 11 (2012). [DOI] [PMC free article] [PubMed] [Google Scholar]
- 2. Barbier, F. , Andremont, A. , Wolff, M. & Bouadma, L. Hospital‐acquired pneumonia and ventilator‐associated pneumonia: recent advances in epidemiology and management. Curr. Opin. Pulm. Med. 19, 216–228 (2013). [DOI] [PubMed] [Google Scholar]
- 3. Nicolle, L.E. Urinary tract infection. Crit. Care Clin. 29, 699–715 (2013). [DOI] [PubMed] [Google Scholar]
- 4. Sartelli, M. et al Complicated intra‐abdominal infections in a worldwide context: an observational prospective study (CIAOW Study). World J. Emerg. Surg. 8, 1 (2013). [DOI] [PMC free article] [PubMed] [Google Scholar]
- 5. Lagacé‐Wiens, P. , Walkty, A. & Karlowsky, J.A. Ceftazidime‐avibactam: an evidence‐based review of its pharmacology and potential use in the treatment of gram‐negative bacterial infections. Core Evid. 9, 13–25 (2014). [DOI] [PMC free article] [PubMed] [Google Scholar]
- 6. Lahiri, S. et al Structural insight into potent broad‐spectrum inhibition with reversible recyclization mechanism: avibactam in complex with CTX‐M‐15 and Pseudomonas aeruginosa AmpC beta‐lactamases. Antimicrob. Agents Chemother. 57, 2496–2505 (2013). [DOI] [PMC free article] [PubMed] [Google Scholar]
- 7. Zhanel, G.G. et al Ceftazidime‐avibactam: a novel cephalosporin/beta‐lactamase inhibitor combination. Drugs 73, 159–177 (2013). [DOI] [PubMed] [Google Scholar]
- 8. Aktas, Z. , Kayacan, C. & Oncul, O. In vitro activity of avibactam (NXL104) in combination with beta‐lactams against gram‐negative bacteria, including OXA‐48 beta‐lactamase‐producing Klebsiella pneumoniae . Int. J. Antimicrob. Agents 39, 86–89 (2012). [DOI] [PubMed] [Google Scholar]
- 9. de Jonge, B.L. , Karlowsky, J.A. , Kazmierczak, K.M. , Biedenbach, D.J. , Sahm, D.F. & Nichols, W.W. In vitro susceptibility to ceftazidime‐avibactam of carbapenem‐nonsusceptible enterobacteriaceae isolates collected during the INFORM global surveillance study (2012 to 2014). Antimicrob. Agents Chemother. 60, 3163–3169 (2016). [DOI] [PMC free article] [PubMed] [Google Scholar]
- 10. Kazmierczak, K.M. et al Global dissemination of blaKPC into bacterial species beyond Klebsiella pneumoniae and in vitro susceptibility to Ceftazidime‐Avibactam and Aztreonam‐Avibactam. Antimicrob. Agents Chemother. 60, 4490–4500 (2016). [DOI] [PMC free article] [PubMed] [Google Scholar]
- 11. Allergan USA . AVYCAZ (ceftazidime‐avibactam) for injection, for intravenous use: prescribing information<http://pi.actavis.com/data_stream.asp?product_group=1957&p=pi&language=E> (2018).
- 12. Pfizer . Summary of Product Characteristics: Zavicefta. <http://www.ema.europa.eu/docs/en_GB/document_library/EPAR_-_Product_Information/human/004027/WC500210234.pdf> (2018).
- 13. Lucasti, C. , Popescu, I. , Ramesh, M.K. , Lipka, J. & Sable, C. Comparative study of the efficacy and safety of ceftazidime/avibactam plus metronidazole versus meropenem in the treatment of complicated intra‐abdominal infections in hospitalized adults: results of a randomized, double‐blind, Phase II trial. J. Antimicrob. Chemother. 68, 1183–1192 (2013). [DOI] [PubMed] [Google Scholar]
- 14. Vazquez, J.A. et al Efficacy and safety of ceftazidime‐avibactam versus imipenem‐cilastatin in the treatment of complicated urinary tract infections, including acute pyelonephritis, in hospitalized adults: results of a prospective, investigator‐blinded, randomized study. Curr. Med. Res. Opin. 28, 1921–1931 (2012). [DOI] [PubMed] [Google Scholar]
- 15. Mazuski, J.E. et al Efficacy and safety of ceftazidime‐avibactam plus metronidazole versus meropenem in the treatment of complicated intra‐abdominal infection: results from a randomized, controlled, double‐blind, phase 3 program. Clin. Infect. Dis. 62, 1380–1389 (2016). [DOI] [PMC free article] [PubMed] [Google Scholar]
- 16. Qin, X. et al A randomised, double‐blind, phase 3 study comparing the efficacy and safety of ceftazidime/avibactam plus metronidazole versus meropenem for complicated intra‐abdominal infections in hospitalised adults in Asia. Int. J. Antimicrob. Agents 49, 579–588 (2017). [DOI] [PubMed] [Google Scholar]
- 17. Wagenlehner, F.M. et al Ceftazidime‐avibactam versus doripenem for the treatment of complicated urinary tract infections, including acute pyelonephritis: RECAPTURE, a phase 3 randomized trial program. Clin. Infect. Dis. 63, 754–762 (2016). [DOI] [PMC free article] [PubMed] [Google Scholar]
- 18. Carmeli, Y. et al Ceftazidime‐avibactam or best available therapy in patients with ceftazidime‐resistant Enterobacteriaceae and Pseudomonas aeruginosa complicated urinary tract infections or complicated intra‐abdominal infections (REPRISE): a randomised, pathogen‐directed, phase 3 study. Lancet Infect. Dis. 16, 661–673 (2016). [DOI] [PubMed] [Google Scholar]
- 19. Torres, A. et al Ceftazidime‐avibactam versus meropenem in nosocomial pneumonia, including ventilator‐associated pneumonia (REPROVE): a randomised, double‐blind, phase 3 non‐inferiority trial. Lancet Infect. Dis. 18, 285–295 (2018). [DOI] [PubMed] [Google Scholar]
- 20. Carrothers, T.J. , Green, M. , Chiu, J. , Riccobene, T. , Lovern, M. & Chen, Z . Population Pharmacokinetic Modeling of Combination Treatment of Intravenous Ceftazidime and Avibactam. 5th American Conference on Pharmacometrics, Las Vegas, NV, USA (2014).
- 21. Li, J. et al Population PK Modeling for Ceftazidime‐Avibactam (CAZ‐AVI) in Patients with Complicated Intra‐abdominal Infection (cIAI) and Complicated Urinary Tract Infection (cUTI). American Association of Pharmaceutical Scientists Annual Meeting and Exposition, Orlando, FL, USA: (2015). [Google Scholar]
- 22. Das, S. , Wright, J, G. , Riccobene, T. , Macpherson, M. Carrothers, T. J. & Lovern, M. Comparison of Ceftazidime‐Avibactam (CAZ‐AVI) Exposure and PK/PD Target Attainment (TA) Across Patient Subgroups. ASM Microbe, Boston, MA, USA: (2016). [Google Scholar]
- 23. Center for Drug Evaluation and Research . Application number: 206494Orig1s000. Ceftazidime‐avibactam. Clinical Pharmacology and Biopharmaceutics Review(s), 2015. <https://www.accessdata.fda.gov/drugsatfda_docs/nda/2015/206494orig1s000cllinpharmr.pdf> (2015).
- 24. Musuamba, F.T. et al Advanced methods for dose and regimen finding during drug development: summary of the EMA/EFPIA workshop on dose finding (London December 4–5, 2014). CPT Pharmacometrics Syst. Pharmacol. 6, 418–429 (2017). [DOI] [PMC free article] [PubMed] [Google Scholar]
- 25. Knaus, W.A. , Draper, E.A. , Wagner, D.P. & Zimmerman, J.E. APACHE II: a severity of disease classification system. Crit. Care Med. 13, 818–829 (1985). [PubMed] [Google Scholar]
- 26. Vishwanathan, K. et al Assessment of the mass balance recovery and metabolite profile of avibactam in humans and in vitro drug‐drug interaction potential. Drug Metab. Dispos. 42, 932–942 (2014). [DOI] [PubMed] [Google Scholar]
- 27. European Medicines Agency . Zavicefta European Public Assessment Report. <http://www.ema.europa.eu/docs/en_GB/document_library/EPAR_-Public_assessment_report/human/004027/WC500210236.pdf> (2016).
- 28. Andes, D. & Craig, W.A. Animal model pharmacokinetics and pharmacodynamics: a critical review. Int. J. Antimicrob. Agents 19, 261–268 (2002). [DOI] [PubMed] [Google Scholar]
- 29. Andes, D. & Craig, W.A. Treatment of infections with ESBL‐producing organisms: pharmacokinetic and pharmacodynamic considerations. Clin. Microbiol. Infect. 11 (suppl. 6), 10–17 (2005). [DOI] [PubMed] [Google Scholar]
- 30. MacVane, S.H. , Kuti, J.L. & Nicolau, D.P. Clinical pharmacodynamics of antipseudomonal cephalosporins in patients with ventilator‐associated pneumonia. Antimicrob. Agents Chemother. 58, 1359–1364 (2014). [DOI] [PMC free article] [PubMed] [Google Scholar]
- 31. Muller, A.E. , Punt, N. & Mouton, J.W. Optimal exposures of ceftazidime predict the probability of microbiological and clinical outcome in the treatment of nosocomial pneumonia. J. Antimicrob. Chemother. 68, 900–906 (2013). [DOI] [PubMed] [Google Scholar]
- 32. Castanheira, M. , Farrell, S.E. , Krause, K.M. , Jones, R.N. & Sader, H.S. Contemporary diversity of beta‐lactamases among Enterobacteriaceae in the nine U.S. census regions and ceftazidime‐avibactam activity tested against isolates producing the most prevalent beta‐lactamase groups. Antimicrob. Agents Chemother. 58, 833–838 (2014). [DOI] [PMC free article] [PubMed] [Google Scholar]
- 33. Flamm, R.K. , Stone, G.G. , Sader, H.S. , Jones, R.N. & Nichols, W.W. Avibactam reverts the ceftazidime MIC90 of European gram‐negative bacterial clinical isolates to the epidemiological cut‐off value. J. Chemother. 26, 333–338 (2014). [DOI] [PubMed] [Google Scholar]
- 34. Levasseur, P. et al In vitro antibacterial activity of the ceftazidime‐avibactam (NXL104) combination against Pseudomonas aeruginosa clinical isolates. Antimicrob. Agents Chemother. 56, 1606–1608 (2012). [DOI] [PMC free article] [PubMed] [Google Scholar]
- 35. Nichols, W.W. , de Jonge, B.L. , Kazmierczak, K.M. , Karlowsky, J.A. & Sahm, D.F. In vitro susceptibility of global surveillance isolates of Pseudomonas aeruginosa to ceftazidime‐avibactam (INFORM 2012 to 2014). Antimicrob. Agents Chemother. 60, 4743–4749 (2016). [DOI] [PMC free article] [PubMed] [Google Scholar]
- 36. Sader, H.S. , Castanheira, M. , Flamm, R.K. , Farrell, D.J. & Jones, R.N. Antimicrobial activity of ceftazidime‐avibactam against Gram‐negative organisms collected from U.S. medical centers in 2012. Antimicrob. Agents Chemother. 58, 1684–1692 (2014). [DOI] [PMC free article] [PubMed] [Google Scholar]
- 37. Coleman, K. et al Activities of ceftazidime and avibactam against beta‐lactamase‐producing Enterobacteriaceae in a hollow‐fiber pharmacodynamic model. Antimicrob. Agents Chemother. 58, 3366–3372 (2014). [DOI] [PMC free article] [PubMed] [Google Scholar]
- 38. Berkhout, J. et al Pharmacodynamics of ceftazidime and avibactam in neutropenic mice with thigh or lung infection. Antimicrob. Agents Chemother. 60, 368–375 (2015). [DOI] [PMC free article] [PubMed] [Google Scholar]
- 39. Nichols, W.W. , Newell, P. , Critchley, I. , Riccobene, T. & Das, S. Avibactam pharmacokinetic/pharmacodynamic targets. Antimicrob. Agents Chemother. 62, 16 (2018). [DOI] [PMC free article] [PubMed] [Google Scholar]
- 40. Owens, R.C. Jr & Shorr, A.F. Rational dosing of antimicrobial agents: pharmacokinetic and pharmacodynamic strategies. Am. J. Health Syst. Pharm. 66(12 suppl. 4), S23–S30 (2009). [DOI] [PubMed] [Google Scholar]
- 41. Asin‐Prieto, E. , Rodriguez‐Gascon, A. & Isla, A. Applications of the pharmacokinetic/pharmacodynamic (PK/PD) analysis of antimicrobial agents. J. Infect. Chemother. 21, 319–329 (2015). [DOI] [PubMed] [Google Scholar]
- 42. Mouton, J.W. et al The role of pharmacokinetics/pharmacodynamics in setting clinical MIC breakpoints: the EUCAST approach. Clin. Microbiol. Infect. 18, E37–E45 (2012). [DOI] [PubMed] [Google Scholar]
- 43. Goncalves‐Pereira, J. & Povoa, P. Antibiotics in critically ill patients: a systematic review of the pharmacokinetics of beta‐lactams. Crit. Care 15, R206 (2011). [DOI] [PMC free article] [PubMed] [Google Scholar]
- 44. Pea, F. Plasma pharmacokinetics of antimicrobial agents in critically ill patients. Curr. Clin. Pharmacol. 8, 5–12 (2013). [PubMed] [Google Scholar]
- 45. Roberts, J.A. et al Individualised antibiotic dosing for patients who are critically ill: challenges and potential solutions. Lancet Infect. Dis. 14, 498–509 (2014). [DOI] [PMC free article] [PubMed] [Google Scholar]
- 46. Udy, A.A. , Roberts, J.A. , Boots, R.J. , Paterson, D.L. & Lipman, J. Augmented renal clearance: implications for antibacterial dosing in the critically ill. Clin. Pharmacokinet. 49, 1–16 (2010). [DOI] [PubMed] [Google Scholar]
- 47. Li, J. et al PK/PD target attainment analyses and assessment of dose adjustments for renal insufficiency for ceftazidime‐avibactam (CAZ‐AVI) in patients with complicated intra‐abdominal infection (cIAI), complicated urinary tract infection (cUTI) or nosocomial pneumonia (NP). American Association of Pharmaceutical Scientists (AAPS) Annual Meeting and Exposition. Orlando, FL, USA (2015).
- 48. Sy, S.K.B. & Derendorf, H. Experimental design and modelling approach to evaluate efficacy of beta‐lactam/beta‐lactamase inhibitor combinations. Clin. Microbiol. Infect. 24, 707–715 (2018). [DOI] [PubMed] [Google Scholar]
- 49. Sy, S.K.B. et al A mathematical model‐based analysis of the time‐kill kinetics of ceftazidime/avibactam against Pseudomonas aeruginosa. J. Antimicrob. Chemother. 73, 1295–1304 (2018). [DOI] [PubMed] [Google Scholar]
- 50. Kristoffersson, A.N. et al A Novel Mechanism‐Based Pharmacokinetic‐Pharmacodynamic Model Describing Ceftazidime‐Avibactam (CAZ‐AVI) Efficacy Against β‐lactamase‐Producing Klebsiella pneumoniae and Pseudomonas aeruginosa Isolates Isolates. Annual Meeting of the Population Approach Group in Europe (PAGE). Montreux, Switzerland; (2018).
Associated Data
This section collects any data citations, data availability statements, or supplementary materials included in this article.
Supplementary Materials
Data S1. Model code file.
Data S2. Supplementary methods.
Data S3. Supplementary results.
Table S1. Summary of clinical studies included in the PopPK model.
Table S2. Summary of ceftazidime subject baseline demographic characteristics by study type and indication.
Table S3. Summary of avibactam subject baseline demographic characteristics by study type and indication.
Table S4. Point estimates and 90% confidence intervals for the final population pharmacokinetic parameter estimates for ceftazidime from bootstrap resampling.
Table S5. Point estimates and 90% confidence intervals for the final population pharmacokinetic parameter estimates for avibactam from bootstrap resampling.
Figure S1. Ceftazidime prediction‐corrected visual predictive checks stratified by study phase and indication.
Figure S2. Ceftazidime prediction‐corrected visual predictive checks stratified by age categories.
Figure S3. Ceftazidime prediction‐corrected visual predictive checks stratified by CrCL categories.
Figure S4. Ceftazidime prediction‐corrected visual predictive checks stratified by CrCL and BMI categories of interest.
Figure S5. Avibactam prediction‐corrected visual predictive check stratified by study phase and indication.
Figure S6. Avibactam prediction‐corrected visual predictive check stratified by age categories.
Figure S7. Avibactam prediction‐corrected visual predictive check stratified by CrCL categories.
Figure S8. Avibactam prediction‐corrected visual predictive check stratified by CrCL and BMI categories of interest.
Figure S9. Goodness‐of‐fit of observed vs. predicted population and individual ceftazidime concentrations, conditional weighted residual error vs. population prediction and conditional weighted residual vs. time.
Figure S10. Goodness‐of‐fit of observed vs. predicted population and individual avibactam concentrations, conditional weighted residual error vs. population prediction and conditional weighted residual vs. time.