

Abstract
Ebola virus (EBOV) is a highly pathogenic filovirus that causes outbreaks of a severe hemorrhagic fever known as EBOV disease (EVD). Ebola virus disease is characterized in part by a dysregulated immune response and massive production of both pro- and anti-inflammatory cytokines. To better understand the immune response elicited by EVD in the context of treatment with experimental anti-EBOV antibody cocktails, we analyzed 29 cytokines in 42 EBOV-infected rhesus macaques. In comparison to the surviving treated animals, which exhibited minimal aberrations in only a few cytokine levels, nonsurviving animals exhibited a dramatically upregulated inflammatory response that was delayed by antibody treatment.
Keywords: cytokines, Ebola virus, filovirus, immune response, nonhuman primate
Ebola virus (EBOV) is a highly pathogenic filovirus that causes outbreaks of a severe hemorrhagic fever known as EBOV disease (EVD). The largest outbreak of EVD occurred in West Africa from 2013 to 2016, resulting in over 11 000 deaths and underscoring the significant global health threat posed by EBOV [1]. Ebola virus disease is characterized by robust and systemic virus replication that leads to a dysregulated immune response, organ damage, and coagulation abnormalities, often culminating in death [2]. In particular, high levels of pro- and anti-inflammatory cytokines released during the innate immune response to infection not only fail to control virus replication but are also thought to contribute to the development of ineffective cellular and humoral responses [3, 4]. Indeed, the upregulation of several proinflammatory cytokines correlates with increased mortality in humans infected with EBOV [5–9].
Thanks to their recapitulation of human disease, nonhuman primates (NHPs) are considered the gold-standard animal for modeling EVD pathogenesis and evaluating viral countermeasures [10, 11]. To better understand the changes in cytokine expression elicited by EBOV infection, we analyzed the cytokine profiles of 42 rhesus macaques infected with EBOV and treated with experimental anti-EBOV antibody cocktails. Our findings agree with much of the previously reported literature for human cases of EVD [5–9, 12–15], demonstrating that animals who succumb to disease exhibit dramatic increases in serum concentrations of some pro- and anti-inflammatory cytokines. In contrast, we found that treated animals who survive exhibit little change in their cytokine profiles. Overall, these data help further elucidate the pathophysiological processes of EVD, and they may aid in the future development of anti-EBOV vaccines or therapeutics, which have yet to see widespread clinical licensure.
METHODS
Nonhuman Primate Studies, Biosafety, and Ethics Statement
Serum samples were obtained from 42 rhesus macaques infected intramuscularly with a target dose of 1000 median tissue culture infectious dose (TCID50) EBOV (H.sapiens-wt/GIN/2014/Makona-Gueckedou-C07) enrolled in 3 separate efficacy studies of anti-EBOV antibody cocktails (Supplementary Table S1). Back titration revealed the actual virus doses to be 734 TCID50 for study 1, 862 TCID50 for study 2, and 862–1000 TCID50 for study 3 (Supplementary Table S1). Detailed descriptions of these efficacy studies and the antibody cocktails have been recently reported elsewhere [16–18]. All work with infectious samples was performed in the containment level 4 laboratories at the Canadian Science Centre for Human and Animal Health (CSCHAH), Public Health Agency of Canada, Winnipeg, Canada. Sample inactivation/removal was performed according to standard operating protocols approved by the institutional biosafety committee. All NHP studies were approved by the animal care committee of the CSCHAH according to guidelines from the Canadian Council on Animal Care.
Cytokine Quantification
Cytokine levels were quantified in γ-irradiated (5 mrad) NHP serum samples using the Cytokine 29-Plex Monkey Panel (Thermo Fisher Scientific) and the Luminex MAGPIX instrument (Thermo Fisher Scientific), according to manufacturer’s directions. In brief, 50 µL serum was diluted 1:4 and added to 25 µL 1× anticytokine antibody-coupled beads. After incubation, 1× biotinylated detector antibody was added before incubation with 1× streptavidin-RPE solution. Bead complexes were resuspended in wash buffer and 50 beads were counted for each sample during acquisition. All samples were run in duplicate, and mean fluorescence intensity was used to calculate final concentrations in picograms per milliliter. Analyzed cytokines were as follows: interleukin (IL)-1β, IL-1 receptor antagonist (IL-1RA), IL-2, IL-4, IL-5, IL-6, IL-8 (CXCL8), IL-10, IL-12, IL-15, IL-17, eotaxin, basic fibroblast growth factor (bFGF), granulocyte colony-stimulating factor (G-CSF), granulocyte macrophage CSF (GM-CSF), interferon-γ (IFN-γ), IFN-inducible protein 10 (IP-10; CXCL10), monocyte chemoattractant protein-1 (MCP-1; CCL2), macrophage inflammatory protein-1α (MIP-1α; CCL3), MIP-1β (CCL4), regulated-on activation normal T-cell expressed and secreted (RANTES; CCL5), tumor necrosis factor-α (TNF-α), vascular endothelial growth factor (VEGF), hepatocyte growth factor (HGF), monokine induced by IFN-γ (MIG; CXCL9), IFN-inducible T-cell alpha chemoattractant (ITAC), macrophage-derived chemokine (MDC; CCL22), macrophage migration inhibitory factor (MIF), and epidermal growth factor (EGF).
Statistical and Other Analyses
To facilitate comparisons among our data, we organized each serum sample into 1 of 5 temporal categories. Samples obtained preinfection (days −1, 0) were categorized as “Pre”; samples obtained early during acute disease (days 3, 4 postinfection) were categorized as “Early”; samples obtained late during acute disease (days 6, 7) were categorized as “Late”; samples obtained from survivors during convalescence (day 21) were categorized as “Conv.”; and terminal samples obtained from treated nonsurvivors (days 9–11) were categorized as “Term.” All data are presented as means plus or minus standard deviation. Individual values are indicated for each sample by a colored dot. Statistical comparisons were performed using an ordinary one-way analysis of variance test and Dunnett’s multiple comparison test using GraphPad Prism (version 7).
RESULTS
To broadly characterize the cytokine response in NHPs after infection with EBOV and treatment with antibody therapeutics, serum samples from 42 rhesus macaques were analyzed by Luminex assay using a 29-plex cytokine panel. All animals were infected intramuscularly with a lethal dose of EBOV (variant Makona), 36 were treated with 1 of 6 different antibody cocktails, and 6 control animals were left untreated (Supplementary Table S1). All control animals succumbed to disease by 8 days postinfection (DPI), whereas 28 of the 36 antibody-treated animals survived. It is notable that 8 of the treated animals succumbed between 9 and 11 DPI (termed “Treated Non-survivors”). Serum samples were obtained from each animal before infection and at regular intervals after infection, up to the terminal time point or the end of the study (28 DPI). All terminal samples were taken while the animal was still alive before euthanasia, except for the sample taken from Group G animal #2 (Supplementary Table S1), which was found dead. Cytokine levels, as well as viral genomic ribonucleic acid (RNA) concentrations, were assessed for each sample.
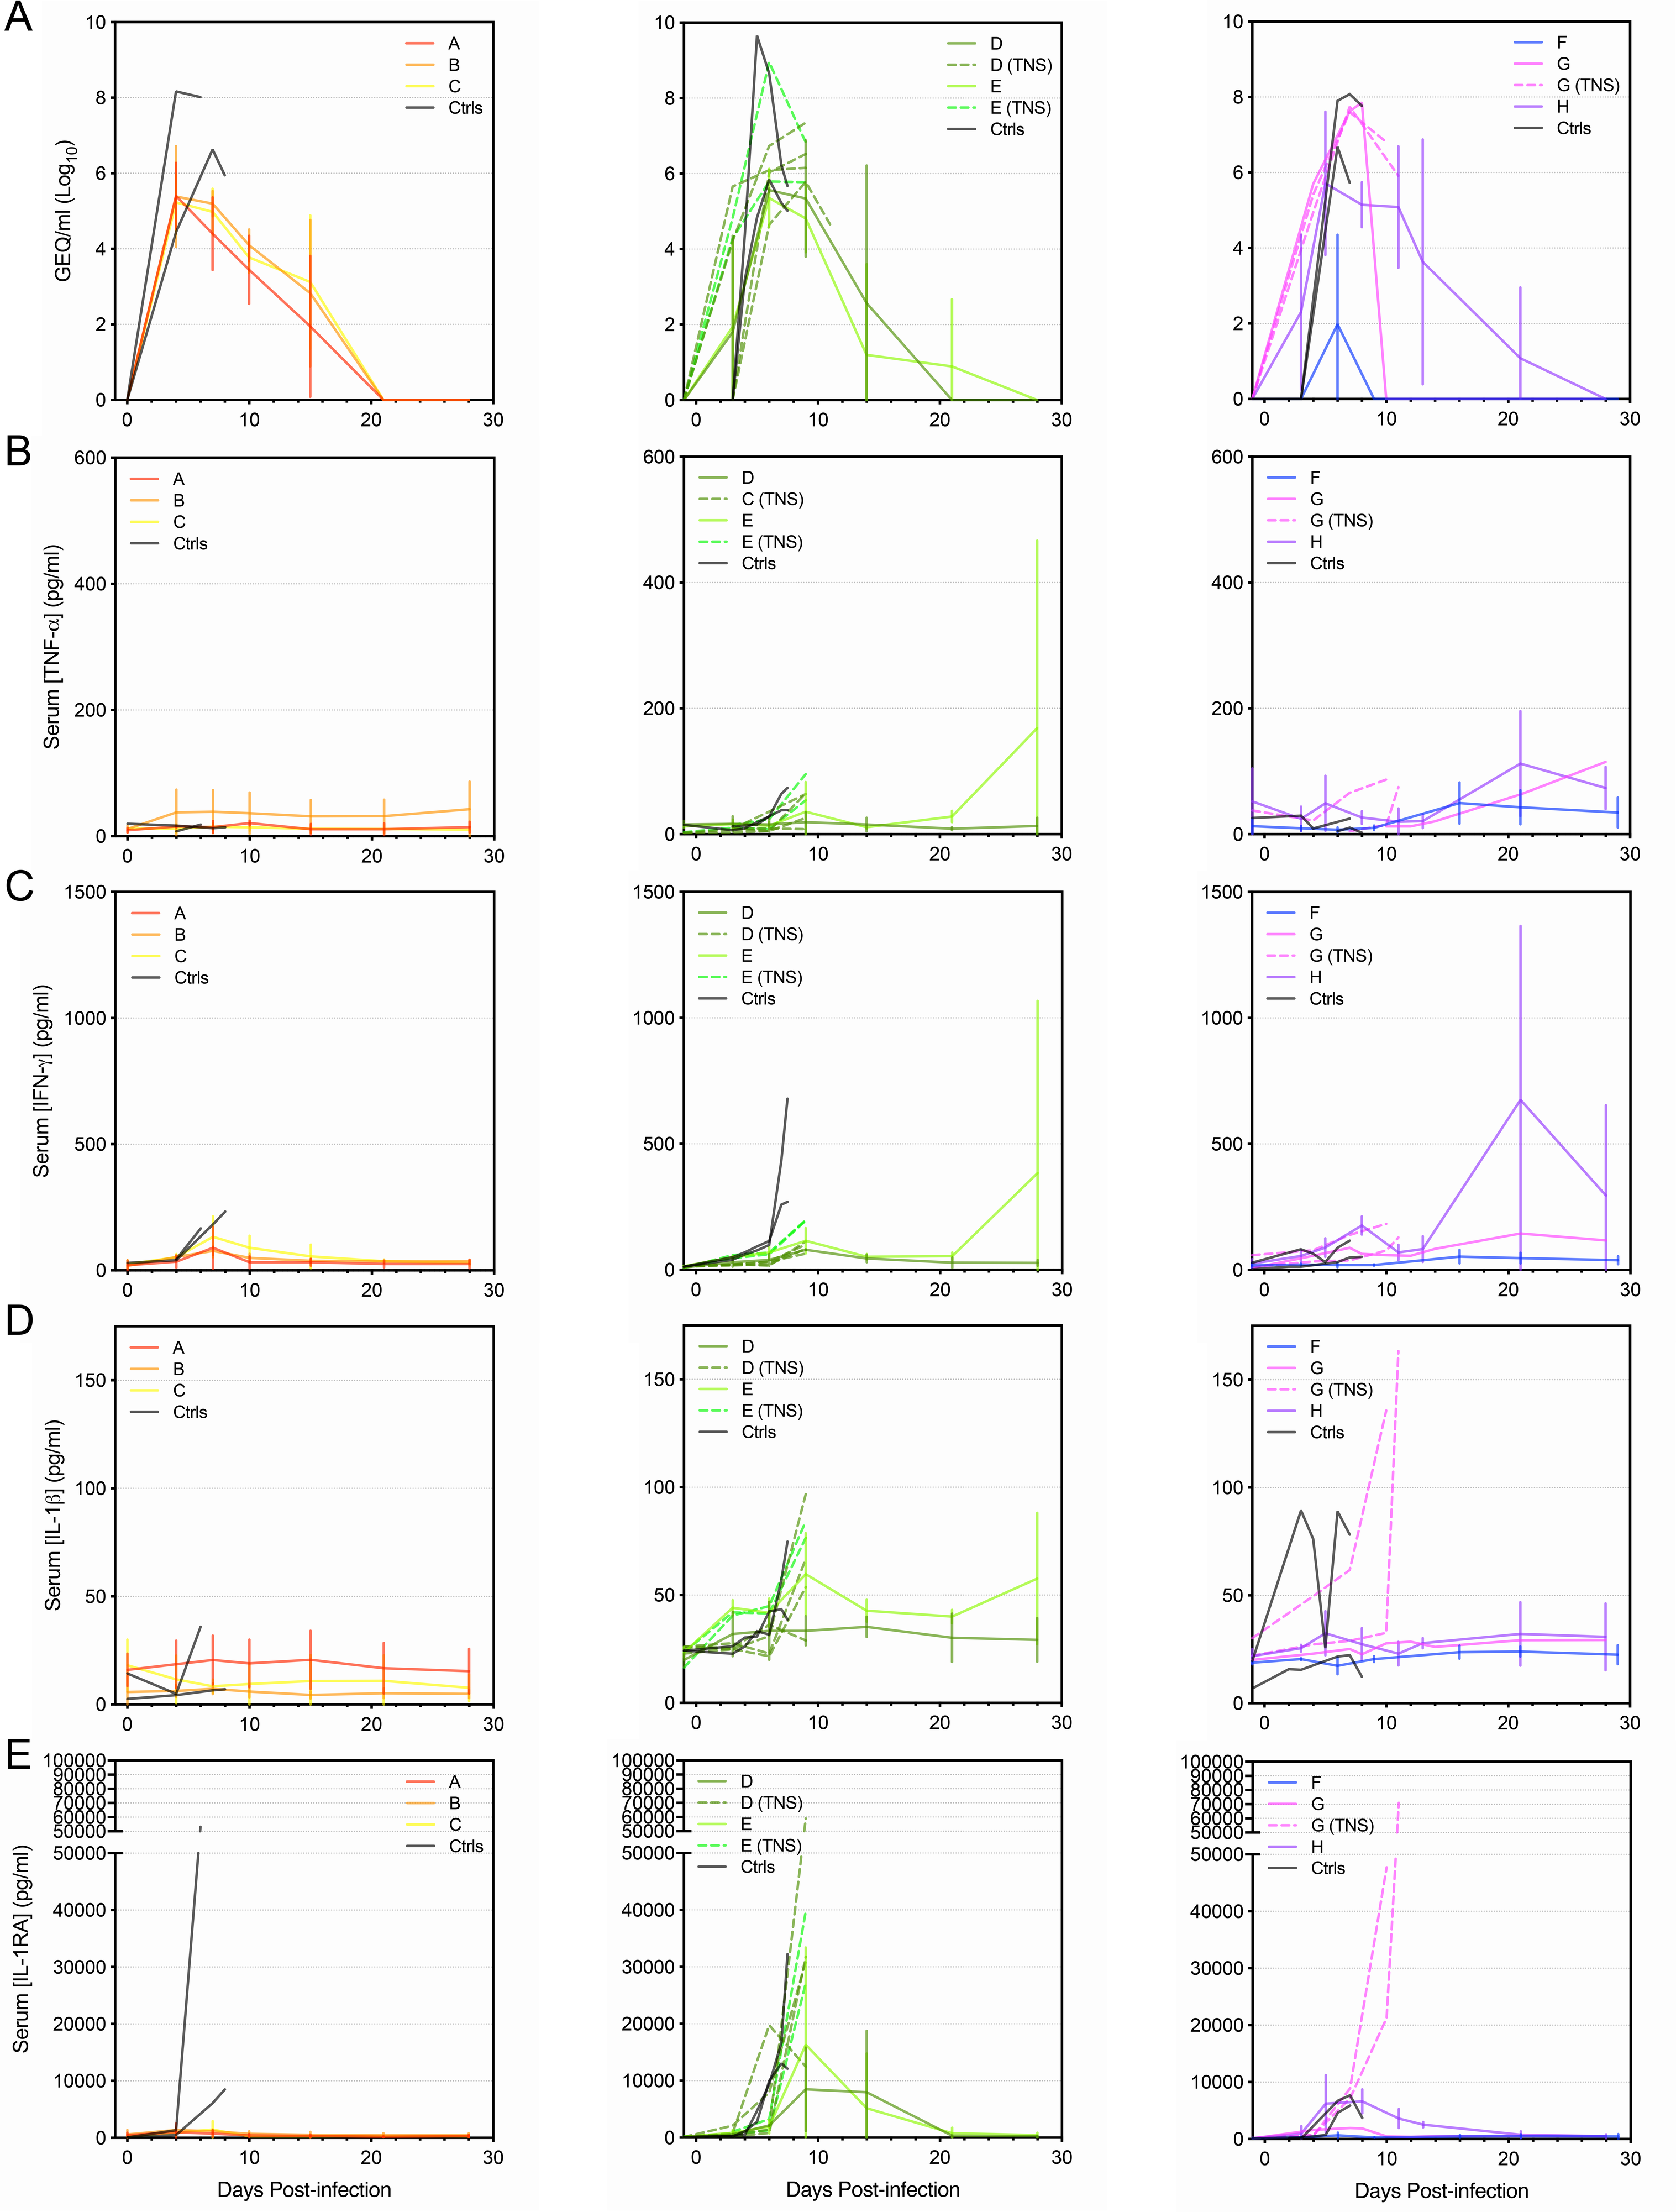
The surviving animals exhibited an average peak level of viremia late in the disease course approximately 105 genome equivalents (GEQ)/mL, which was less than the average peak of ~107 GEQ/mL observed in control animals (Figure 1A), demonstrating that although virus replication occurred in most survivors, it was reduced by antibody treatment. Likewise, treated nonsurvivors reached an average peak viremia slightly less than 107 GEQ/mL late in the disease course (Figure 2A). Viremia in treated nonsurvivors was significantly higher than the survivors at the late time point, and it was not appreciably reduced by the terminal time points (Figure 2A), indicating that antibody treatment was ineffective in these animals.
Figure 1.
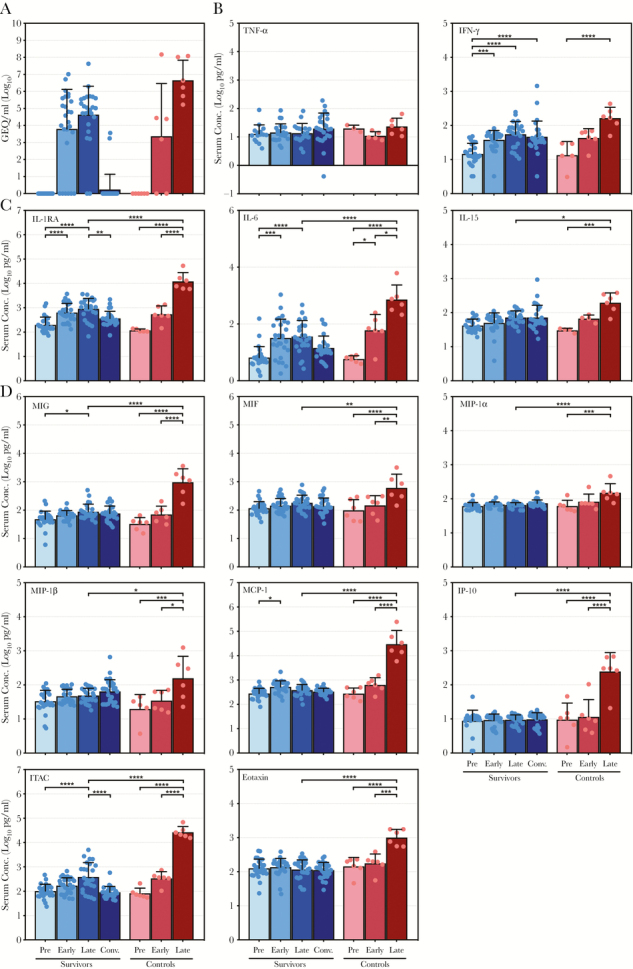
Comparison of virus ribonucleic acid and cytokine levels in surviving and control nonhuman primates infected with Ebola virus. (A) Ebola virus genome equivalents (GEQ) per milliliter of serum. (B–D) Serum concentrations (in log10 pg/mL) for (1) tumor necrosis factor (TNF)-α and interferon (IFN)-γ (B) as well as (2) specified interleukins (C) and specified chemokines (D) that exhibited significant upregulation in control animals in addition to significantly higher peak values than surviving animals. Data are depicted as mean values plus or minus the standard deviation for surviving and control animals preinfection (Pre), early postinfection (Early), late postinfection (Late), and during convalescence (Conv.; for survivors only). Values for each individual sample are indicated by a colored dot. *, P ≤ .05; **, P ≤ .01; ***, P ≤ .001; ****, P ≤ .0001. IL, interleukin; IL-1RA, IL-1 receptor antagonist; IP-10, IFN-inducible protein 10; ITAC, IFN-inducible T-cell alpha chemoattractant; MIF, macrophage migration inhibitory factor; MIG, monokine induced by IFN-γ; MIP, macrophage inflammatory protein-1α.
Figure 2.
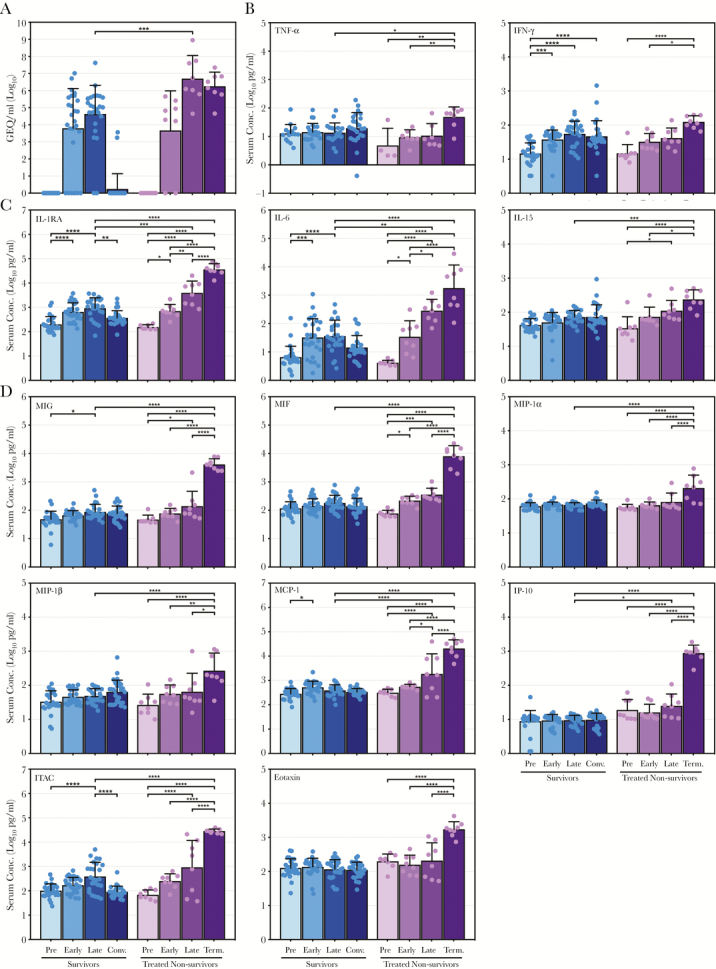
Virus ribonucleic acid and cytokine levels in treated nonsurviving nonhuman primates infected with Ebola virus. (A) Ebola virus genome equivalents (GEQ) per milliliter of serum. (B–D) Serum concentrations (in log10 pg/mL) for (1) tumor necrosis factor (TNF)-α and interferon (IFN)-γ (B) as well as (2) specified interleukins (C) and specified chemokines (D), mirroring Figure 1. Data are depicted as mean values plus or minus the standard deviation for antibody-treated, nonsurviving animals preinfection (Pre), early postinfection (Early), late postinfection (Late), and at the terminal time points (Term.). Data depicting the surviving animals (from Figure 1) are provided for comparison. Values for each sample are indicated by a colored dot. *, P ≤ .05; **, P ≤ .01; ***, P ≤ .001; ****, P ≤ .0001. IL, interleukin; IL-1RA, IL-1 receptor antagonist; IP-10, IFN-inducible protein 10; ITAC, IFN-inducible T-cell alpha chemoattractant; MIF, macrophage migration inhibitory factor; MIG, monokine induced by IFN-γ; MIP, macrophage inflammatory protein-1α.
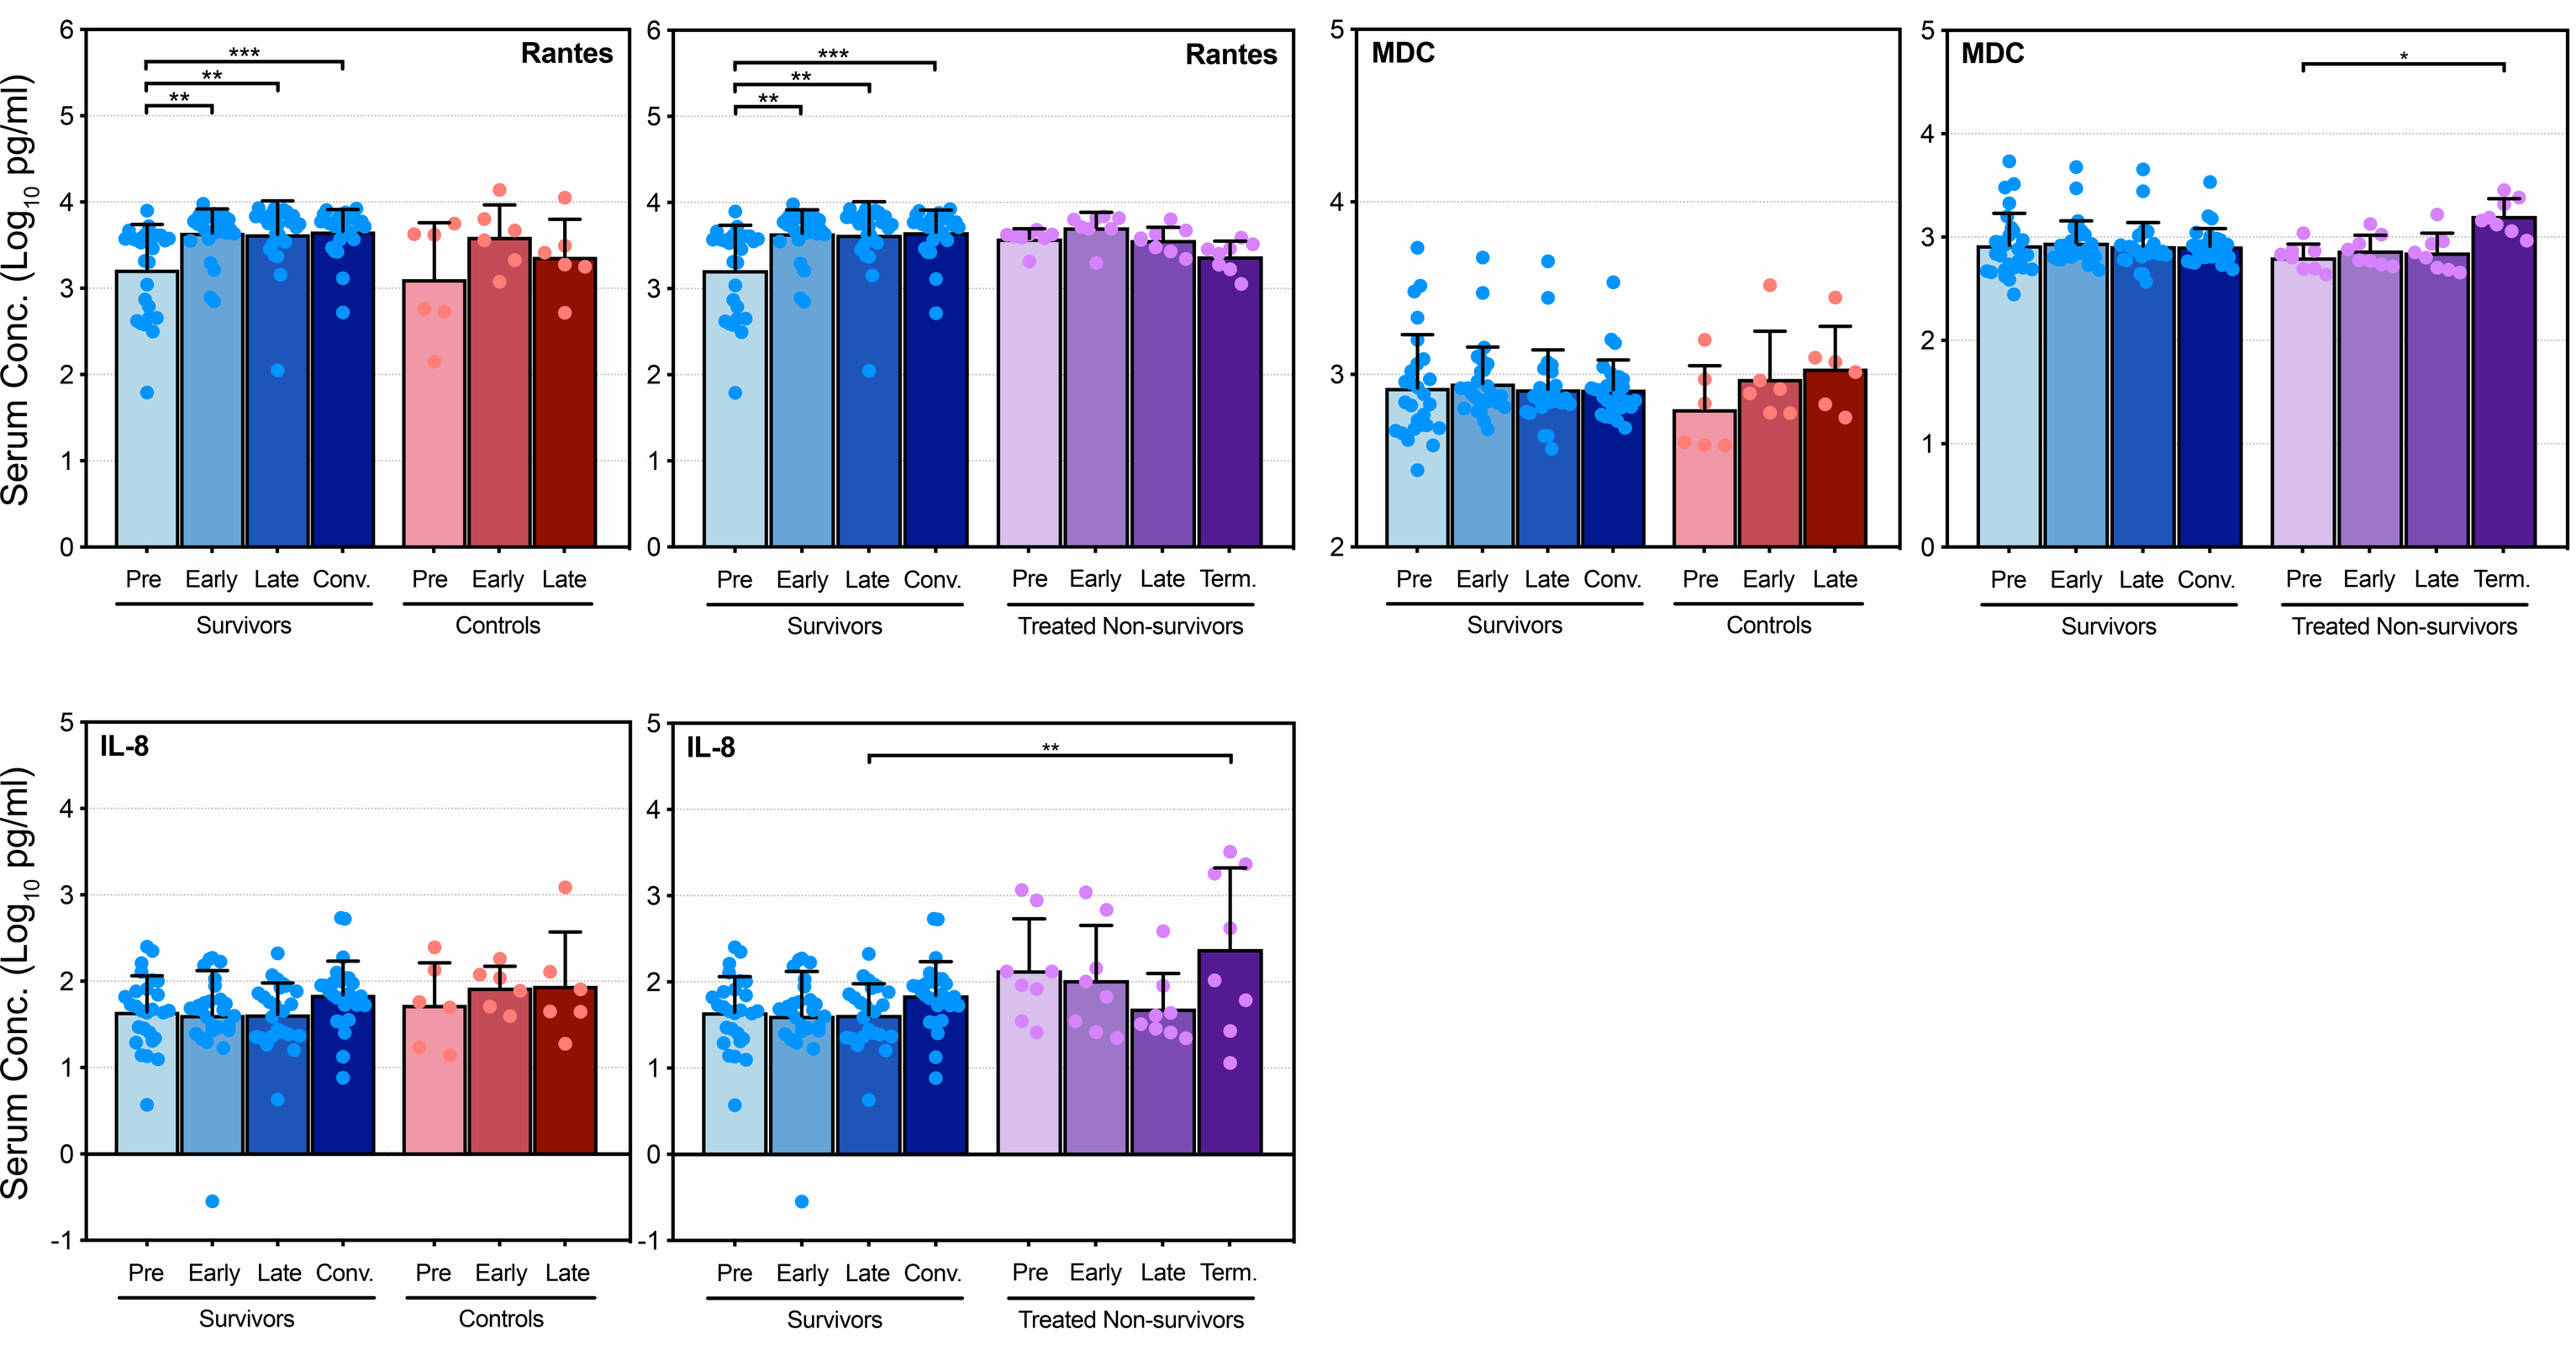
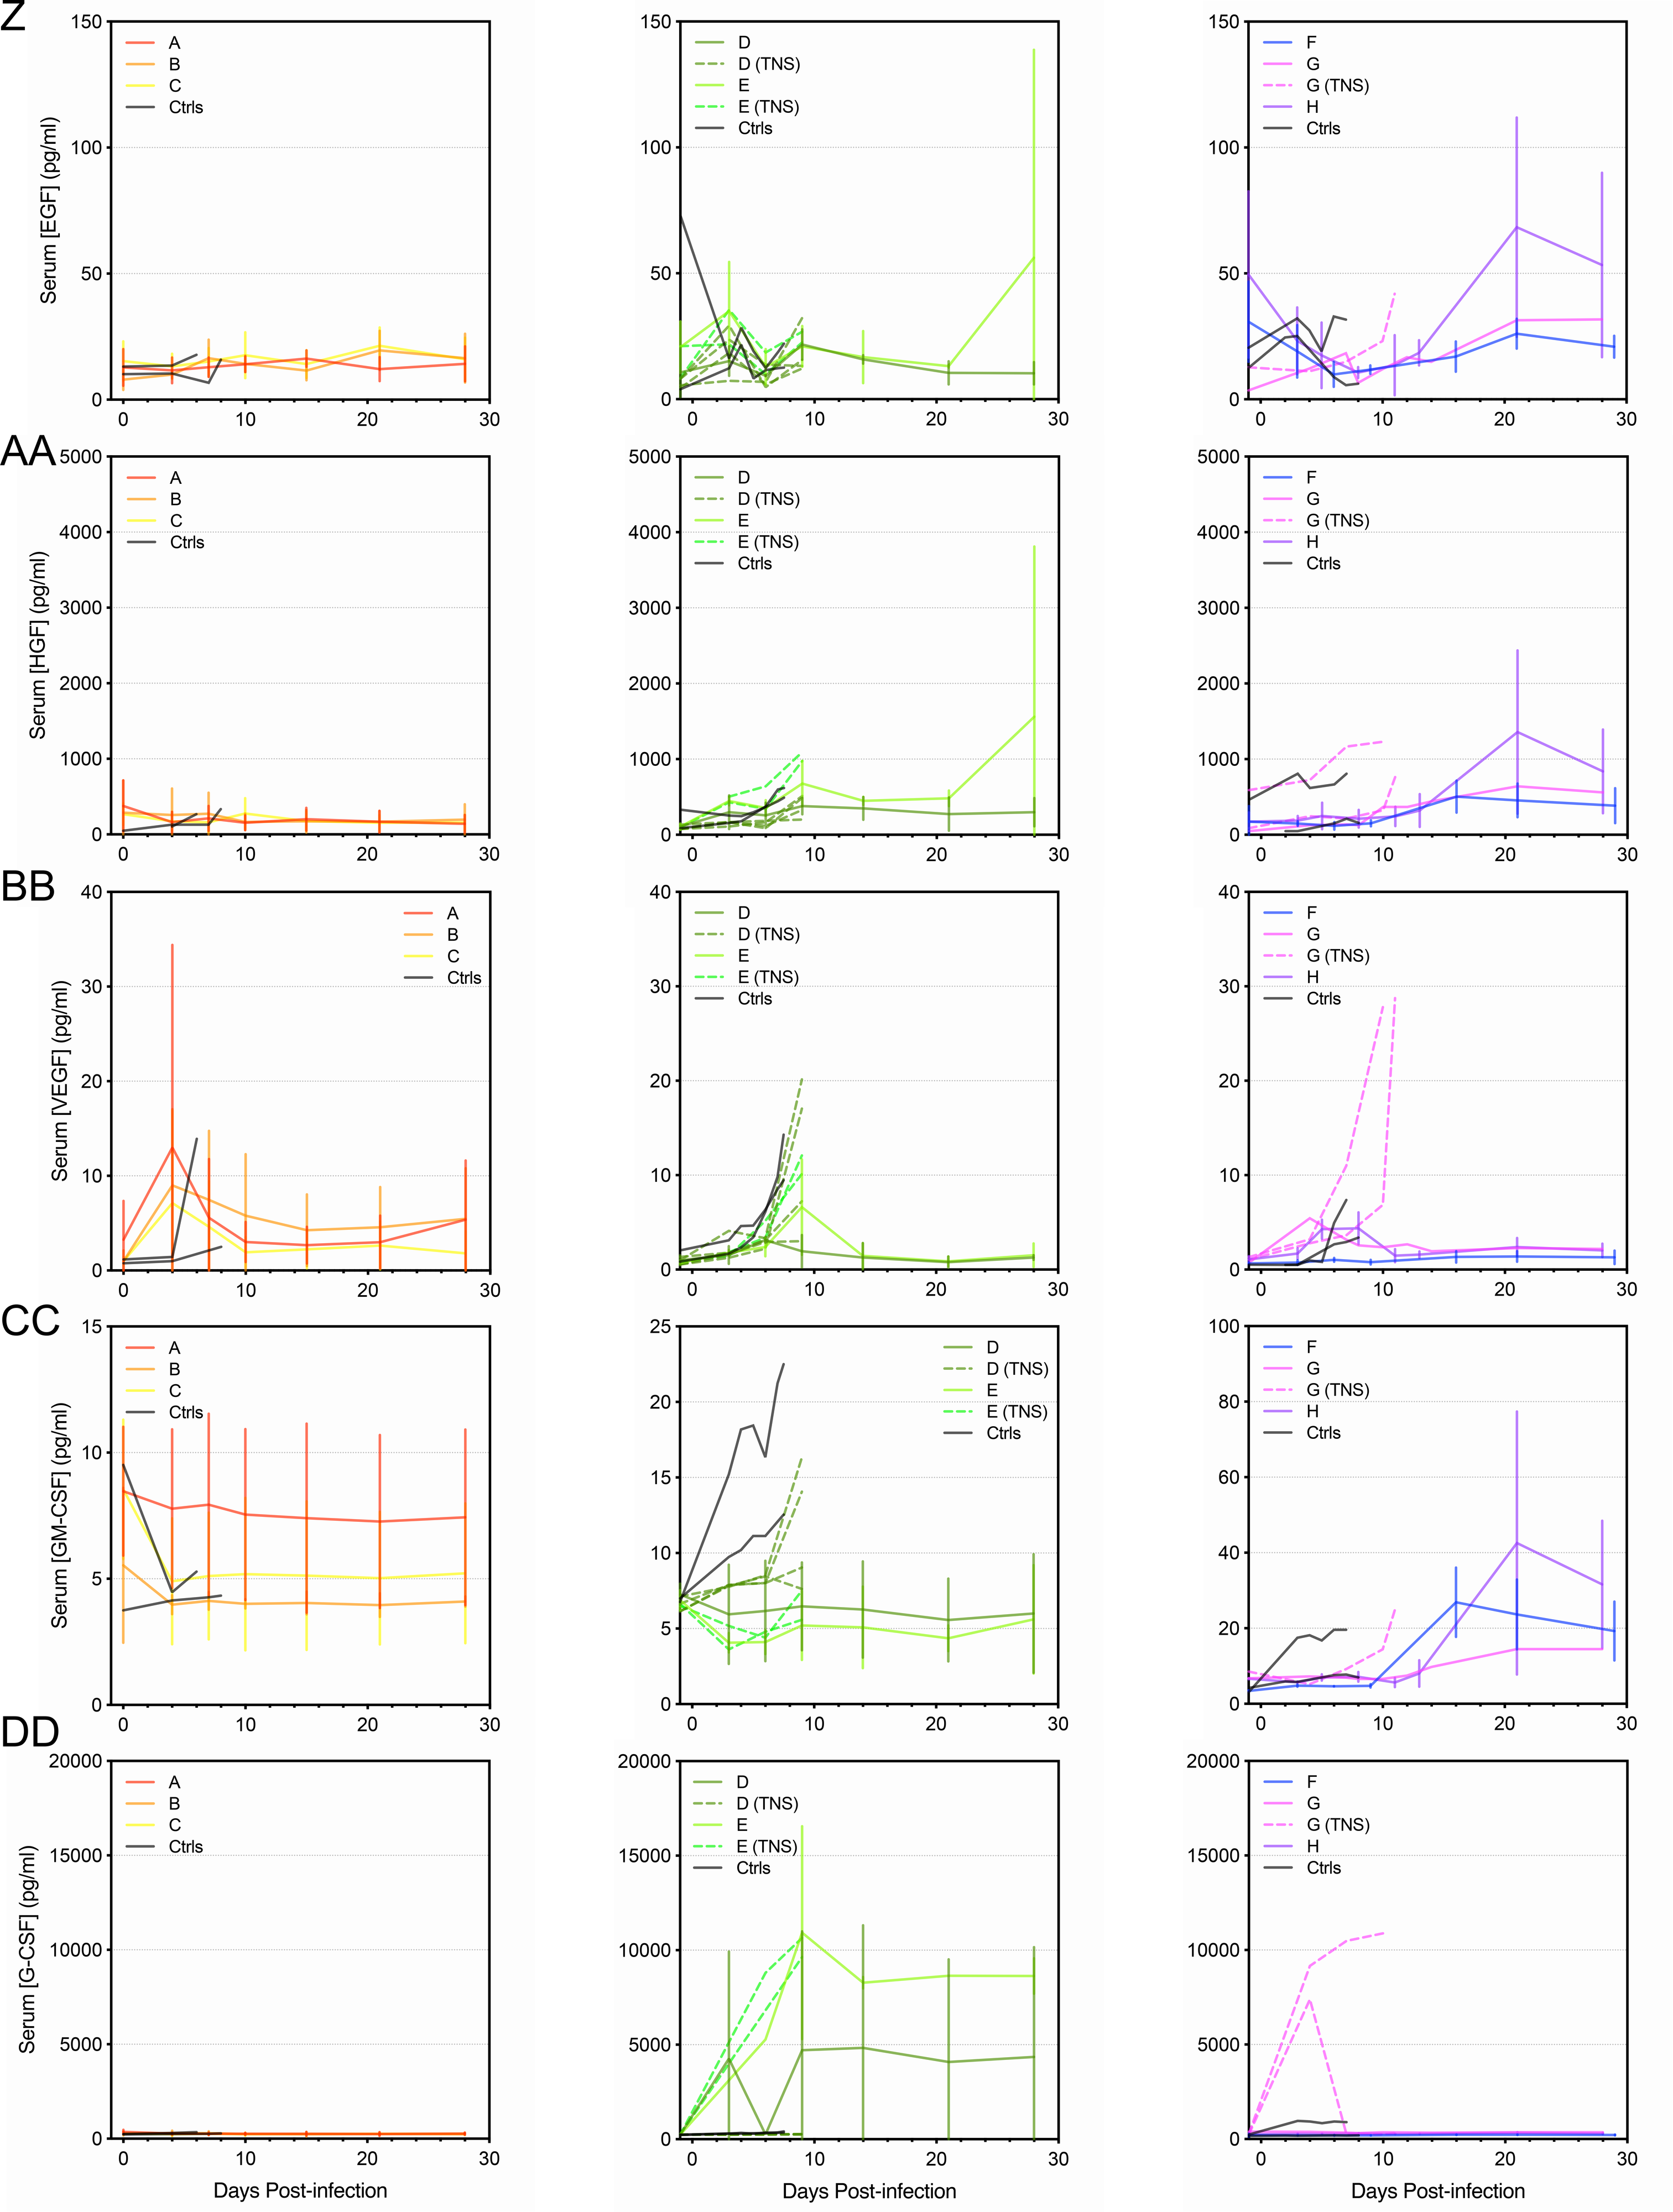
Overall, control animals exhibited a dysregulated inflammatory response characterized by dramatic upregulation of many pro- and anti-inflammatory cytokines (Figure 1B–D, Supplementary Figure S4, Supplementary Table S2). It is interesting to note that TNF-α levels did not increase significantly in either control or surviving animals throughout infection, and, although IFN-γ levels did increase, there were no statistically significant differences between the 2 groups (Figure 1B). Of the remaining cytokines analyzed, 11 showed significant increases in the control animals and reached peak levels statistically greater than the survivors (Figure 1C and D). Levels of the anti-inflammatory IL-1RA, as well as the proinflammatory IL-6 and IL-15, increased significantly in control animals, with peak levels in the control group reaching higher levels than the survivors (Figure 1C). A similar trend was observed for IL-10, whereas the remaining ILs exhibited little change from their preinfection levels (Supplementary Figure S1). In contrast, the majority of chemokines analyzed exhibited dramatic increases in the control animals compared with the survivors. Monokine induced by IFN-γ, MIF, MIP-1α, MIP-1β, MCP-1, IP-10, ITAC, and eotaxin all reached significantly greater peak levels than the survivors late during infection (Figure 1D), although RANTES, MDC, and IL-8 did not (Supplementary Figure S2). Although the levels of some growth factors, namely bFGF, VEGF, and GM-CSF, increased in surviving and control animals, no significant differences were observed between the 2 groups (Supplementary Figure S3).
The treated nonsurvivors exhibited relatively modest increases, if any, in cytokine levels up to the late time points (Figure 2B–D, Supplementary Figure S4, Supplementary Table S2), despite high levels of viremia (Figure 2A). Remarkably, however, TNF-α, IFN-γ, IL-1RA, IL-6, IL-15, MIG, MIF, MIP-1α, MIP-1β, MCP-1, IP-10, ITAC, and eotaxin (Figure 2B–D), as well as IL-2, IL-1β, IL-8, HGF, VEGF, GM-CSF, and G-CSF (Supplementary Figures S1–S3) increased dramatically at the terminal time points, reaching peak levels that were significantly higher than those observed in the surviving animals at late time points and, in many cases, higher than what was observed in the control animals.
DISCUSSION
The uncontrolled overexpression of pro- and anti-inflammatory cytokines is a hallmark of EVD and is closely associated with severe disease and fatal outcomes in both NHPs and humans [4]. In general, our data are consistent with previous reports of cytokine expression during EBOV infection [5–9, 12–15, 19], demonstrating a much more robust mixed inflammatory response in nonsurviving animals compared with animals that received antibody treatment and survived.
In the control animals, particularly high levels of IL-6, as well as numerous chemokines, were observed, suggesting a highly inflammatory environment. In contrast, significant and compensatory upregulation of certain anti-inflammatory cytokines, including IL-1RA and IL-10, was also observed, indicating the overall dysregulation of the immune response [3]. Unlike other reports [6–8, 13–15, 19], we observed no significant changes in TNF-α levels in control animals, although treated, nonsurviving animals did show a significant upregulation at the terminal stage. Increased TNF-α expression has been correlated with lethal EVD in humans [6–8, 15] and some NHP studies [13, 14, 19]; however, not every study shows consistent increases in the expression of this cytokine [12], suggesting that it may not be a uniform marker of severe disease. There was also a significant increase in IFN-γ expression in both surviving and nonsurviving animals, perhaps reflecting the activation of a protective cytotoxic T-cell response in survivors and the activation of a deleterious proinflammatory/proapoptotic response in nonsurvivors [4]. The role that growth factors play in the immune response to EBOV infection remains unclear, because only moderate increases in a few factors were observed in control animals, which is in line with some studies and in conflict with others [5, 8, 12].
We were intrigued to find that the majority of analyzed cytokines showed significant upregulation in the animals that were treated with an antibody cocktail but did not survive. In almost every case, the level of each cytokine peaked dramatically at the terminal stage (days 9–11), reaching levels significantly higher than what was observed in the survivors and occasionally higher than what was seen in the controls. Although it is unclear why treatment was unsuccessful in these animals, we hypothesize that their extended disease course—likely a result of antibody treatment—permitted more time for the cytokine response to increase in magnitude. These data also once again demonstrate that high levels of pro- and anti-inflammatory cytokines are associated with poor outcomes during EVD. It is curious that virus RNA levels in the blood of these animals were very similar to the controls late during infection, yet no appreciable cytokine response was observed at this time point. The reasons for this are unclear and remain the subject of future investigation.
Unlike the nonsurviving animals, surviving animals exhibited little change in the majority of their cytokine profiles over the course of infection. We hypothesize that, in these animals, the antibody treatment, which was initiated between 3 and 5 DPI, held virus replication in check long enough for an appropriate immune response to develop. Indeed, previous work has demonstrated that EBOV-infected NHPs treated with the monoclonal antibody cocktail ZMab survive and mount a robust immune response that protects against subsequent reinfection [20]. Some evidence of this immune response may be found in the levels of a few cytokines, namely, IL-1RA, IL-6, and ITAC, which increased late during infection but decreased again during convalescence, indicating a well controlled immune response. Likewise, TNF-α, IFN-γ, IL-4, IL-12, and IL-15 increased in expression at the convalescent stage, perhaps indicative of a balanced and protective T-cell response.
A key caveat to the present study is that our data reflect a retrospective analysis of both treated and untreated NHPs from 3 separate efficacy studies of anti-EBOV antibody cocktails, with each efficacy study using a different therapeutic and a distinct dosing regimen. With this study, we sought to investigate the differences in cytokine profiles between animals that survived EBOV infection and animals that did not survive. We believe that this is a valid comparison, even if some animals received treatment. This is similar to comparing cytokine profiles among human EVD patients, which many studies do, despite the fact that supportive treatments or experimental therapies are often used [5, 6, 8, 9]. In addition, we have supplied the cytokine profiles stratified by experimental group (Supplementary Figure S4), which demonstrate that variations in cytokine levels observed in our 3 groups—survivor, control, and treated nonsurvivor—are less than the variations observed between the 3 groups.
CONCLUSIONS
Overall, this study represents a thorough analysis of the cytokine responses observed in a total of 42 EBOV-infected NHPs, 14 of which succumbed to infection. Our data support the notion that the upregulation of pro- and anti-inflammatory cytokines is associated with a poor clinical outcome during EVD, although further studies of the cytokine response to EBOV in both humans and NHPs will be necessary to determine whether the NHP cytokine response is truly predictive of the human response. Moreover, to our knowledge, this is the first study to detail the cytokine response in a large number of animals treated with an anti-EBOV antibody therapeutic, which has revealed important details of the immune response in both surviving and treated, nonsurviving animals.
Supplementary Data
Supplementary materials are available at Open Forum Infectious Diseases online. Consisting of data provided by the authors to benefit the reader, the posted materials are not copyedited and are the sole responsibility of the authors, so questions or comments should be addressed to the corresponding author.
Acknowledgments
Author contributions. X. Q. and K. C. conceived the experiments described in the manuscript. V. S., W. Z., S. H., and K. C. performed the experiments. L. B. and V. S. performed the analysis. L. B., V. S., and X. Q. wrote the manuscript, which all authors approved.
Financial support. This work was funded by the Public Health Agency of Canada.
Potential conflicts of interest. All authors: No reported conflicts of interest. All authors have submitted the ICMJE Form for Disclosure of Potential Conflicts of Interest.
References
- 1. Ebola Situation Report - 30 March 2016. Available at: http://apps.who.int/ebola/current-situation/ebola-situation-report-30-march-2016. Accessed September 6, 2018. [Google Scholar]
- 2. Baseler L, Chertow DS, Johnson KM, et al. The pathogenesis of Ebola virus disease. Annu Rev Pathol 2017; 12:387–418. [DOI] [PubMed] [Google Scholar]
- 3. Wong G, Kobinger GP, Qiu X. Characterization of host immune responses in Ebola virus infections. Expert Rev Clin Immunol 2014; 10:781–90. [DOI] [PubMed] [Google Scholar]
- 4. Bixler SL, Goff AJ. The role of cytokines and chemokines in filovirus infection. Viruses 2015; 7:5489–507. [DOI] [PMC free article] [PubMed] [Google Scholar]
- 5. Wauquier N, Becquart P, Padilla C, et al. Human fatal zaire ebola virus infection is associated with an aberrant innate immunity and with massive lymphocyte apoptosis. PLoS Negl Trop Dis 2010; 4:10. pii:e837. doi:10.1371/journal.pntd.0000837 [DOI] [PMC free article] [PubMed] [Google Scholar]
- 6. Baize S, Leroy EM, Georges AJ, et al. Inflammatory responses in Ebola virus-infected patients. Clin Exp Immunol 2002; 128:163–8. [DOI] [PMC free article] [PubMed] [Google Scholar]
- 7. Villinger F, Rollin PE, Brar SS, et al. Markedly elevated levels of interferon (IFN)-gamma, IFN-alpha, interleukin (IL)-2, IL-10, and tumor necrosis factor-alpha associated with fatal Ebola virus infection. J Infect Dis 1999; 179(Suppl 1):S188–91. [DOI] [PubMed] [Google Scholar]
- 8. Kerber R, Krumkamp R, Korva M, et al. Kinetics of soluble mediators of the host response in Ebola virus disease. J Infect Dis 2018; 218:496–503. [DOI] [PMC free article] [PubMed] [Google Scholar]
- 9. McElroy AK, Harmon JR, Flietstra TD, et al. Kinetic analysis of biomarkers in a cohort of US patients with Ebola virus disease. Clin Infect Dis 2016; 63:460–7. [DOI] [PMC free article] [PubMed] [Google Scholar]
- 10. Bente D, Gren J, Strong JE, Feldmann H. Disease modeling for Ebola and Marburg viruses. Dis Model Mech 2009; 2:12–7. [DOI] [PMC free article] [PubMed] [Google Scholar]
- 11. Geisbert TW, Strong JE, Feldmann H. Considerations in the use of nonhuman primate models of Ebola virus and Marburg virus infection. J Infect Dis 2015; 212(Suppl 2):S91–7. [DOI] [PMC free article] [PubMed] [Google Scholar]
- 12. Ebihara H, Rockx B, Marzi A, et al. Host response dynamics following lethal infection of rhesus macaques with Zaire ebolavirus. J Infect Dis 2011; 204(Suppl 3):S991–9. [DOI] [PMC free article] [PubMed] [Google Scholar]
- 13. Geisbert TW, Hensley LE, Larsen T, et al. Pathogenesis of Ebola hemorrhagic fever in cynomolgus macaques: evidence that dendritic cells are early and sustained targets of infection. Am J Pathol 2003; 163:2347–70. [DOI] [PMC free article] [PubMed] [Google Scholar]
- 14. Hensley LE, Young HA, Jahrling PB, Geisbert TW. Proinflammatory response during Ebola virus infection of primate models: possible involvement of the tumor necrosis factor receptor superfamily. Immunol Lett 2002; 80:169–79. [DOI] [PubMed] [Google Scholar]
- 15. Ruibal P, Oestereich L, Lüdtke A, et al. Unique human immune signature of Ebola virus disease in Guinea. Nature 2016; 533:100–4. [DOI] [PMC free article] [PubMed] [Google Scholar]
- 16. Bornholdt ZA, Herbert AS, Mire CE, et al. A two-antibody pan-Ebolavirus cocktail confers broad therapeutic protection in ferrets and nonhuman primates. Cell Host Microbe 2019; 25:49–58.e5. [DOI] [PMC free article] [PubMed] [Google Scholar]
- 17. Brannan JM, He S, Howell KA, et al. Post-exposure immunotherapy for two ebolaviruses and Marburg virus in nonhuman primates. Nat Commun 2019; 10:105. [DOI] [PMC free article] [PubMed] [Google Scholar]
- 18. Wang H, Wong G, Zhu W, et al. Equine -origin immunoglobulin fragments protects nonhuman primates from Ebola virus disease. J Virol 2018. doi: 10.1128/JVI.01548-18 [DOI] [PMC free article] [PubMed] [Google Scholar]
- 19. Madelain V, Baize S, Jacquot F, et al. Ebola viral dynamics in nonhuman primates provides insights into virus immuno-pathogenesis and antiviral strategies. Nat Commun 2018; 9:4013. [DOI] [PMC free article] [PubMed] [Google Scholar]
- 20. Qiu X, Audet J, Wong G, et al. Sustained protection against Ebola virus infection following treatment of infected nonhuman primates with ZMAb. Sci Rep 2013; 3:3365. [DOI] [PMC free article] [PubMed] [Google Scholar]
Associated Data
This section collects any data citations, data availability statements, or supplementary materials included in this article.