

Abstract
Drug transporter expression and function at the blood-brain barrier is altered in Alzheimer’s disease (AD). However, the impact of AD on the expression of transporters and metabolizing enzymes in peripheral tissues has received little attention. The current study evaluated the expression of drug transporters and metabolizing enzymes in the small intestine and liver from 8-9-month-old female wild-type (WT) and APPswe/PSEN1dE9 (APP/PS1) transgenic mice, a widely-used AD model, using a quantitative targeted absolute proteomics (QTAP) approach. Furthermore, the general morphological appearance of the liver was assessed by immunohistochemistry, and lipid content was visualized using Oil Red O staining. The small intestines of APP/PS1 mice exhibited a significant 2.3-fold increase in multidrug resistance associated protein 2 (Mrp2), a 1.9-fold decrease in monocarboxylate transporter 1 (Mct1), and a 3.6-fold increase in UDP-glucuronosyltransferase (Ugt) 2b5 relative to those from WT mice based on QTAP analysis. While the liver from APP/PS1 mice exhibited no changes in drug transporter expression, there was a 1.3-fold elevation in cytochrome P450 (Cyp) 51a1 and a 1.2-fold reduction in Cyp2c29 protein expression, and this was associated with morphological alterations including accumulation of hepatocyte lipids. These studies are the first to demonstrate that the protein expression of transporters and metabolizing enzymes important in oral drug absorption are modified in a mouse model of familial AD, which may lead to altered disposition of some orally-administered drugs in AD.
Keywords: Alzheimer’s disease, small intestine, liver, drug transporters, drug metabolizing enzymes
Graphical Abstract
INTRODUCTION
Alzheimer’s disease (AD) is the leading cause of dementia and it is predicted that by 2050, one person will be diagnosed with this disorder every 33 seconds1. As AD is an age-related disorder, individuals with AD are often afflicted with various comorbidities including hypertension, congestive heart failure, musculoskeletal disorders and pain, and frequently are prescribed multiple medicines to help manage these conditions. A recent report suggests that patients with AD are often taking more medicines than age- and sex-matched controls2. There are multiple reasons for the large number of medicines prescribed for non-AD conditions in this population, including the use of medicines to combat side effects from medicines used to treat dementia symptoms. For example, cholinesterase inhibitors used for AD are often associated with urinary incontinence3, which can lead to the prescribing of anticholinergic drugs to manage the incontinence4. Another class of drugs commonly prescribed to individuals with AD is antidepressants; one study reported that the prevalence of antidepressant use was up to three times higher in community-dwelling individuals with AD relative to those without AD5. Dosing regimens of these medicines for individuals with AD are based on dosages prescribed to individuals without AD. However, such an approach assumes that the processes governing absorption, distribution, metabolism and excretion (ADME) of medicines are not affected by AD, an assumption that has not been confirmed with experimental evidence.
Since AD is a disease affecting the brain, altered expression of drug transporters (and perhaps drug metabolizing enzymes) at the blood-brain barrier (BBB) may be expected; these changes may affect the CNS exposure of drugs in this disorder. Decreased BBB expression of P-glycoprotein (P-gp) has been reported in both mouse models of AD6, 7 and in humans with AD8. Other studies have demonstrated that the BBB expression of breast cancer resistance protein (Bcrp) is significantly increased in a mouse model of AD and in brain samples obtained from individuals with AD9. Such changes in drug transporter expression are expected to result in altered CNS exposure of substrates, and indeed, increased brain distribution of 11C-verapamil (a substrate of P-gp) has been reported in individuals with AD relative to healthy age-matched controls10. In addition to these reported changes to the BBB, it is becoming apparent that alterations in peripheral organs occur in AD, which may have an impact on the expression of drug transporters and drug metabolizing enzymes. For example, elevated plasma levels of inflammatory mediators have been observed in AD11, and as inflammatory mediators can modify transporter expression12 it is possible that peripheral organ transporter expression may also be affected in AD. To support this hypothesis, there has been one study assessing the expression of some drug metabolizing enzymes in the liver of 20-month-old Tg2576 mice (a mouse model of familial AD)13. While this study did report modified expression of drug metabolizing enzymes, the impact of AD on drug transporters, a family of proteins that significantly impact drug disposition14, has not been assessed.
Despite a clear need to understand the impact of AD on drug disposition, there appears to be only one report that demonstrates a difference in drug disposition between people with and without AD. In this study, the same dose of oral rivastigmine resulted in plasma concentrations that were 30-50% higher in people with AD relative to age-matched healthy volunteers; however, this was not related to differences in rivastigmine metabolic capacity15, suggesting that a change in drug transporter expression or function may be responsible for this observation. A more recent preclinical study confirmed that systemic drug disposition is indeed altered in a mouse model of familial AD. Following oral administration of PBT2, a preclinical drug candidate for AD, to wild-type (WT) and Tg2576 mice, the plasma concentrations of PBT2 were 60% lower in Tg2576 mice relative to age-matched WT mice16. Taken together, these clinical and preclinical data suggest that disposition of orally-administered medicines may be altered in AD. For this reason, the purpose of this study was to assess the expression of a series of drug transporters and metabolizing enzymes in the small intestine and liver of 8-9-months-old female APP/PS1 mice and their age-matched littermate WT mice. APP/PS1 mice are a model of AD that express a chimeric mouse/human amyloid precursor protein (Mo/HuAPP695swe) and a mutant human presenilin 1 (PS1-dE9), and have been reported by multiple laboratories to exhibit the pathologies associated with AD, including brain accumulation of amyloid beta (Aβ) (the main pathological hallmark of AD) and cognitive dysfunction at 8-9 months old17-19.
Quantitative transporter absolute proteomics (QTAP), an approach used extensively to quantify alterations to drug-handling proteins, was utilized to measure the expression of key drug transporters and metabolizing enzymes20, 21. The general morphological appearance of the liver and the impact of disease on hepatic lipidosis was also assessed, given that initial QTAP studies suggested that pathways involved in lipid metabolism were affected in APP/PS1 mice. These studies are considered significant and of importance to the pharmaceutical sciences and clinical therapeutics because they provide insight into the impact of AD on proteins critical in drug disposition. This information is necessary to determine whether dosing regimen modifications are required for the multiple medicines prescribed to individuals with AD.
MATERIALS AND METHODS
Materials.
Acetonitrile, ethylenediaminetetraacetic acid (EDTA), dithiothreitol (DTT), formalin, formic acid, phenylmethylsulfonyl fluoride (PMSF), phosphate-buffered saline (PBS), paraformaldehyde (PFA) and protease inhibitor cocktail were purchased from Sigma-Aldrich (St. Louis, MO). Reaction buffer (10X), Discovery CC1, Discovery PSS diluent, Discovery OmniMap anti-Rb HRP (RUO), OmniMap DAB anti-Rb detection kit, Hematoxylin II counterstain reagent, hydrogen peroxide, and Bluing reagent were purchased from Ventana Medical Systems (Tucson, AZ). Oil Red O stain kit was sourced from American MasterTech (Lodi, CA).
Animals.
Animal experiments were approved by the Monash Institute of Pharmaceutical Sciences Animal Ethics Committee (MIPS.2011.39) and performed in accordance with the National Health and Medical Research Council guidelines for the care and use of animals for scientific purposes. Female APP/PS1 (B6C3-Tg(APPswe,PSEN1dE9)85Dbo/Mmjax) and age-matched littermate wildtype (WT) mice were obtained from Jackson Laboratories at 2-3 months of age and were housed with ad libitum access to standard rodent chow and water until 8-9 months of age.
Preparation of microsomal and plasma membrane fractions of mouse small intestine and liver tissues.
Small intestine and liver were removed from 8-9 month old WT and APP/PS1 mice, immediately snap frozen and stored at −80°C. The subsequent sample preparation was performed at 4°C. The fractions of small intestinal epithelial cells were prepared according to the previously reported method21 with minor modifications. Briefly, the small intestine tissues were dissected into ~1cm pieces and incised. The incised tissues were agitated in phosphate-buffered saline (PBS) with 2 mM ethylenediaminetetraacetic acid (EDTA), 0.5 mM dithiothreitol (DTT), 1 mM phenylmethylsulfonyl fluoride (PMSF) and 1% (v/v) protease inhibitor cocktail for 1 hr. The suspension was passed through a 210 μm nylon mesh to remove the intestinal pieces, and the filtrate was centrifuged at 100,000 ×g for 40 min. The resulting pellet was collected as the small intestinal epithelial cell fraction. The liver tissues were dissected into pieces. Preparation of microsomal and plasma membrane fractions of small intestine epithelial cell fractions and liver tissues were carried out as reported previously22, 23. Briefly, the small intestinal epithelial cell fraction and the dissected liver tissues were homogenized in buffer containing 10 mM Tris-HCl (pH 7.4), 10 mM NaCl, 1.5 mM MgCl2, 1 mM phenylmethylsulfonyl fluoride (PMSF), and a protease inhibitor cocktail. The homogenates were centrifuged at 8,000 ×g for 10 min at 4°C and the supernatants were collected. They were centrifuged at 100,000 ×g for 60 min at 4°C, and the pellets were obtained as the microsomal membranes. The pellets were suspended in 10 mM Tris–HCl (pH 7.4), 250 mM sucrose, layered on top of a 38% (w/v) sucrose solution, and centrifuged at 100,000 ×g for 40 min at 4°C. The turbid layer at the interface was recovered to obtain the plasma membrane fraction. All membrane fractions were stored at −80°C prior to analysis.
Quantitative targeted absolute proteomics.
Trypsin- and lysylendopeptidase-treated peptide samples of microsomal and plasma membrane fractions for each tissue were prepared as reported previously24. Simultaneous protein quantitation of target molecules was performed using the cHiPLC nanoflex and nano-LC system (Eksigent Technologies, Dublin CA)-Triple TOF 5600 with parallel reaction monitoring (PRM) according to the previously reported method23 with the following modifications. The peptide samples (1 μg protein) were loaded onto a trap column (200 μm × 6 mm, ReproSil-Pur 3μm, C18-AQ 120Å) (Eksigent Technologies, Dublin, CA) and separated by an analytical column (75 μm × 15 cm, ReproSil-Pur 3μm, C18-AQ 120Å) (Eksigent Technologies, Dublin, CA). The flow rates were set to 2 μL/min and 300 nL/min on the trap column and the analytical column, respectively. The mobile phases used for separation were A = 0.1% v/v formic acid in Milli-Q water and B = 0.1% v/v formic acid in 100% v/v acetonitrile. The peptides were eluted in 0-40% B (0-40 min), 40-100% B (40-41 min), 100% B (41-50 min), and 0% B (50-80 min). The parallel reaction monitoring (PRM) transitions for the quantification of each targeted peptide are shown in Supporting Information Table S1. The values of the mean of the protein expression levels were calculated from the values in 1-4 set(s) of selected reaction monitoring/multiple reaction monitoring (SRM/MRM) transitions. The total protein was determined by Lowry protein assay (Bio-rad, Hercules, CA). The protein expression (expressed as fmol/μg protein) in the WT mice was plotted against that in APP/PS1 mice on a logarithmic scale.
Immunohistochemical analysis.
WT and APP/PS1 mice (8-9 months old) were perfused transcardially with 20 mL of 4% (w/v) PFA at 2 mL/min under anesthesia (intraperitoneal ketamine/xylazine injection). The liver was carefully removed from the mice after PFA fixation, and placed in 30% w/v sucrose overnight, and stored at −80°C. Livers were embedded in Tissue-Tek O.C.T Compound (VWR International, Radnor, PA) and snap-frozen before being cryosectioned and placed onto Fisherbrand™ ProbeOn™ slides (Fisher Scientific, Hampton, NH). Slides were allowed to air dry for approximately 30 min after being placed in acetone for 2 min, and then slides were left to dry for 10 min. The slides were put into 1X Reaction buffer (a tris based buffer, pH 7.6 ± 0.2) for 10 min, transferred to 10% (w/v) formalin in 1X Reaction buffer for 5 min, and then rinsed with 1X Reaction buffer. The liver slices were used either for immunostaining of P-gp to provide insight into architecture of hepatocytes (given its known localization to the canalicular membranes) or Oil red O staining for evaluation of lipid content. For P-gp immunostaining, the slides underwent an antigen retrieval with Discovery CC1 (an EDTA based buffer, pH 8.5) for 8 min at 65 °C followed by blocking with Rodent Decloaker 10X (Biocare Medical, Pacheco, CA) for 1 hr at room temperature. The samples were then blocked with 10% v/v hydrogen peroxidase for 12 min at room temperature and then incubated in primary antibody against P-gp (Abcam ab170904), which was diluted 1:100 in Discovery PSS Diluent (a tris based diluent) for 1 hr at room temperature. For secondary antibody incubation, the slides were incubated in Discovery OmniMap anti-Rb HRP (RUO) for 32 min at room temperature. The samples were treated with 3,3’-diaminobenzidine (DAB) from OmniMap DAB anti-Rb detection kit and Hematoxylin II counterstain reagent for 12 min, followed by a 4 min treatment with Bluing reagent. The slide staining was performed using Ventana’s Discovery Ultra Automated IHC staining system (Ventana Medical Systems, Tucson, AZ). In order to demonstrate lipid accumulation in the liver slices (given QTAP data suggested altered expression of hepatic enzymes involved in hepatocellular lipid metabolism), an Oil Red O stain kit was employed. Briefly, the liver slides were immersed in propylene glycol for 2 min prior to incubation with Oil Red O stain at 60 °C for 6 min, immersed in 85% v/v propylene glycol in distilled water for 1 min and rinsed by distilled water twice. The slides were treated with modified Mayer’s hematoxylin for 1 min, followed by a thorough rinse with running tap water (1 min) and distilled water (1 min). Micromount (Leica Biosystems, Buffalo Grove, IL) was used to facilitate coverslipping. Slides were scanned in the Aperio ScanScope FL (Leica Biosystems) using a 20x objective. Image files were processed with Aperio ImageScope v12.3.1.6002 (Leica Biosystems).
Statistical analysis.
All data are expressed as mean ± SD. Data analyses were performed using Prism software (GraphPad, La Jolla, CA). To determine statistical significance of the mean difference of protein expression levels between WT and APP/PS1 mice, Student’s t-tests were performed. Statistical significance was set as p<0.05.
RESULTS
APP/PS1 mice exhibited altered intestinal expression of drug transporters and drug metabolizing enzymes.
The intestinal expression of drug transporters and enzymes were screened using a QTAP approach in plasma membrane and cytoplasmic fractions, respectively. The expression of each of the transporters from plasma membrane and cytoplasmic fractions is provided in Table 1 and graphically presented in Figure 1. At the plasma membrane of the intestinal epithelial cells, APP/PS1 mice exhibited a 2.3-fold increase in the expression of multidrug resistance associated protein 2 (Mrp2) (p=0.02) and a reduction in the expression of other transporters including a 1.9-fold decrease in monocarboxylate transporter 1 (Mct1) (p=0.02), a 2-fold decrease in 4F2 cell-surface antigen heavy chain (4F2hc) (p=0.01) and large amino acid transporter 2 (Lat2) (p=0.02), and a 1.4-fold decrease in transferrin 1 receptor (Trf1) (p=0.01) (Figure 1A). The cytoplasmic fraction from small intestinal tissue was also assessed by QTAP. Of all the relevant metabolizing enzymes, APP/PS1 mice exhibited a 3.6-fold increase in the expression of Ugt2b5 (p=0.04), and there was a trend towards an increase in Ugt1a1 (p=0.06) (Figure 1B).
Table 1.
Protein expression of transporters and enzymes in the WT and APP/PS1 mouse intestine.
| Protein | WT | APP/PS1 | Ratio of Tg/WT | p value |
|---|---|---|---|---|
| Mean ± S.D. (fmol/μg protein) |
Mean ± S.D. (fmol/μg protein) |
|||
| Plasma membrane | ||||
| Abc transporters | ||||
| Mdr1a | 10.53 ± 1.27 | 11.55 ± 2.86 | 1.10 | 0.60 |
| Mrp2 | 2.04 ± 0.53 | 4.59 ± 1.25 | 2.25* | 0.03 |
| Mrp3 | 5.16 ± 1.95 | 3.35 ± 0.44 | 0.65 | 0.19 |
| Mrp4 | 0.08 ± 0.05 | 0.06 ± 0.04 | 0.82 | 0.72 |
| Mrp6 | 0.53 ± 0.16 | 0.32 ± 0.12 | 0.60 | 0.13 |
| Bcrp | 3.33 ± 0.16 | 4.21 ± 1.07 | 1.26 | 0.23 |
| Abcg5 | 1.94 ± 0.03 | 2.32 ± 0.28 | 1.19 | 0.08 |
| Abcg8 | 1.45 ± 0.23 | 1.66 ± 0.12 | 1.15 | 0.23 |
| Slc transporters | ||||
| Asct2 | 3.33 ± 1.55 | 1.58 ± 0.42 | 0.48 | 0.13 |
| Sglt1 | 32.02 ± 6.04 | 24.67 ± 7.06 | 0.77 | 0.24 |
| Sglt2 | 0.19 ± 0.04 | 0.23 ± 0.07 | 1.19 | 0.47 |
| 4F2hc | 79.32 ± 15.38 | 41.28 ± 1.87 | 0.52* | 0.01 |
| Taut | 1.13 ± 0.46 | 0.85 ± 0.18 | 0.75 | 0.37 |
| Lat2 | 20.62 ± 4.71 | 10.13 ± 1.44 | 0.49* | 0.02 |
| Mct1 | 23.90 ± 4.35 | 12.79 ± 2.40 | 0.54* | 0.02 |
| Slc22a18 | 3.71 ± 0.14 | 3.10 ± 2.06 | 0.83 | 0.63 |
| Ata2 | 0.28 ± 0.07 | 0.26 ± 0.04 | 0.93 | 0.70 |
| Mate1 | 0.05 ± 0.00 | 0.06 ± 0.01 | 1.10 | 0.41 |
| Ostb | 2.63 ± 2.07 | 0.84 ± 0.78 | 0.32 | 0.23 |
| Oatp2b1 | 0.52 ± 0.04 | 0.43 ± 0.12 | 0.83 | 0.28 |
| Receptors | ||||
| Lrp1 | 0.34 ± 0.15 | 0.13 ± 0.10 | 0.39 | 0.12 |
| Tfr1 | 3.49 ± 0.31 | 2.50 ± 0.24 | 0.72* | 0.01 |
| Marker proteins | ||||
| Villin-1 | 13.92 ± 4.81 | 11.90 ± 3.15 | 0.86 | 0.58 |
| γ-Gtp | 5.24 ± 0.92 | 5.46 ± 1.07 | 1.04 | 0.80 |
| Na/K ATPase | 385.59 ± 56.29 | 242.47 ± 25.32 | 0.63* | 0.02 |
| Cytoplasmic fraction | ||||
| Enzyme | ||||
| Cyp2c29 | 0.29 ± 0.15 | 1.00 ± 0.75 | 3.50 | 0.30 |
| Cyp2d22 | 1.45 ± 0.34 | 1.60 ± 0.57 | 1.10 | 0.72 |
| Cyp3a11 | 7.68 ± 2.42 | 9.88 ± 7.05 | 1.29 | 0.64 |
| Cyp51a1 | 0.50 ± 0.41 | 0.28 ± 0.34 | 0.56 | 0.51 |
| Ugt1a1 | 19.75 ± 1.99 | 24.36 ± 2.44 | 1.23 | 0.06 |
| Ugt1a9 | 0.89 ± 0.22 | 1.30 ± 0.24 | 1.46 | 0.10 |
| Ugt2a3 | 14.04 ± 4.23 | 13.35 ± 5.41 | 0.95 | 0.87 |
| Ugt2b5 | 0.93 ± 0.63 | 3.30 ± 1.28 | 3.56 | 0.04 |
| NADPH | 8.56 ± 1.87 | 13.81 ± 3.08 | 1.61 | 0.07 |
| Marker proteins | ||||
| Na/K ATPase | 198.90 ± 26.92 | 172.39 ± 10.61 | 0.87 | 0.19 |
| γ-Gtp | 9.85 ± 0.54 | 9.81 ± 1.14 | 1.00 | 0.96 |
indicates a significant difference in expression between WT and APP/PS1 mice (p<0.05, n=3).
Figure 1.


Comparison of protein expression levels of (A) drug transporters in the plasma membrane fraction and (B) drug metabolizing enzymes in the cytoplasmic fraction of small intestines isolated from 8-9-month-old WT and APP/PS1 mice (n=3 animals). The top (green) and bottom (red) dashed lines represent a 2-fold upregulation or downregulation in protein expression, respectively, in APP/PS1 mice compared to WT mice. Data are presented as mean ± SD, with statistically significant upregulation or downregulation in APP/PS1 mice denoted by a green or red data point, respectively, with p<0.05 (Student’s t-test; WT vs. APP/PS1 mice).
APP/PS1 mice exhibit altered hepatic Cyp51a1 and Cyp2c29 expression and fatty liver.
The expression of transporter proteins and enzymes in the hepatic plasma membrane and cytoplasmic fractions, respectively, was also screened using QTAP. The expression of each of the transporters from plasma membranes and cytoplasmic fractions is provided in Table 2 and graphically in Figure 2. Unlike the small intestine, there was no significant difference in the expression of any of the transporters screened between APP/PS1 mice and WT mice (Figure 2A). In contrast, a 1.3-fold increase in Cyp51a1 (p=0.05), and a 1.2-fold decrease in Cyp2c29 (p=0.03), was observed in APP/PS1 mice relative to WT mice (Figure 2B). Immunohistochemical analysis of livers from WT and APP/PS1 mice was also undertaken to identify possible mislocalization of the important drug transporter P-gp. No obvious difference in P-gp expression/localization was identified between the livers from WT and APP/PS1 mice. As shown in Figure 3A and 3B, hepatocytes from WT mice exhibited the expected shape and staining of nuclei, whereas those of APP/PS1 mice appeared to have asymmetrical nuclei and numerous small vacuoles containing lipids based on Oil Red O staining compared to WT mice (Figure 3C and 3D).
Table 2.
Protein expression of transporters and enzymes in the WT and APP/PS1 mouse liver.
| Protein | WT | APP/PS1 | Ratio of Tg/WT | p value |
|---|---|---|---|---|
| Mean ± S.D. (fmol/μg protein) |
Mean ± S.D. (fmol/μg protein) |
|||
| Plasma membrane | ||||
| Abc transporters | ||||
| Abca8b | 1.86 ± 0.45 | 1.75 ± 0.09 | 1.06 | 0.65 |
| Mdr1a | 1.09 ± 0.22 | 1.39 ± 0.21 | 0.78 | 0.13 |
| Mdr2 | 4.46 ± 0.71 | 3.93 ± 0.49 | 1.14 | 0.29 |
| Bsep | 20.25 ± 4.96 | 19.40 ± 1.70 | 1.04 | 0.76 |
| Mrp1 | 0.14 ± 0.03 | 0.11 ± 0.03 | 1.32 | 0.20 |
| Mrp2 | 19.77 ± 3.46 | 18.60 ± 2.70 | 1.06 | 0.63 |
| Mrp3 | 4.97 ± 0.77 | 4.90 ± 0.90 | 1.01 | 0.93 |
| Mrp4 | 0.34 ± 0.07 | 0.43 ± 0.07 | 0.79 | 0.16 |
| Mrp6 | 8.22 ± 0.71 | 8.74 ± 0.34 | 0.94 | 0.25 |
| Bcrp | 4.11 ± 0.37 | 4.87 ± 0.66 | 0.84 | 0.14 |
| Abcg5 | 1.44 ± 0.37 | 1.45 ± 0.37 | 0.99 | 0.98 |
| Abcg8 | 1.76 ± 0.37 | 1.83 ± 0.48 | 0.96 | 0.85 |
| Slc transporters | ||||
| Ata2 | 0.26 ± 0.09 | 0.22 ± 0.11 | 1.19 | 0.61 |
| Glut1 | 0.43 ± 0.17 | 0.37 ± 0.06 | 1.17 | 0.59 |
| Taut | 1.13 ± 0.18 | 0.89 ± 0.17 | 1.27 | 0.13 |
| Bgt1 | 10.98 ± 2.97 | 10.55 ± 2.13 | 1.04 | 0.83 |
| Ntcp | 62.59 ± 16.35 | 57.28 ± 8.20 | 1.09 | 0.59 |
| Mct1 | 29.79 ± 4.87 | 26.07 ± 1.98 | 1.14 | 0.22 |
| Oct1 | 4.43 ± 1.18 | 4.02 ± 0.97 | 1.10 | 0.64 |
| Nat | 21.84 ± 1.56 | 17.48 ± 3.83 | 1.25 | 0.13 |
| Oat2 | 2.27 ± 1.04 | 1.13 ± 0.14 | 2.01 | 0.13 |
| Mate1 | 0.34 ± 0.03 | 0.37 ± 0.08 | 0.90 | 0.49 |
| Oatp1a4 | 8.13 ± 2.07 | 7.96 ± 0.81 | 1.02 | 0.89 |
| Oatp1b2 | 11.77 ± 2.45 | 12.06 ± 1.54 | 0.98 | 0.85 |
| Oatp2b1 | 8.70 ± 2.18 | 7.33 ± 0.49 | 1.19 | 0.26 |
| Receptors | ||||
| Tfr1 | 0.59 ± 0.12 | 0.68 ± 0.14 | 0.86 | 0.41 |
| Lrp1 | 2.43 ± 0.36 | 2.35 ± 0.06 | 1.04 | 0.66 |
| Markers (plasma membrane) | ||||
| Na/K ATPase | 65.40 ± 13.30 | 59.53 ± 6.76 | 1.10 | 0.47 |
| γ-Gtp | 0.11 ± 0.08 | 0.08 ± 0.04 | 1.43 | 0.55 |
| Cytoplasmic fraction | ||||
| Enzymes | ||||
| Cyp1a2 | 15.10 ± 1.68 | 17.29 ± 1.20 | 0.87 | 0.14 |
| Cyp2c29 | 60.39 ± 1.31 | 71.60 ± 5.73 | 0.84* | 0.03 |
| Cyp2d22 | 10.90 ± 0.98 | 12.54 ± 2.19 | 0.87 | 0.30 |
| Cyp2e1 | 40.03 ± 3.78 | 43.91 ± 7.23 | 0.91 | 0.46 |
| Cyp3a11 | 14.56 ± 3.95 | 14.28 ± 5.71 | 1.02 | 0.95 |
| Cyp51a1 | 4.92 ± 0.42 | 3.72 ± 0.61 | 1.32* | 0.05 |
| Cyp8b1 | 3.15 ± 0.16 | 2.39 ± 0.60 | 1.31 | 0.10 |
| Ugt1a1 | 58.00 ± 7.44 | 66.89 ± 6.34 | 0.87 | 0.19 |
| Ugt1a9 | 10.71 ± 1.11 | 10.62 ± 0.90 | 1.01 | 0.91 |
| Ugt2a3 | 45.12 ± 14.27 | 49.39 ± 9.52 | 0.91 | 0.69 |
| Ugt2b5 | 50.40 ± 14.21 | 47.57 ± 1.51 | 1.06 | 0.75 |
| Ugt2b36 | 24.74 ± 1.91 | 24.05 ± 1.64 | 1.03 | 0.66 |
| NADPH | 32.23 ± 1.62 | 35.18 ± 5.88 | 0.92 | 0.45 |
| HMG-CoA reductase | 0.72 ± 0.09 | 0.74 ± 0.18 | 0.98 | 0.91 |
| Markers | ||||
| Na/K ATPase | 16.86 ± 1.96 | 16.28 ± 2.12 | 1.04 | 0.74 |
indicates a significant difference in expression between WT and APP/PS1 mice (p<0.05, n=3).
Figure 2.


Comparison of the protein expression levels of (A) drug transporters in the plasma membrane fraction and (B) drug metabolizing enzymes in the cytoplasmic fraction of hepatocytes isolated from 8-9-month-old WT and APP/PS1 mice (n=3 animals). The top (green) and bottom (red) dashed lines represent a 2-fold upregulation or downregulation in protein expression, respectively, in APP/PS1 mice compared to WT mice. Data are presented as mean ± SD, with statistically significant upregulation or downregulation in APP/PS1 mice denoted by a green or red data point, respectively, with p<0.05 (Student’s t-test; WT vs. APP/PS1 mice).
Figure 3.

Representative histological appearance of liver slices from 8-9-month-old WT (A) and APP/PS1 (B) mice, with hepatocyte nuclear staining in blue and canalicular P-gp staining in brown. Representative microphotograph of Oil Red O staining for the liver slices from 8-9-month-old WT (C) and APP/PS1 (D) mice, with elevated lipid accumulation observed in accordance with the extensive vacuolization detected in APP/PS1 mice.
DISCUSSION
Individuals with AD are prescribed multiple medicines (and in some cases more medicines than individuals without AD)2. However, a thorough understanding of how medicines are handled by the body in AD is completely lacking. If the disposition (i.e. ADME) of medicines is indeed altered in AD, but these medicines are prescribed using the same dosage regimens as in people without AD, then the plasma and/or tissue concentrations available to exert a therapeutic effect or cause toxicity may be altered. To this end, we evaluated the protein expression of key drug transporters and metabolizing enzymes in the liver and small intestines of APP/PS1 mice, a commonly used mouse model of familial AD. APP/PS1 mice are a well-characterized model exhibiting mutations in the human transgenes amyloid precursor protein (APP) and presenilin 1 (PS1) found in familial forms of AD which lead to brain parenchymal accumulation of amyloid-beta peptide. This brain parenchymal accumulation of Aβ is mainly detected in the cortical and hippocampal regions of the brain, as observed in human AD, and results in cognitive deficit similar to the human phenotype. This model is routinely used to assess many aspects of AD pathology, assessment of efficacy of potential therapeutics and disease progression, and is therefore used in this study as a representative model of AD25.
For the first time, we demonstrated that the expression of Mrp2 and Mct1 were significantly altered in the small intestine of APP/PS1 mice. Mrp2 or its human orthologue MRP2 is an ATP-binding cassette protein expressed at various biological membranes including the apical surface of enterocytes26, which is responsible for reducing the intestinal absorption of many substrates including methotrexate, etoposide, mitoxantrone, valsartan and various glucuronidated conjugates27. Although the present study only focussed on Mrp2 expression, and not function, it could be postulated that the oral absorption of drugs that are Mrp2 substrates may be decreased in AD, although functional studies are required to confirm this. Proteomic analysis demonstrated that in addition to increased Mrp2 expression, the expression of the small intestinal Phase II glucuronosyltransferase enzyme Ugt2b5 was increased 3.6-fold. These data are in line with suggestions that these two detoxifying systems (i.e. Mrp transporters and Ugt enzymes) are working in concert to reduce intestinal absorption27 (i.e. drugs may undergo increased glucuronidation in intestinal epithelial cells resulting in increased Mrp2-mediated efflux of the glucuronide metabolite). We also noted a trend in the elevation of Ugt1a1 in the small intestine of APP/PS1 mice compared to WT mice. Ugt1a1 is the only enzyme that can glucuronidate bilirubin28. Increased bilirubin has been observed in the cerebrospinal fluid of people with AD29. If this is reflective of increased plasma levels of bilirubin in AD, then the increased levels of Ugt1a1 and Mrp2 could provide a mechanism to conjugate more bilirubin and efflux bilirubin glucuronide30. The oral bioavailability of PBT2, a preclinical candidate assessed for its potential in AD, was found to be significantly reduced in a mouse model of AD, relative to WT mice16. PBT2 is an 8-hydroxyquinoline analogue and it is likely that this compound undergoes glucuronidation and subsequent efflux via intestinal Mrp2. It is possible, therefore, that the reduced oral absorption of PBT2 we previously reported in AD mice16 is a result of increased Mrp2-mediated efflux of the glucuronide metabolite, given that both intestinal Mrp2 and relevant glucuronosyltransferase enzymes are significantly enhanced in AD mice.
The mechanism responsible for the observed increase in small intestinal Mrp2 protein expression can only be speculated at this stage. While many diseases are associated with reduced MRP2 expression such as hepatic failure and diabetes31, intestinal MRP2 expression and function have been reported to be increased by the inflammatory cascade associated with intestinal infections32. APP/PS1 mice exhibit increased pro-inflammatory markers in their small intestinal lumen33. Thus, it is possible that the increased intestinal Mrp2 expression we observed in APP/PS1 mice is a result of AD-associated intestinal inflammation. Indeed, increased peripheral inflammation is a growing observation in AD, with elevations in plasma levels of interleukin-6 and tumour necrosis factor α being observed in humans with AD34,35. These observations support the utility of the APP/PS1 mice for this study, which also exhibit peripheral inflammation, and align with the hypothesis that peripheral inflammation may be linked to the observed alterations to transporter expression in the small intestine and liver. It has also been shown that the gut microbiota alters in APP/PS1 mice36, and therefore it is likely that intestinal β-glucuronidase activity may be altered in AD. If intestinal β-glucuronidase activity is altered in AD, this may also lead to increased glucuronidation and subsequent increase in MRP2 expression. Regardless of the mechanism, our finding of increased Mrp2 expression in the small intestine is considered a crucial modification in APP/PS1 mice, which has the potential to alter or reduce the oral absorption of both AD and non-AD medicines.
Monocarboxylate transporters (MCTs) play a major role in cell metabolism and metabolic communication between tissues37. Mct1 or its human orthologue MCT1 is a carrier of short-chain fatty acids, ketone bodies, lactate, and a few medicines in several tissues38. A significant reduction in Mct1 intestinal expression may decrease the absorption of some medicines including salicylic acid, and valproic acid39. Again, the rationale behind the observed decrease in small intestinal Mct1 protein expression can only be speculated. MCT1 protein expression is significantly reduced in humans with inflammatory bowel disease40, and therefore, AD-associated intestinal inflammation may contribute to the reduced intestinal expression of Mct1 observed in APP/PS1 mice37. 4F2hc is involved in guiding and targeting Lat2 (the large amino acid transporter) to the plasma membrane41. A 2-fold reduction in the expression of both 4F2hc and Lat2 was observed in the small intestine of APP/PS1 mice compared to WT mice. The reduction in Lat2 expression may lead to reduced large amino acid absorption as well as decreased intestinal absorption of Lat2 substrates, including L-dopa, alpha-methyldopa, melphalan, and gabapentin42. These observed changes in the small intestine of APP/PS1 mice are the first to be reported in AD. If similar changes occur in individuals with AD, the oral absorption of many drugs might be affected in this disease, resulting in either increased or decreased absorption depending on the affinity for different transporters. In addition to the changes in the expression of transporters in the small intestine, which may impact on intestinal permeability, other factors may also affect the overall bioavailability of orally-administered drugs in AD. For example, there are reports of increased intestinal permeability in human43 and decreased intestinal motility in AD mouse44, and these should be considered when predicting and assessing the impact of gastrointestinal modifications in AD on oral drug absorption processes. It should also be noted that there have been reports of altered expression profiles of other transporters at the BBB in mouse models of familial AD, including reduced expression of P-gp45, Glut-146, Lrp147, and increased expression of RAGE47. However, altered expression of these transporters was not observed in the small intestine of APP/PS1 mice, suggesting that AD may have different impact on transporter expression at these barriers.
While differences in the expression of membrane transporters were observed in the small intestine of APP/PS1 mice, no alterations in the expression of hepatic basolateral or canalicular membrane transporters were detected in APP/PS1 mice. This suggests that at least in this mouse model of AD, the hepatic uptake and hepatobiliary excretion of drugs is unlikely to be affected. Similarly, no changes in the expression of major drug metabolizing enzymes, such as Cyp1a2 and Cyp2e1, were observed in this mouse model. Van Ess et al. reported elevated Cyp2b, Cyp2e1, Cyp3a, and Cyp4a activity, as well as Cyp4a expression in 20-month-old Tg2576 (overexpressing a mutant form of amyloid precursor protein APPK670/671L)13. While the expression of Cyp enzymes was not altered in the current studies, Cyp activity was not assessed; thus, it is possible that function may be altered, as reported by Van Ess. Despite the lack of apparent changes to the expression of drug-metabolizing enzymes in the current study, a significant increase in the expression of hepatic Cyp51a1 and a significant reduction in the expression of Cyp2c29 were observed in APP/PS1 mice. Cyp51a1 is an enzyme involved in cholesterol metabolism that converts lanosterol to cholesterol precursors49. Therefore, increased Cyp51a1 would be expected to lead to increased cholesterol production. This is consistent with mounting evidence suggesting that the initiation and progression of AD is linked to aberrant cholesterol metabolism and inflammation50. Such an increase in Cyp51a1 expression could also be responsible for the accumulation of lipids in the hepatic vacuoles that was observed by immunohistochemistry. It is unlikely that such an increase in hepatic lipid content would result from increased intestinal absorption of lipids, given that both WT and APP/PS1 mice received the same diet. In fact, a lower body weight was identified for APP/PS1 mice compared to WT controls (supporting information, Figure S1). The increased expression of intestinal Ugt2b5 could also be attributed to the accumulation of lipids within the liver, given that a few studies have demonstrated increased Ugt expression and activity in fatty liver disease51. It should also be noted that the downregulation of intestinal Mct1 detected in the APP/PS1 mice may serve as a protective mechanism against the development of fatty liver, given Mct1 plays an essential role in the development of hepatic steatosis in mice fed a high fat diet38. A schematic diagram to explain these alterations and the potential impact of transporters and metabolizing enzymes on these hepatic alterations is provided in Figure 4.
Figure 4.

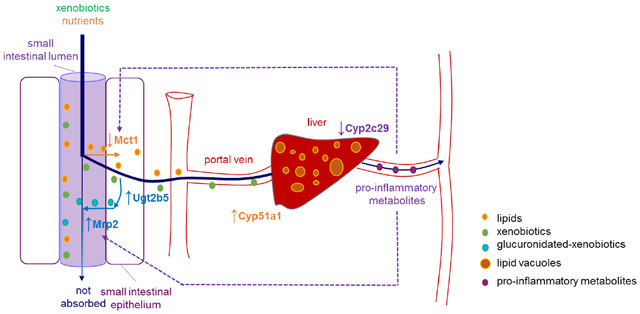
Schematic diagram summarizing the alterations in the small intestine and liver of APP/PS1 mice and the speculative outcomes. (1) Increased expression of Ugt2b5 and Mrp2 has the potential to lead to increased glucuronidation and Mrp2-mediated efflux of relevant substrates into the small intestine, resulting in reduced intestinal absorption. (2) Elevated hepatic Cyp51a1 can potentially increase cholesterol production, which may contribute to fatty liver disease (lipid vacuoles in the liver of APP/PS1 mice observed in the current study). (3) Decreased Cyp2c29 expression in the liver has the potential to make arachidonic acids preferentially converted to pro-inflammatory metabolites via COX and LOX pathways, leading to an increase in peripheral inflammation. (4) The downregulation of Mct1 expression observed in APP/PS1 mice is possibly a response to peripheral inflammation associated with AD, and the downregulation of Mct1 could be a protective mechanism to reduce the uptake of fatty acids into the enterocyte worsening the fatty liver. Downregulation of Mct1 may also lead to reduced oral absorption of drugs that are Mct1 substrates. (5) The increased expression of Mrp2 may be a result of elevated peripheral inflammation. Increased Mrp2 may lead to reduced intestinal absorption of drugs that are Mrp2 substrates.
These major changes associated with hepatic lipid accumulation are consistent with a very recent study demonstrating increased lipid levels in livers of APP/PS1 mice, including fatty acids and triglycerides52, and the suggestion that dysfunctional liver biosynthesis of essential fatty acids correlates with cognitive impairment in people with AD53. It has also been demonstrated that fatty liver disease is associated with lower cognitive performance independent of cerebrovascular disease and its risk factors54. Whether such hepatic dysfunction precedes AD pathology and is a result of aberrant cholesterol metabolism associated with altered Cyp51a1 levels and activity, however, requires further investigation.
In addition to altered expression of Cyp51a1, a significant downregulation in hepatic Cyp2c29 was identified in APP/PS1 mice. Cyp2c29 metabolizes arachidonic acid into 14,15-cis-epoxyeicosatrienoic acids (EETs), which are known to be anti-inflammatory55. The alternative metabolism pathways of arachidonic acid are well characterized, where arachidonic acid is metabolized by cyclooxygenase (COX) and 5-lipoxygenase (LOX), resulting in the synthesis of prostaglandins and leukotrienes (known to be pro-inflammatory). The downregulation of Cyp2c29 observed in APP/PS1 mice may lead to more arachidonic acid feeding into the COX and LOX pathways, thereby promoting inflammation56. Chronic inflammation induced peripherally is sufficient to induce neurodegeneration even in the absence of genetic predisposition to AD57. The reduced hepatic Cyp2c29 in the liver of APP/PS1 mice could therefore increase the production of pro-inflammatory metabolites of arachidonic acid.
Our studies suggest that the oral absorption of drugs may be significantly affected in AD, however, further functional studies are needed to confirm these conclusions. Our findings have only been undertaken in one mouse model of familial AD, and studies to complement these results in other mouse models of both familial and sporadic AD are required. Furthermore, it would be ideal to confirm that the changes in intestinal transporters and hepatic enzymes observed in this mouse model are also replicated in tissues obtained from individuals with AD. Our studies are the first to suggest that the oral absorption of drugs that are Mrp2 and/or Mct1 substrates may be affected in AD. This information may aid in the development of optimized dosage regimens of certain medicines in individuals with AD to enhance efficacy and minimize toxicity.
Supplementary Material
ACKNOWLEDGEMENTS
The authors declare no competing financial interests. The authors gratefully acknowledge PharmAlliance (an alliance between the Pharmacy Schools of the University of North Carolina at Chapel Hill, Monash University and University College London) for sponsoring this research. Financial support also was provided, in part, by the National Institute of General Medical Sciences of the National Institutes of Health under Award Numbers T32GM086330 (Izna Ali), R01GM041935 and R35GM122576 (Kim Brouwer). The content is solely the responsibility of the authors and does not necessarily represent the official views of the National Institutes of Health. Animal histopathology was performed by the Animal Histopathology & Laboratory Medicine Core at the University of North Carolina (UNC), which is supported, in part, by a National Cancer Institute Center Core Support Grant (5P30CA016086-41) to the UNC Lineberger Comprehensive Cancer Center.
LIST OF ABBREVIATIONS
- AD
Alzheimer’s disease
- APP
amyloid precursor protein
- BBB
blood-brain barrier
- Bcrp
breast cancer resistance protein
- CNS
central nervous system
- Cyp
Cytochrome P450
- Mct1
monocarboxylate transporter 1
- Mrp2
multidrug resistance-associated protein 2
- Oatp
organic anion-transporting polypeptide
- Oct
organic cation transporter
- P-gP
P-glycoprotein
- PS1
presenilin-1
- Ugt
uridine-5’-phosphate-glucuronosyltransferase
REFERENCES
- 1.Alzheimer’s Association. Alzheimer's disease facts and figures. Alzheimer's & Dementia 2016, 12, (4), 459–509. [DOI] [PubMed] [Google Scholar]
- 2.Clague F; Mercer SW; McLean G; Reynish E; Guthrie B Comorbidity and polypharmacy in people with dementia: insights from a large, population-based cross-sectional analysis of primary care data. Age and Ageing 2017, 46, (1), 33–9. [DOI] [PubMed] [Google Scholar]
- 3.Starr JM Cholinesterase inhibitor treatment and urinary incontinence in Alzheimer's disease. Journal of the American Geriatrics Society 2007, 55, (5), 800–1. [DOI] [PubMed] [Google Scholar]
- 4.Gill SS; Mamdani M; Naglie G; Streiner DL; Bronskill SE; Kopp A; Shulman KI; Lee PE; Rochon PA A prescribing cascade involving cholinesterase inhibitors and anticholinergic drugs. Archives of Internal Medicine 2005, 165, (7), 808–13. [DOI] [PubMed] [Google Scholar]
- 5.Laitinen ML; Lonnroos E; Bell JS; Lavikainen P; Sulkava R; Hartikainen S Use of antidepressants among community-dwelling persons with Alzheimer's disease: a nationwide register-based study. International Psychogeriatrics 2015, 27, (4), 669–72. [DOI] [PubMed] [Google Scholar]
- 6.Mehta DC; Short JL; Nicolazzo JA Altered brain uptake of therapeutics in a triple transgenic mouse model of Alzheimer's disease. Pharmaceutical Research 2013, 30, (11), 2868–79. [DOI] [PubMed] [Google Scholar]
- 7.Hartz AMS; Miller DS; Bauer B Restoring blood-brain barrier P-glycoprotein reduces brain amyloid-β in a mouse model of Alzheimer's disease. Molecular Pharmacology 2010, 77, (5), 715–23. [DOI] [PMC free article] [PubMed] [Google Scholar]
- 8.Jeynes B; Provias J An investigation into the role of P-glycoprotein in Alzheimer's disease lesion pathogenesis. Neuroscience Letters 2011, 487, (3), 389–93. [DOI] [PubMed] [Google Scholar]
- 9.Xiong H; Callaghan D; Jones A; Bai J; Rasquinha I; Smith C; Pei K; Walker D; Lue LF; Stanimirovic D; Zhang W ABCG2 is upregulated in Alzheimer's brain with cerebral amyloid angiopathy and may act as a gatekeeper at the blood-brain barrier for Abeta(1-40) peptides. The Journal of Neuroscience 2009, 29, (17), 5463–75. [DOI] [PMC free article] [PubMed] [Google Scholar]
- 10.Deo AK; Borson S; Link JM; Domino K; Eary JF; Ke B; Richards TL; Mankoff DA; Minoshima S; O'Sullivan F; Eyal S; Hsiao P; Maravilla K; Unadkat JD Activity of P-glycoprotein, a beta-amyloid transporter at the blood-brain barrier, is compromised in patients with mild Alzheimer disease. Journal of Nuclear Medicine 2014, 55, (7), 1106–11. [DOI] [PMC free article] [PubMed] [Google Scholar]
- 11.Bruunsgaard H; Andersen-Ranberg K; Jeune B; Pedersen AN; Skinhoj P; Pedersen BK A high plasma concentration of TNF-alpha is associated with dementia in centenarians. Journal of Gerontology A Biological Sciences Medical Sciences 1999, 54, M357–64. [DOI] [PubMed] [Google Scholar]
- 12.Le Vee M; Lecureur V; Stieger B; Fardel O Regulation of drug transporter expression in human hepatocytes exposed to the proinflammatory cytokines tumor necrosis factor-alpha or interleukin-6. Drug Metabolism and Disposition 2009, 37, (3), 685–93. [DOI] [PubMed] [Google Scholar]
- 13.Van Ess PJ; Pedersen WA; Culmsee C; Mattson MP; Blouin RA Elevated hepatic and depressed renal cytochrome P450 activity in the Tg2576 transgenic mouse model of Alzheimer's disease. Journal of Neurochemistry 2002, 80, (4), 571–8. [DOI] [PubMed] [Google Scholar]
- 14.Giacomini KM; Huang SM; Tweedie DJ; Benet LZ; Brouwer KL; Chu X; Dahlin A; Evers R; Fischer V; Hillgren KM; Hoffmaster KA; Ishikawa T; Keppler D; Kim RB; Lee CA; Niemi M; Polli JW; Sugiyama Y; Swaan PW; Ware JA; Wright SH; Yee SW; Zamek-Gliszczynski MJ; Zhang L Membrane transporters in drug development. Nature Reviews Drug Discovery 2010, 9, (3), 215–36. [DOI] [PMC free article] [PubMed] [Google Scholar]
- 15.Polinsky RJ Clinical pharmacology of rivastigmine: a new-generation acetylcholinesterase inhibitor for the treatment of Alzheimer's disease. Clinical Therapeutics 1998, 20, (4), 634–47. [DOI] [PubMed] [Google Scholar]
- 16.Adlard PA; Cherny RA; Finkelstein DI; Gautier E; Robb E; Cortes M; Volitakis I; Liu X; Smith JP; Perez K; Laughton K; Li QX; Charman SA; Nicolazzo JA; Wilkins S; Deleva K; Lynch T; Kok G; Ritchie CW; Tanzi RE; Cappai R; Masters CL; Barnham KJ; Bush AI Rapid restoration of cognition in Alzheimer's transgenic mice with 8-hydroxy quinoline analogs is associated with decreased interstitial Abeta. Neuron 2008, 59, (1), 43–55. [DOI] [PubMed] [Google Scholar]
- 17.Radde R; Bolmont T; Kaeser SA; Coomaraswamy J; Lindau D; Stoltze L; Calhoun ME; Jaggi F; Wolburg H; Gengler S; Haass C; Ghetti B; Czech C; Holscher C; Mathews PM; Jucker M Abeta42-driven cerebral amyloidosis in transgenic mice reveals early and robust pathology. EMBO Reports 2006, 7, (9), 940–6. [DOI] [PMC free article] [PubMed] [Google Scholar]
- 18.Chen SQ; Cai Q; Shen YY; Wang PJ; Teng GJ; Zhang W; Zang FC Age-related changes in brain metabolites and cognitive function in APP/PS1 transgenic mice. Behavioural Brain Research 2012, 235, (1), 1–6. [DOI] [PubMed] [Google Scholar]
- 19.Ramos-Rodriguez JJ; Pacheco-Herrero M; Thyssen D; Murillo-Carretero MI; Berrocoso E; Spires-Jones TL; Bacskai BJ; Garcia-Alloza M Rapid beta-amyloid deposition and cognitive impairment after cholinergic denervation in APP/PS1 mice. Journal of Neuropathology & Experimental Neurology 2013, 72, (4), 272–85. [DOI] [PMC free article] [PubMed] [Google Scholar]
- 20.Uchida Y; Tachikawa M; Obuchi W; Hoshi Y; Tomioka Y; Ohtsuki S; Terasaki T A study protocol for quantitative targeted absolute proteomics (QTAP) by LC-MS/MS: application for inter-strain differences in protein expression levels of transporters, receptors, claudin-5, and marker proteins at the blood-brain barrier in ddY, FVB, and C57BL/6J mice. Fluids and Barriers of the CNS 2013, 10, (1), 21. [DOI] [PMC free article] [PubMed] [Google Scholar]
- 21.Akazawa T; Uchida Y; Tachikawa M; Ohtsuki S; Terasaki T Quantitative targeted absolute proteomics of transporters and pharmacoproteomics-based reconstruction of P-glycoprotein function in mouse small intestine. Molecular Pharmaceutics 2016, 13, (7), 2443–56. [DOI] [PubMed] [Google Scholar]
- 22.Kamiie J; Ohtsuki S; Iwase R; Ohmine K; Katsukura Y; Yanai K; Sekine Y; Uchida Y; Ito S; Terasaki T Quantitative atlas of membrane transporter proteins: development and application of a highly sensitive simultaneous LC/MS/MS method combined with novel in-silico peptide selection criteria. Pharmaceutical Research 2008, 25, (6), 1469–83. [DOI] [PubMed] [Google Scholar]
- 23.Miyauchi E; Tachikawa M; Decleves X; Uchida Y; Bouillot JL; Poitou C; Oppert JM; Mouly S; Bergmann JF; Terasaki T; Scherrmann JM; Lloret-Linares C Quantitative Atlas of Cytochrome P450, UDP-Glucuronosyltransferase, and Transporter Proteins in Jejunum of Morbidly Obese Subjects. Molecular Pharmaceutics 2016, 13, (8), 2631–40. [DOI] [PubMed] [Google Scholar]
- 24.Uchida Y; Ito K; Ohtsuki S; Kubo Y; Suzuki T; Terasaki T Major involvement of Na(+) -dependent multivitamin transporter (SLC5A6/SMVT) in uptake of biotin and pantothenic acid by human brain capillary endothelial cells. Journal of Neurochemistry 2015, 134, (1), 97–112. [DOI] [PubMed] [Google Scholar]
- 25.Cuadrado-Tejedor M; García-Osta A Current animal models of Alzheimer’s disease: challenges in translational research. Frontiers in Neurology 2014, 5, 182. [DOI] [PMC free article] [PubMed] [Google Scholar]
- 26.Mottino AD; Hoffman T; Jennes L; Vore M Expression and localization of multidrug resistant protein mrp2 in rat small intestine. Journal of Pharmacology and Experimental Therapeutics 2000, 293, (3), 717–23. [PubMed] [Google Scholar]
- 27.Jeong EJ; Liu X; Jia X; Chen J; Hu M Coupling of conjugating enzymes and efflux transporters: impact on bioavailability and drug interactions. Current Drug Metabolism 2005, 6, (5), 455–68. [DOI] [PubMed] [Google Scholar]
- 28.Barbarino JM; Haidar CE; Klein TE; Altman RB PharmGKB summary: very important pharmacogene information for UGT1A1. Pharmacogenetics and Genomics 2014, 24, (3), 177–83. [DOI] [PMC free article] [PubMed] [Google Scholar]
- 29.Kimpara T; Takeda A; Yamaguchi T; Arai H; Okita N; Takase S; Sasaki H; Itoyama Y Increased bilirubins and their derivatives in cerebrospinal fluid in Alzheimer's disease. Neurobiology of Aging 2000, 21, (4), 551–4. [DOI] [PubMed] [Google Scholar]
- 30.Jedlitschky G; Hoffmann U; Kroemer HK Structure and function of the MRP2 (ABCC2) protein and its role in drug disposition. Expert Opinion on Drug Metabolism & Toxicology 2006, 2, (3), 351–66. [DOI] [PubMed] [Google Scholar]
- 31.Arana MR; Tocchetti GN; Rigalli JP; Mottino A; Villanueva SS Physiological and pathophysiological factors affecting the expression and activity of the drug transporter MRP2 in intestine. Impact on its function as membrane barrier. Pharmacological Research 2016, 109, 32–44. [DOI] [PubMed] [Google Scholar]
- 32.Pazos M; Siccardi D; Mumy KL; Bien JD; Louie S; Shi HN; Gronert K; Mrsny RJ; McCormick BA Multidrug resistance-associated transporter 2 regulates mucosal inflammation by facilitating the synthesis of hepoxilin A3. The Journal Of Immunology 2008, 181, (11), 8044–52. [DOI] [PMC free article] [PubMed] [Google Scholar]
- 33.Puig KL; Lutz BM; Urquhart SA; Rebel AA; Zhou X; Manocha GD; Sens M; Tuteja AK; Foster NL; Combs CK Overexpression of mutant amyloid-β protein precursor and presenilin 1 modulates enteric nervous system. Journal of Alzheimer's Disease 2015, 44, (4), 1263–78. [DOI] [PMC free article] [PubMed] [Google Scholar]
- 34.Lai KSP, Liu CS, Rau A, Lanctôt KL, Köhler CA, Pakosh M, Carvalho A, Herrmann N Peripheral inflammatory markers in Alzheimer’s disease: a systematic review and meta-analysis of 175 studies. Journal of Neurology, Neurosurgery & Psychiatry 2017;88, (10), 876–82. [DOI] [PubMed] [Google Scholar]
- 35.Alvarez XA, Franco A, Fernández-Novoa L, Cacabelos R Blood levels of histamine, IL-1β, and TNF-α in patients with mild to moderate alzheimer disease. Molecular and Chemical Neuropathology 1996; 29, (2-3), 237–52. [DOI] [PubMed] [Google Scholar]
- 36.Bäuerl C; Collado MC; Diaz Cuevas A; Viña J; Pérez Martínez G Shifts in gut microbiota composition in an APP/PSS1 transgenic mouse model of Alzheimer's disease during lifespan. Letters in Applied Microbiology 2018; 66, (6), 464–71 [DOI] [PubMed] [Google Scholar]
- 37.Dhananjay P; Ramya Krishna V; Aswani Dutt V; Mitra AK, Biology of ocular transporters: efflux and influx transporters in the eye In Ocular Transporters and Receptors, Woodhead Publishing: 2013; pp 37–84. [Google Scholar]
- 38.Lengacher S; Nehiri-Sitayeb T; Steiner N; Carneiro L; Favrod C; Preitner F; Thorens B; Stehle J-C; Dix L; Pralong F; Magistretti PJ; Pellerin L Resistance to diet-induced obesity and associated metabolic perturbations in haploinsufficient monocarboxylate transporter 1 mice. PLoS ONE 2013, 8, (12), e82505. [DOI] [PMC free article] [PubMed] [Google Scholar]
- 39.Vijay N; Morris ME Role of Monocarboxylate transporters in drug delivery to the brain. Current Pharmaceutical Design 2014, 20, (10), 1487–98. [DOI] [PMC free article] [PubMed] [Google Scholar]
- 40.Thibault R; De Coppet P; Daly K; Bourreille A; Cuff M; Bonnet C; Mosnier JF; Galmiche JP; Shirazi-Beechey S; Segain JP Down-regulation of the monocarboxylate transporter 1 is involved in butyrate deficiency during intestinal inflammation. Gastroenterology 2007, 133, (6), 1916–27. [DOI] [PubMed] [Google Scholar]
- 41.Bröer A; Friedrich B; Wagner CA; Fillon S; Ganapathy V; Lang F; Bröer S Association of 4F2hc with light chains LAT1, LAT2 or y+LAT2 requires different domains. Biochemical Journal 2001, 355, (Pt 3), 725–31. [DOI] [PMC free article] [PubMed] [Google Scholar]
- 42.del Amo EM; Urtti A; Yliperttula M Pharmacokinetic role of L-type amino acid transporters LAT1 and LAT2. European Journal of Pharmaceutical Sciences 2008, 35, (3), 161–74. [DOI] [PubMed] [Google Scholar]
- 43.Vogt NM; Kerby RL; Dill-McFarland KA; Harding SJ; Mertuzzi AP; Johnson SC; Carlsson CM; Asthana S; Zetterberg H; Blennow K; Bendlin BB; Rey FE Gut microbiome alterations in Alzheimer’s disease. Scientific Reports 2017, 7, 13537. [DOI] [PMC free article] [PubMed] [Google Scholar]
- 44.Semar S; Klotz M; Letiembre M; Van Ginneken C; Braun A; Jost V; Bischof M; Lammers WJ; Liu Y; Fassbender K; Wyss-Coray T; Kirchhoff F; Schäfer KH Changes of the enteric nervous system in amyloid-β protein precursor transgenic mice correlate with disease progression. Journal of Alzheimer’s Disease 2013, 36, (1), 7–20. [DOI] [PubMed] [Google Scholar]
- 45.Hartz AM; Miller DS; Bauer B Restoring blood–brain barrier P-glycoprotein reduces brain Aβ in a mouse model of Alzheimer’s disease. Molecular Pharmacology 2010, 77, (5), 715–23. [DOI] [PMC free article] [PubMed] [Google Scholar]
- 46.Hooijmans CR; Graven C; Dederen PJ; Tanila H; van Groen T; Kiliaan AJ Amyloid beta deposition is related to decreased glucose transporter-1 levels and hippocampal atrophy in brains of aged APP/PS1 mice. Brain Research 2007, 1181, 93–103. [DOI] [PubMed] [Google Scholar]
- 47.Wu Z; Guo H; Chow N; Sallstrom J; Bell RD; Deane R; Brooks AI; Kanagala S; Rubio A; Sagare A; Liu D; Li F; Armstrong D; Gasiewicz T; Zidovetzki R; Song X; Hofman F; Zlokovic BV Role of the MEOX2 homeobox gene in neurovascular dysfunction in Alzheimer disease. Nature Medicine 2005, 11, 959–65 [DOI] [PubMed] [Google Scholar]
- 48.Kook SY; Hong HS; Moon M; Ha CM; Chang S; Mook-Jung I Aβ1–42-RAGE interaction disrupts tight junctions of the blood-brain barrier via Ca2+-calcineurin signalling. Journal of Neuroscience 2012, 32, 8845–54. [DOI] [PMC free article] [PubMed] [Google Scholar]
- 49.Lewińska M; Zelenko U; Merzel F; Golic Grdadolnik S; Murray JC; Rozman D Polymorphisms of CYP51A1 from cholesterol synthesis: associations with birth weight and maternal lipid levels and impact on CYP51 protein structure. PLOS ONE 2013, 8, (12), e82554. [DOI] [PMC free article] [PubMed] [Google Scholar]
- 50.Kang J; Rivest S Lipid metabolism and neuroinflammation in Alzheimer's disease: a role for liver X receptors. Endocrine Reviews 2012, 33, (5), 715–46. [DOI] [PubMed] [Google Scholar]
- 51.Hardwick RN; Ferreira DW; More VR; Lake AD; Lu Z; Manautou JE; Slitt AL; Cherrington NJ Altered UDP-glucuronosyltransferase and sulfotransferase expression and function during progressive stages of human nonalcoholic fatty liver disease. Drug Metabolism and Disposition 2013, 41, (3), 554–61. [DOI] [PMC free article] [PubMed] [Google Scholar]
- 52.Wu J; Fu B; Lei H; Tang H; Wang Y Gender differences of peripheral plasma and liver metabolic profiling in APP/PS1 transgenic AD mice. Neuroscience 2016, 332, 160–9. [DOI] [PubMed] [Google Scholar]
- 53.Astarita G; Jung K-M; Berchtold NC; Nguyen VQ; Gillen DL; Head E; Cotman CW; Piomelli D Deficient liver biosynthesis of docosahexaenoic acid correlates with cognitive impairment in Alzheimer's disease. PLoS ONE 2010, 5, (9), e12538. [DOI] [PMC free article] [PubMed] [Google Scholar]
- 54.Seo SW; Gottesman RF; Clark JM; Hernaez R; Chang Y; Kim C; Ha KH; Guallar E; Lazo M Nonalcoholic fatty liver disease is associated with cognitive function in adults. Neurology 2016, 86, (12), 1136–42. [DOI] [PMC free article] [PubMed] [Google Scholar]
- 55.Thomson SJ; Askari A; Bishop-Bailey D Anti-inflammatory effects of epoxyeicosatrienoic acids. International Journal of Vascular Medicine 2012, 2012, 7. [DOI] [PMC free article] [PubMed] [Google Scholar]
- 56.Inceoglu B; Schmelzer KR; Morisseau C; Jinks SL; Hammock BD Soluble epoxide hydrolase inhibition reveals novel biological functions of epoxyeicosatrienoic acids (EETs). Prostaglandins & Other Lipid Mediators 2007, 82, (1), 42–9. [DOI] [PMC free article] [PubMed] [Google Scholar]
- 57.Kim DG; Krenz A; Toussaint LE; Maurer KJ; Robinson SA; Yan A; Torres L; Bynoe MS Non-alcoholic fatty liver disease induces signs of Alzheimer’s disease (AD) in wild-type mice and accelerates pathological signs of AD in an AD model. Journal of Neuroinflammation 2016, 13, 1. [DOI] [PMC free article] [PubMed] [Google Scholar]
Associated Data
This section collects any data citations, data availability statements, or supplementary materials included in this article.