

Abstract
The amygdala is critically involved in processing emotion. Through bidirectional connections, the prefrontal cortex (PFC) is hypothesized to influence amygdala reactivity. However, research that elucidates the nature of amygdala-PFC interactions – through mapping amygdala-prefrontal tracts, quantifying variability among tracts, and linking this variability to amygdala activation – is lacking. Using probabilistic tractography to map amygdala-prefrontal white matter connectivity in 142 adolescents, the present study found that white matter connectivity was greater between the amygdala and the subgenual cingulate, orbitofrontal (OFC), and dorsomedial (dmPFC) prefrontal regions than with the dorsal cingulate and dorsolateral regions. Then, using a machine-learning regression, we found that greater amygdala-PFC white matter connectivity related to attenuated amygdala reactivity. This effect was driven by amygdala white matter connectivity with the dmPFC and OFC, supporting implicit emotion processing theories which highlight the critical role of these regions in amygdala regulation. This study is among the first to map and compare specific amygdala-prefrontal white matter tracts and to relate variability in connectivity to amygdala activation, particularly among a large sample of adolescents from a well-sampled study. By examining the association between specific amygdala-PFC tracts and amygdala activation, the present study provides novel insight into the nature of this emotion-based circuit.
Keywords: diffusion MRI, functional MRI, multimodal, emotion
The amygdala is critical to processing emotion. Altered amygdala function is implicated in a range of emotion-based traits and conditions, including inhibited temperament, depression, and anxiety (Monk, Telzer, Mogg, & et al, 2008; Schwartz, Wright, Shin, Kagan, & Rauch, 2003; Yang et al., 2010). Core to many theories of amygdala function and related behavioral and psychiatric outcomes is the hypothesis that, through bidirectional connections, the prefrontal cortex (PFC) influences amygdala reactivity (Etkin, Büchel, & Gross, 2015). However, research that elucidates the nature of amygdala-PFC interactions – through mapping amygdala-PFC tracts, quantifying variability in strength among tracts, and linking this variability to amygdala activation – is lacking. Adolescence is a salient period for studying this interaction because amygdala-PFC connections continue to develop throughout adolescence (Lenroot & Giedd, 2006; Olson, Heide, Alm, & Vyas, 2015) and individual variability in these connections are implicated in adolescent morbidity and mortality (Casey, Duhoux, & Cohen, 2010). The present study aims to precisely map the relation between structure of the amygdala-PFC circuit and amygdala function in a relatively large sample of adolescents.
Neural tract tracer studies in non-human primates have detailed amygdala-PFC connections (Amaral & Price, 1984; Ghashghaei, Hilgetag, & Barbas, 2007). However, in humans, such approaches are not feasible, so evaluation of amygdala-PFC white matter connectivity is accomplished using non-invasive diffusion MRI (dMRI). Though a wealth of studies have used dMRI to examine broad white matter tracts in humans (Von Der Heide, Skipper, Klobusicky, & Olson, 2013), few have examined these connections using more precise dMRI methods (e.g., probabilistic tractography) (Eden et al., 2015; Greening & Mitchell, 2015). Probabilistic tractography uses dMRI data to approximate a probability density function for each voxel that quantifies white matter connectivity between a seed region and the rest of the brain. Additionally, probabilistic tractography can account for multiple fiber directions in a voxel which more precisely maps connections compared to traditional deterministic tractography (Behrens, Berg, Jbabdi, Rushworth, & Woolrich, 2007). These features make probabilistic tractography an ideal method to quantify human amygdala-PFC white matter connectivity.
Previous research combining dMRI and functional MRI (fMRI) has linked large fiber bundles, such as the uncinate fasciculus – the major white matter tract connecting the limbic system and PFC – with amygdala activation (Hein et al., in press; Swartz et al., 2014). However, non-human primate neural tract tracer studies have found a large amount of variability in the strength of specific tracts connecting the amygdala with different PFC regions (Barbas, 2015; Ray & Zald, 2012). This variability, which is critical for a fuller understanding of the neural basis of emotion, is relatively uncharted in humans. While amygdala-PFC white matter has been examined (Eden et al., 2015), the variability in those tracts has not been explored or related to modulation in amygdala activation. This important information would fundamentally deepen our understanding of how specific tracts vary across the PFC and contribute to neural function.
The present study had two objectives. First, we used probabilistic tractography to quantify the maximum-likelihood of amygdala white matter connectivity with seven PFC regions that share structural connections with the amygdala based on tract tracer studies of non-human primates: Brodmann’s Area (BA)9, BA10, BA11, BA24, BA25, BA32, BA47. This powerful dMRI metric quantifies the likelihood that there are white matter connections between the amygdala and each targeted region of the PFC. It utilizes a Bayesian probability approach that more accurately models the complex white matter structure in the brain than traditional deterministic tractography and provides estimates of the probability that two regions of the brain are structurally connected (Behrens et al., 2007). Following nonhuman primate findings, we hypothesized that the subgenual cingulate (BA25), orbitofrontal (BA11, BA47), dorsal cingulate (BA24, BA32), and dorsomedial (BA10) regions of the PFC would have greater connectivity with the amygdala relative to dorsolateral (BA9) regions. Second, we used a machine-learning regression approach to examine the relation between the probability of amygdala white matter connectivity with the specified PFC regions and amygdala activation from an emotional faces fMRI task. Additionally, we used a bootstrapping procedure to determine if white matter tracts between the amygdala and specific PFC regions explained amygdala reactivity above and beyond the other regions. We hypothesized that increased amygdala-PFC connectivity, particularly within medial and orbitofrontal PFC regions, would correspond to attenuated amygdala activation to threat. By examining the association between specific amygdala-PFC tracts and amygdala activation, the present work elucidated the nature of this emotion-based circuit.
Materials & Methods
Participants
Participants included in the analysis for this study (N=141) were adolescents ages 15-17 years recruited from the Detroit, MI, Toledo, OH, and Chicago, IL of the Fragile Families and Childhood Wellbeing nation-wide study (FFCWS). The FFCWS is a population-based sample of children born in large US cities, with an oversample of non-marital births (Reichman, Teitler, Garfinkel, & McLanahan, 2001). FFCWS families were interviewed at the birth of the focal child, and when the child was 1, 3, 5, 9, and 15 years of age. The FFCWS was sampled to represent children born at the turn of the century in American cities of 200,000 or more with an oversample of non-marital births to capture families that might face more economic and social challenges. Given the demographics and sample sizes in Detroit, Toledo and Chicago (Hein et al., 2018), a majority of the sample identified as African American, a group that has been underrepresented in neuroscience research (Falk et al., 2013). The total number of participants recruited for this study was 237. See Table 1 for, participant demographic information, reasons for participant exclusion, and for a comparison of the participant demographics for the included sample and the full sample. These data overlap with prior work from our research group (Hein et al., 2018). The University of Michigan Medical School Institutional Review Board approved this study. All adolescent participants provided written informed assent, and their primary caregivers provided written consent for both themselves and their adolescent children, after the study was explained and questions were answered.
Table 1:
Participant characteristics including: (upper) reasons for exclusion from analysis and the number of participants excluded for that reason; (lower) comparison between the demographic characteristics and symptoms of internalizing disorders of the included and full samples.
| Exclusions | |||
|---|---|---|---|
| Reason | Number Excluded | ||
| No Data or Incomplete Data Collection (Both dMRI & fMRI)/pilot participants | 46 | ||
| Significant Artifacts in dMRI Data | 24 | ||
| Significant Artifacts in fMRI Data | 2 | ||
| Significant Artifacts in Structural MRI Data | 3 | ||
| Behavioral Accuracy <70% on Faces Task | 9 | ||
| Number of Included Amygdala Voxels in Functional Data <70% of Total | 4 | ||
| Statistically Influential Outlier using Cook’s Distance – exceeded | 6 | ||
| Diagnosis of Autism Spectrum Disorder | 2 | ||
| Included vs. Full Sample Comparison | |||
| Included Sample (N=141) | Full Sample (N=237) | Statistically Different? | |
| Age | M = 15.85 yrs | SD = 0.52 yrs | M = 15.88 yrs | SD = 0.54 yrs | No t(307.45) = 0.11, p=.91 |
| Puberty | M = 3.27 | SD = 0.58 | M = 3.24 | SD = 0.59 | No t(296.82) = 0.59, p=0.56 |
| Gender | F = 78 | M = 63 | F = 125 | M = 112 | No X2 (1) = 0.00, p=.95 |
| Race | Black / African American: 102 White / Caucasian: 22 Asian American: 2 Biracial/Multiracial: 7 Unknown/Not Reported: 7 |
Black / African American: 170 White / Caucasian: 35 Asian American: 2 Biracial/Multiracial: 16 Unknown/Not Reported: 14 |
No X2(4) = 0.01, p=.99 |
| Anxiety Symptoms1 | M = 17.84 | SD = 11.54 | M = 16.97 | SD = 11.21 | No t(289.51) = 0.71, p=0.48 |
| Depression Symptoms2 | M = 16.01 | SD = 10.25 | M = 15.37 | SD = 10.05 | No t(291.74) = 0.59, p=0.56 |
Anxiety symptoms measured using the Screen for Child Related Anxiety Disorders (SCARED)-adolescent report
Depression symptoms measured using the Mood and Feelings Questionnaire (MFQ)-adolescent report
Procedure
Following informed consent from the parent/legal guardian and informed assent from the subject (UM IRBMED: HUM00074392), participants completed a practice version of a Gender Identification (Faces) Task outside of the scanner. After task training, structural, functional, and diffusion MRI data were collected.
Experimental Design: Gender Identification Task (Faces Task)
During fMRI data collection, participants completed an implicit emotion task in which they were instructed to attend to the gender of emotional faces from the NimStim set (Tottenham et al., 2009) and respond to the gender of the face (Swartz et al., 2014). A trial consisted of a 500 ms fixation cross followed by a face presented for 250 ms. A black screen then appeared for 1500 ms, during which participants indicated the gender of the face by pressing a button (thumb for male, index finger for female). Total trial duration was 2250 ms with an inter-trial interval that was jittered and ranged from 2000 to 6000 ms at intervals of 2000 ms (See Figure 1). There were a total of 100 trials with 20 trials of each of the following emotions: happy, sad, angry, fearful, neutral. There were equal numbers of males and female faces and an equal number of faces from individuals identified as White/Caucasian-American and Black/African-American. The Faces task was conducted using E-Prime version 2.0 (Psychology Software Tools, Pittsburgh, PA) and was projected onto a screen using a BrainLogics MR Digital Projector (Psychology Software Tools, Pittsburgh, PA). Participants used a periscope to see the screen. Responses to the task were collected using a non-metallic fiber optic transducer linked to a response box. Participants who achieved less than 70% accuracy on the Faces Task were excluded (N=9). Average task accuracy was 94.74%. Incorrect trials were modeled as a separate condition and excluded from analysis. Prior to scanning, participants completed a practice session of the Faces Task with a different set of faces from the Ekman and Friesen set (Ekman & Friesen, 1975).
Figure 1:

Task schematic of the gender identification (faces) task. A trial consisted of a 500 ms fixation cross followed by a face presented for 250 ms. A black screen then appeared for 1500 ms, during which participants indicated the gender of the face by pressing a button (thumb for male, index finger for female). Total trial duration was 2250 ms with an inter-trial interval that was jittered and ranged from 2000 to 6000 ms at intervals of 2000 ms. There was a total of 100 trials with 20 of each of the following emotions: happy, sad, angry, fearful, neutral.
MR Acquisition
MRI images were acquired using a GE Discovery MR750 3T scanner with an 8-channel head coil located at the UM Functional MRI Laboratory. Head movement was minimized through: (a) instructions to the participant and (b) padding and pillows placed around the head, which are well-tolerated, yet limit motion.
Structural MRI Acquisition.
Two structural image sets were acquired: T1-weighted gradient echo images were taken before the functional scans using the same field of view (FOV) and slices as the functional scans (TR = 9.0 seconds, TE = 1.8 seconds, TI = 400 ms, flip angle = 15°, FOV = 22 cm; slice thickness = 3 mm; 256 × 256 matrix; 40 slices); and a high-resolution, T1 axial overlay acquired after the functional scans (TR = 250, TE = 5.7, TI = 400 flip angle = 90°, FOV = 26 cm, slice thickness = 1.4 mm, 100 slices; matrix = 256 × 256).
Diffusion MRI Acquisition.
Diffusion MRI identifies the microstructural properties of white matter tracts (Jones, Knösche, & Turner, 2013). Data was collected using spin-echo EPI diffusion sequence (scan parameters: TR 7250ms, Minimum TE, 128×128 acquisition matrix, 22 cm FOV, 3 mm thick slices (no gap), 40 slices acquired, b value = 1000 s/mm2, 64 directions, five b=0s/mm2 T2 images (b0) acquired).
fMRI Acquisition.
Functional T2*-weighted BOLD images were acquired using a reverse spiral sequence (Glover & Law, 2001) of 40 contiguous axial 3 mm slices (TR = 2000 ms, TE = 30 ms, flip angle = 90°, FOV = 22 cm, voxel size = 3.44mm × 3.44mm × 3mm, sequential ascending acquisition). Slices were prescribed parallel to the AC-PC line (same locations as structural scans). Images were reconstructed into a 64×64 matrix. Slices were acquired contiguously, which optimized the effectiveness of the movement post-processing algorithms. Images were reconstructed off-line using processing steps to remove distortions caused by magnetic field inhomogeneity and other sources of misalignment to the structural data, which yields excellent coverage of subcortical areas of interest.
Imaging Data Analysis
MRI Pre-processing.
Anatomical images were homogeneity-corrected using SPM2, then skull-stripped using the Brain Extraction Tool in FSL (version 5.0.7) (Jenkinson, Beckmann, Behrens, Woolrich, & Smith, 2012; Smith, 2002). The functional imaging data then had the following preprocessing steps applied: removal of large temporal spikes in k-space data (> 2 std dev), field map correction and image reconstruction using custom code in MATLAB; and slicetiming correction using SPM8 (Wellcome Department of Cognitive Neurology, London, UK; http://www.fil.ion.ucl.ac.uk). Functional images were realigned to the AC-PC plane in the mean image. Using SPM12 (v.6906), anatomical images were co-registered to the functional images. Functional images were normalized to the MNI Image space using parameters from the T1 images segmented into gray and white matter, cerebrospinal fluid, bone, soft tissue and air using a Tissue Probability Map created in SPM12. Images were then smoothed using an isotropic 8 mm full width at half maximum Gaussian kernel. Following preprocessing, Artifact Detection Tools (ART) software (http://www.nitrc.org/projects/artifact_detect) identified motion outliers (>2mm movement or 3.5° rotation). Outliers were censored from individual participant models using a single regressor for each outlier volume. The mean percentage of outlier volumes regressed for included participants was 0.18% (SD = 0.71) with a range of 0-6.2%. Given the low range of outliers, we did not exclude any participants based on these outliers.
Diffusion MRI Analysis.
Diffusion images were converted from DICOM to NIFTI format using MRIcron (dcm2niix – 2MAY2016) for offline analysis using the FSL (v. 5.0.9) FMRIB's Diffusion Toolbox (FDT) (v. 3.0) (Jenkinson et al., 2012). Diffusion data were manually checked and corrected for white pixel and other forms of artifact as described previously by Hein and colleagues (Hein et al., 2018). Diffusion MRI data were then corrected for head motion and eddy currents using affine registration to a reference volume (ref. volume b = 0) (eddy_correct: FSL). Since exclusion criteria were based on manual review of data, mean relative framewise displacement was calculated for all included participants to ensure adequate quality control (Mark Jenkinson, Bannister, Brady, & Smith, 2002). Mean relative framewise displacement was 0.42mm (SD=0.09mm). Using FSL's Brain Extraction Tool (Smith, 2002), a mask of the brain was made from a non-diffusion weighted image with a fractional intensity threshold of f = 0.25. A diffusion model was then calculated at each voxel to ensure the correct orientation of the principal eigenvector and confirm the quality of the BET mask.
Following these preprocessing steps, bedpostx (bedpostx_gpu: (Hernández et al., 2013) was performed using the standard settings (number of fibers modeled per voxel = 2, multiplicative factor weight = 1, burn in = 1000) to build up a distribution of diffusion parameters using Markov Chain Monte Carlo sampling at each voxel (Behrens et al., 2007). The diffusion data were then registered using FLIRT (Jenkinson & Smith, 2001; Jenkinson et al., 2002) to allow for the linear transformation between diffusion, standard, and structural space.
FSL's probtrackx2 (nsamples per voxel = 5000; nsteps per sample = 2000; step length = 0.5mm; curvature threshold = 0.2; fibthresh = 0.01; distthresh = 0.1) (probtrackX2_gpu: (Hernandez-Fernandez et al., 2016) was used to estimate the probability of white matter connectivity between the prefrontal cortex and the amygdala (Behrens et al., 2007; Behrens, Johansen-Berg, et al., 2003; Behrens, Woolrich, et al., 2003; Eickhoff et al., 2010; Johansen-Berg et al., 2004). In this analysis, the amygdala, defined using masks created using WFU Pick Atlas (v 3.0.5b) (Maldjian, Laurienti, Kraft, & Burdette, 2003), was the seed region and seven Brodmann's Areas (BA) where anatomical connectivity associated with emotion processing has been established in non-human primate neural tract tracer studies (Barbas, 2015; Ghashghaei et al., 2007; Ray & Zald, 2012) were specified as the target regions. Those areas were BA9, BA10, BA11, BA24, BA25, BA32, BA47. Individual masks were made for the included regions for each hemisphere using WFU Pick Atlas (v 3.0.5b) (Maldajian et al., 2003). During the probabilistic tractography analysis, each mask was transformed to the individual subject’s diffusion space using FSL’s FLIRT (M. Jenkinson & Smith, 2001; Mark Jenkinson et al., 2002). Seven separate probabilistic tractography analyses were run in each participant’s native diffusion space for the anatomical regions in each hemisphere (14 probabilistic tractography analyses total). Only ipsilateral connections between the amygdala and PFC regions were targeted in this analysis because neural tracer studies in non-human primates suggest that first order amygdala connections are primarily ipsilateral (Ghashghaei et al., 2007).
Following the individual probabilistic tractography analyses, the resulting amygdala images representing the probability of white matter connectivity with the specified PFC targets were transformed to MNI space for further analysis. Prior to the group-level analysis, each of the individual amygdala images were divided by the total number of samples per voxel (5000) which scaled the probability value at each voxel to a range between 0 and 1. Based on the group-level analysis outlined in Greening and Mitchell (Greening and Mitchell, 2015), an average amygdala image was created for each PFC target using fslmaths (FMRIB, Oxford, UK) and the peak voxel in that image was identified using the cluster command in FSL. Following the automatic identification of a maximum value, or peak, we manually confirmed that the identified voxel had the highest likelihood of connectivity with the target region in the group-level map. This peak voxel represents the maximum probability of white matter connectivity between the amygdala and the specified PFC region at the group level. We identified group-level peaks to avoid different individual peak locations which could potentially be an artifact of statistical noise in the data. A 6mm sphere mask was then created centered around the peak voxel (see Table 2 for MNI coordinates for each amygdala-target pair). Once each of the amygdala-target peak voxel group-level masks were created, the average probability of connectivity for each mask was extracted at the individual participant level. This extracted value represents the maximum likelihood estimate of probability for each of the 14 amygdala-target pairs.
Table 2:
Montreal Neuroimaging Institute (MNI) coordinates for the peak probability of white matter connectivity with the amygdala for each PFC Brodmann’s Area (BA) in both the left and right hemispheres, mean maximum likelihood of amygdala white matter connectivity for each BA with the standard deviations in ( ), and results of the one-sample t-tests which compared the mean maximum likelihood of white matter connectivity for each amygdala-BA pair to zero.
| Left Hemisphere | |||
|---|---|---|---|
| Region | Peak Coordinates in MNI Space 1 |
Mean Maximum Likelihood |
Different from Zero? |
| BA9 | −26 −2 −14 | 0.002 (0.004) | t(140) = 4.69, p=0.000 |
| BA10 | −32 −6 −16 | 0.008 (0.015) | t(140) = 6.54, p=0.000 |
| BA11 | −32 −6 −16 | 0.017 (0.026) | t(140) = 7.63, p=0.000 |
| BA24 | −20 −2 −30 | 0.003 (0.006) | t(140) = 7.25, p=0.000 |
| BA25 | −18 −2 −16 | 0.087 (0.065) | t(140) = 15.88, p=0.000 |
| BA32 | −26 −2 −14 | 0.002 (0.004) | t(140) = 5.93, p=0.000 |
| BA47 | −32 −6 −16 | 0.020 (0.024) | t(140) = 10.04, p=0.000 |
| Right Hemisphere | |||
| Region | Peak Coordinates in MNI Space 1 |
Mean Maximum Likelihood |
Different from Zero? |
| BA9 | 30 −4 −14 | 0.004 (0.007) | t(140) = 6.54, p=0.000 |
| BA10 | 30 −4 −14 | 0.045 (0.046) | t(140) = 11.59, p=0.000 |
| BA11 | 32 −2 −22 | 0.068 (0.063) | t(140) = 12.85, p=0.000 |
| BA24 | 22 −2 −14 | 0.004 (0.006) | t(140) = 7.05, p=0.000 |
| BA25 | 16 −2 −16 | 0.090 (0.076) | t(140) = 14.13, p=0.000 |
| BA32 | 30 −4 −14 | 0.004 (0.007) | t(140) = 6.82, p=0.000 |
| BA47 | 32 0 −22 | 0.100 (0.081) | t(140) = 14.65, p=0.000 |
Note: Bonferroni corrected p-value = 0.003 (0.05/14 tests).
Peak voxels were identified at the group level by averaging together all participants’ results from each probabilistic tractography seed-target pair (1 BA with the ipsilateral amygdala per hemisphere) and finding the maximum probability at the group-level. These peaks were used to create 6mm sphere masks for extracting maximum likelihood of white matter connectivity for each seed-target pair.
Functional Activation.
First-level statistical analyses for functional activation were performed using the general linear model implemented in SPM12. For each participant, conditions were modeled with the SPM12 canonical hemodynamic response function. Incorrect trials were modeled as a separate condition and were not included in subsequent analysis. A statistical image for each condition contrast in the Faces Task at each voxel were generated. Mean activation was extracted for both the left and right amygdala using MarsBaR (v. 0.44) (Brett, Anton, Valabregue, & Poline, 2002) from the contrast image representing a combination of fear and anger trials (threat) vs. baseline. ROI masks used in the extraction were created using the left and right amygdala from the AAL Atlas in WFU Pickatlas (Maldjian et al., 2003).
Adolescent Pubertal Development
To address potential confounding effects of pubertal status, gender, family income, and child internalizing symptoms, we controlled for these constructs in analyses. Self-report of pubertal status by the adolescent was collected using the Pubertal Development Scale (Petersen, Crockett, Richards, & Boxer, 1988). When the adolescent report was not available (N=5), the parent report was used. Pubertal development scores reported by parents were not significantly different from those reported by the adolescent (t(5.41)=−1.36, p=0.23). Pubertal development was on a scale of 1 (no pubertal development) to 4 (completed pubertal development).
Adolescent Gender
Adolescent self-report of gender was determined using the Pubertal Development Scale; specifically, if they answered female- or male-specific questions on the scale. Gender was used as a covariate in the present analysis.
Family Annual Income
Annual income was reported by the parent and included salary/wages, child support, and any other financial aid for the household. Parents chose a range of income from 14 categories: 1) $4,999 or less; 2) $5,000-$9,999; 3) $10,000-$14,999; 4) $15,000-$19,999; 5) $20,000-$24,999; 6) $25,000-$29,999; 7) $30,000-$39,000; 8) $40,000-$49,999; 9) $50,000-$59,999; 10) $60,000- $69,999; 11) $70,000-$79,999; 12) $80,000-$89,000; 13) $90,000 or more; 14) N/A. Nine families did not report their annual income or marked N/A and were excluded from analyses using annual income as a covariate.
Adolescent Internalizing Symptoms
Symptoms of current internalizing disorders (e.g. anxiety and depression) were quantified using adolescent self-report on the Mood and Feelings Questionnaire (MFQ) (Angold, Costello, Pickles, & Winder, 1987) for depression and the Screen for Child Anxiety Related Disorders (SCARED) (Birmaher et al., 1997) for anxiety. Sum scores for both the MFQ and the SCARED were used as covariates to control for current anxiety and depression symptoms.
Analytic Plan
The data utilized in the present study have been shared through the NIMH RDoC data archive (https://data-archive.nimh.nih.gov/rdocdb). The code used in data processing and analysis are not publicly available; however, they are available upon request.
Quantify and describe white matter connectivity between the amygdala and PFC.
To quantify the white matter connectivity between the amygdala and the seven ROIs in the PFC, the participant level means and standard deviations for the probability of white matter connectivity for each ROI mask were collected and compared against zero. An independent sample t-test was done in R (v. 3.3.1) to compare each of the seven ROI regions per hemisphere to zero using a Bonferroni corrected threshold of p<0.004 (0.05/14 tests). Additionally, independent sample t-tests were done to compare the maximum likelihood of amygdala white matter connectivity between PFC regions to determine which regions had the highest likelihood of amygdala connectivity using a hemisphere level Bonferroni corrected threshold of p<0.002 (0.05/21 tests). Correlations were calculated to determine if there were significant associations between gender, pubertal development, current family annual income, and internalizing symptoms (MFQ and SCARED and likelihood of amygdala-PFC connectivity.
Evaluate the relationship between amygdala-PFC microstructures and amygdala activation.
To evaluate the relationship between amygdala-PFC microstructures and amygdala activation, multiple linear regression was done using the ridge regression model from the Python-based (v. 2.7.11) Scikit-learn toolbox (v 0.19.0) (Pedregosa et al., 2011). The analysis in the study was adapted from Greening and Mitchell (Greening & Mitchell, 2015). Ridge regression was used in the place of ordinary lease squares because it is better able to handle collinearity of predictors in a regression (Hoerl & Kennard, 1970), which was present in the predictors in the analysis. To select the regularization, alpha, parameter for the ridge regression model, an automated cross-validation function, ridgeCV, from the Scikit-learn toolbox was used. In this function, the regression model is fit onto the data using leave-one-out cross-validation to determine the optimized alpha parameter. The optimized regularization parameter was selected from a vector of alpha values from 0.001 to 10 in steps of 0.1. Based on the output of this function, the mean α=0.1 was selected.
To estimate the full model where the amygdala-PFC structural connectivity for the seven PFC regions predicted ipsilateral amygdala activation (one model per hemisphere) a stratified six-fold cross-validated approach was done using the permutation_test_score function in the Scikit-learn toolbox. We based our decision to use a six-fold cross-validated approach off of a previous probabilistic tractography study from the literature (Greening and Mitchell, 2015). This was the only train:test ratio we performed. In this approach, the data is randomly split into six groups without replacement. Five of the six groups are then used as a training group with the sixth group acting as a test group. The function iterates through the data such that each group acts as the test group one time. Accuracy of each test iteration was measured by computing the mean squared error (MSE) between the observed and predicted amygdala activation values. To test the statistical significance of the full model, this function used random permutation sampling where the predictors were randomly paired with an amygdala activation value a total of 5000 times. The p-value is calculated based on the percentage of samples where the regression model fit better in the random data than in the observed data (Greening & Mitchell, 2015; Ojala & Garriga, 2010). As a check of linear model assumptions, prior to running the machine-learning regression models, we used the gvlma command in R (https://cran.r-project.org/web/packages/gvlma/gvlma.pdf) which tests the assumptions for linear regression in our planned models for both the left and the right hemisphere (Peña and Slate, 2006). In the models for both hemispheres, the global statistic, skewness, kurtosis, link function, and heteroscedasticity assumptions were acceptable.
To assess which tracts were reliably contributing to the full model, a bootstrapping procedure utilized in Greening and Mitchell (Greening & Mitchell, 2015) was used. The data was split into training and tests datasets 1000 times with 84% of the cases assigned to the training set and 16% assigned to the test data set. These percentages were chosen because they approximate the training and test percentages used in the six-fold cross-validated approach used to test the full model. This allowed for the creation of 1000 independent models with beta weights for each of the connectivity values for the seven amygdala-PFC seed-target pairs. These weights were then sorted to determine if 95% (950) or more were above or below zero. This provided a 95% confidence interval (CI) for each predictor. Predictors were considered to be reliable contributors if their 95% CI did not include zero. See Table 2 for the median coefficient value and the 95% CI for each predictor.
As a secondary analysis, we ran two additional models per hemisphere using the same machine-learning ridge regression method to ensure that our effects were not confounded by demographic covariates (gender, pubertal development, family income), or internalizing symptoms (MFQ and SCARED sum scores). The first analysis controlled for demographic covariates (gender and pubertal development) and internalizing symptoms. The second added annual income as a covariate in addition to the previously included covariates. Annual income was added in a second model because nine families did not report annual income and thus the included sample and statistical power for that model was reduced. The unique contribution of specific white matter tracts was assessed for each additional model using the same bootstrapping method.
To assess if associations between amygdala-PFC white matter connectivity and amygdala activation generalized beyond threatening facial stimuli to general emotion processing, we tested whether amygdala-PFC connectivity was predictive of amygdala reactivity to happy and sad faces controlling for gender, pubertal development, and symptoms of internalizing disorders. If models were significant, we ran the same bootstrapping procedure to determine if any regions were reliable predictors.
Results
White matter connectivity with the amygdala was widespread across the PFC
The maximum likelihood of white matter connectivity for each of the seven PFC regions in both hemispheres (BA9, BA10, BA11, BA24, BA25, BA32, BA47) and the ipsilateral amygdala were statistically different from zero using a Bonferroni corrected p-value for 14 comparisons (p < 0.004) (see Table 2 for mean maximum likelihood probability for each region and for the results of the individual t-tests). See Figure 2 for visual representation of the maximum likelihood probability values for each region in both hemispheres.
Figure 2:

Maximum likelihood of connectivity with the amygdala. Top: Left hemisphere regions; Bottom: Right Hemisphere regions. Low to high maximum likelihood is represented by red to yellow color scale.
When we compared the maximum likelihood of amygdala connectivity across PFC regions, in both hemisphere, subgenual cingulate cortex (SCC – BA25) in the ventromedial PFC and lateral orbitofrontal cortex (OFC – BA47) had the highest likelihood of amygdala connectivity followed by ventral medial OFC (BA11) and dorsomedial PFC (dmPFC – BA10) (see Table 3 for independent t-test results and Figure 3 for boxplots comparing maximum likelihood of white matter connectivity between regions). The areas that showed the lowest likelihood of amygdala connectivity across both hemispheres were dorsolateral PFC (dlPFC – BA9), dorsal cingulate cortex (dACC – BA24 and BA32). These results suggest that, as hypothesized, amygdala white matter connectivity was more likely in the PFC regions where non-human primate literature supported amygdala connectivity (i.e., subgenual cingulate, OFC, dmPFC) and less likely where previous research has observed less connectivity (dlPFC). Contrary to our hypothesis, however, amygala connectivity with dACC regions was significantly less than the subgenual cingulate, OFC, and dmPFC regions. These results elucidate the heterogeneity of amygdala connectivity across major regions of the PFC which contributes to a finer grain understanding of the structure-function relation in these emotion processing regions.
Table 3:
Results of the Welch’s independent sample t-tests comparing the maximum likelihood of white matter connectivity with the amygdala for the seven prefrontal cortex (PFC) regions. This table provides an approximate ranking of probability of white matter connectivity.
| Left Hemisphere Comparisons1 | ||||||
|---|---|---|---|---|---|---|
| Region | BA32 | BA9 | BA24 | BA10 | BA11 | BA47 |
| BA25 | t(141.24)=15.45 | t(141.02)=15.57 | t(142.07)=15.20 | t(154.68)=14.01 | t(184.63)=11.85 | t(177.83)=11.39 |
| BA47 | t(148.99)=8.84 | t(147.43)=9.16 | t(154.98)=8.15 | t(233.33)=5.10 | t(277.93)=1.16 (ns) | |
| BA11 | t(147.56)=6.56 | t(146.25)=6.85 | t(152.61)=5.95 | t(221.54)=3.41 | ||
| BA10 | t(163.39)=4.63 | t(159.37)=5.13 | t(178.57)=3.58 | |||
| BA24 | t(263.43)=2.10(ns) | t(251.31)=3.23 | ||||
| BA9 | t(277.49)=−1.24 (ns) | |||||
| BA32 | ||||||
| Right Hemisphere Comparisons1 | ||||||
| Region | BA32 | BA9 | BA24 | BA10 | BA11 | BA47 |
| BA25 | t(142.51)=13.43 | t(142.5)=13.45 | t(142.04)=13.48 | t(229.85)=6.12 | t(271.05)=2.64 (ns) | t(278.73)=−1.05(ns) |
| BA47 | t(142.19)=13.99 | t(142.19)=14.02 | t(141.78)=14.05 | t(220.73)=7.08 | t(264)=3.68 | |
| BA11 | t(143.63)=12.00 | t(143.62)=12.03 | t(142.95)=12.06 | t(255.19)=3.60 | ||
| BA10 | t(146.9)=10.40 | t(146.89)=10.44 | t(145.62)=10.49 | |||
| BA24 | t(277.07)=−0.34(ns) | t(277.11)=−0.13(ns) | ||||
| BA9 | t(280)=−0.20 (ns) | |||||
| BA32 | ||||||
Bonferroni corrected at the hemisphere level (.05/21 tests per hemisphere – p < 0.002).
Figure 3:

Comparison of the maximum likelihood of amygdala white matter connectivity across the seven prefrontal cortex (PFC) Brodmann’s Areas. These plots provide an approximate ranking of probability of white matter connectivity. Significant differences in maximum likelihood of amygdala connectivity are denoted by a *.
We tested for potential associations between the maximum-likelihood of amygdala-PFC white matter connectivity and demographic variables (gender, pubertal status, annual income) as well as level of internalizing symptoms (MFQ and SCARED sum scores). There were no significant correlations between amygdala-PFC white matter connectivity and the listed covariates when using a Bonferroni-corrected threshold of p<0.003 (0.05/14 total tests per variable). When using a more liberal p<0.05 threshold, pubertal development was positively correlated with amygdala-BA32 connectivity in the right hemisphere (r(140) = 0.17, p=0.04), and there was a gender difference in left amygdala-BA24 connectivity (t(113.34) = 2.49, p = 0.01) and right amygdala-BA25 connectivity (t(136.15) = 2.38, p = 0.02) with females having a higher likelihood of white matter connectivity. There were no associations with internalizing symptoms or annual income at the more liberal p<0.05 threshold.
Increased maximum likelihood of amygdala-PFC white matter connectivity was related to attenuated amygdala reactivity driven by the OFC and dmPFC.
Task-Related Amygdala Activation.
To ensure that the Faces Task engaged the amygdala as expected, we confirmed that there was a main effect of task for the threat (fear & angry faces) > baseline contrast in both the left (t = 19.08, p < 0.0001, MNI Coordinates = −24, - 2, −12) and right hemispheres (t = 16.25, p < 0.0001, MNI Coordinates = 22, 0, −12). The p-values reported in this section have been corrected for multiple comparisons using family-wise error (FWE) correction.
Full Model Estimation.
Consistent with our hypothesis, the ridge regression model with the maximum likelihood of white matter connectivity between seven regions of the PFC and the ipsilateral amygdala significantly predicted ipsilateral amygdala activation better than chance in both hemispheres. For the left hemisphere model (mean α=0.1), MSE for the full model was 0.29, p = 0.006 (Figure 4) compared to the mean MSE from the randomized permutations of 0.32, meaning that our model fit the data better than the scrambled data. The mean extracted contrast value for threat faces (fearful & angry) compared to baseline in the left amygdala was 0.795 (SD = 0.548). The observed amygdala activation values and those predicted from the full model were significantly correlated using Pearson’s R (r(139) = 0.372, p = 0.000) (see Figure 5. For the right hemisphere (mean α=0.1), MSE for the full model was 0.33, p = 0.001 (Figure 4) compared to the mean MSE from the randomized permutations of 0.39. The mean extracted contrast value for threat faces compared to baseline in the right hemisphere was 0.850 (SD = 0.603). Additionally, the observed amygdala activation values and those predicted from the full model were significantly correlated using Pearson’s R (r(139) = 0.417, p = 0.000) (see Figure 5). These results suggest that increased overall likelihood of amygdala-PFC white matter connectivity was related to attenuated amygdala reactivity. These results held when controlling for gender, pubertal development, family income, and internalizing symptoms (Right Hemisphere: MSE=0.34, p=0.002; Left Hemisphere: MSE=0.29, p=0.014). The next step was to examine if there were specific PFC regions that were driving this association.
Figure 4:
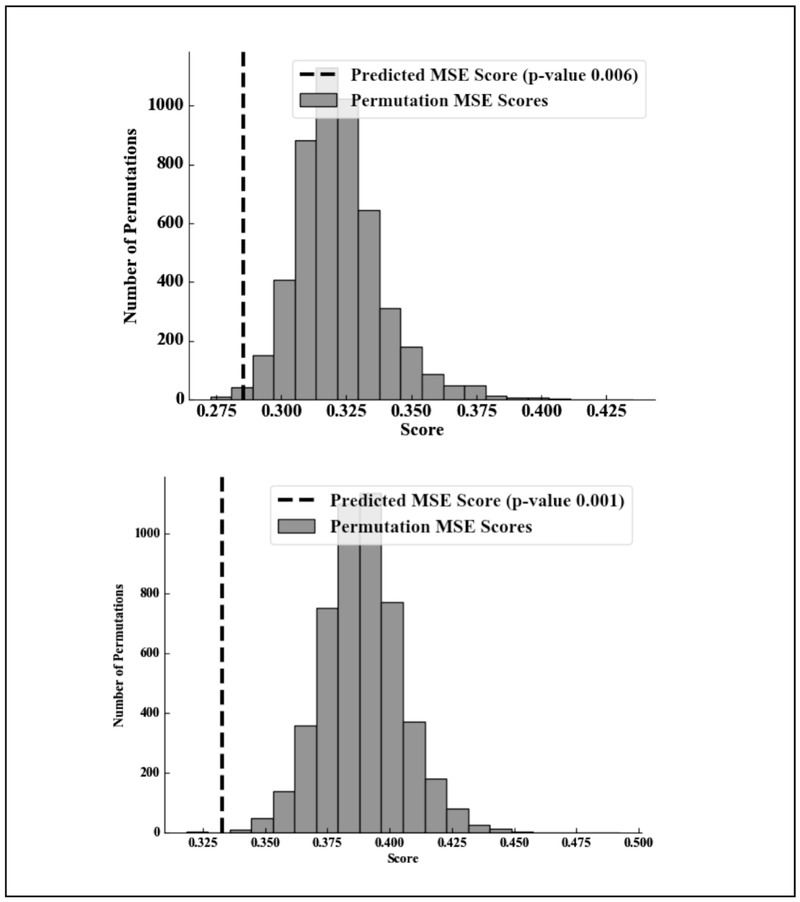
Figure comparing mean squared error (MSE) for the specified model compared to the MSE for the models fit using random permutations. Top: Threat amygdala activation (left) predicted by prefrontal probabilistic tractography; Bottom: Threat amygdala activation (right) predicted by prefrontal probabilistic tractography. P-values are calculated based on the percentage of random permutations that fit the data better than the hypothesized model.
Figure 5:

Correlation between the observed amygdala activation to threat vs. predicted amygdala activation based on the model where the seven prefrontal cortex (PFC) Brodmann’s Areas predict amygdala activation to threat. Top: Left Hemisphere; Bottom: Right Hemisphere.
Reliable Predictors.
Based on the above chance predictive capabilities of the full models for both the left and right hemispheres, each predictor was evaluated to determine if they reliably contributed to the full model using the 95% confidence intervals outlined in the methods section (see Table 4 for the median coefficient value and the 95% CI for each predictor and Figure 6 for scatterplot). For the right hemisphere, the maximum likelihood of white matter connectivity between the amygdala and lateral OFC (BA47) and the amygdala and dmPFC (BA10) were the most reliable contributors to the full model. For the left hemisphere, the maximum likelihood of white matter connectivity between the amygdala and dmPFC (BA10) and the amygdala and ventral medial OFC (BA11) were the most reliable contributors to the full model. Overall, these results suggest that increased likelihood of amygdala-PFC connectivity was related to amygdala inhibition and that this association as driven by the dmPFC and OFC.
Table 4:
Mean coefficient values and 95% confidence intervals for the bootstrapping significance test of reliable predictors of functional amygdala activation by amygdala white matter connectivity.
| Left Hemisphere | |
|---|---|
| BA9 | −16.71 [−103.57 6.78] |
| BA10* | −7.35 [−28.29 −2.93] |
| BA11* | −3.67 [−10.00 −0.10] |
| BA24 | −6.52 [−36.01 6.00] |
| BA25 | −0.43 [−2.23 0.51] |
| BA32 | 2.30 [−50.54 28.20] |
| BA47 | 0.70 [−6.74 4.82] |
| Right Hemisphere | |
| BA9 | −6.28 [−28.89 5.68] |
| BA10* | −2.15 [−5.60 −0.42] |
| BA11 | −0.36 [−2.75 0.94] |
| BA24 | −1.28 [−29.05 8.32] |
| BA25 | −0.15 [−1.83 0.86] |
| BA32 | 1.13 [−23.68 12.06] |
| BA47* | −1.79 [−4.19 −0.90] |
Denotes reliable contributor to hemisphere specific full model predicting amygdala activation from amygdala white matter connectivity with the 7 prefrontal cortex (PFC) regions.
Figure 6:

Graphs depicting the zero-order correlations between the reliable Brodmann’s Areas (BAs) and ipsilateral amygdala activation to threat. To assess which tracts were reliably contributing to the full model we used a bootstrapping procedure where the data was split into training and tests datasets 1000 times with 80% of the cases assigned to the training set and 20% assigned to the test data set. This allowed for the creation of 1000 independent models with beta weights for each of the connectivity values for the seven amygdala-prefrontal cortex seed-target pairs. This provided a 95% confidence interval (CI) for each predictor. Predictors were reliable contributors if their 95% CI did not include zero. Top: Left BA 10 and Left BA 11; Bottom: Right BA 10 and Right BA 47.
Secondary Analyses
As a secondary analysis, we determined that the same PFC regions remained unique predictors of amygdala reactivity to threat faces when controlling for gender, pubertal development, and symptoms of internalizing disorders. The added covariates were not significant predictors of amygdala reactivity as part of the full model. When we added annual income as a covariate in the model, it was not a significant predictor of amygdala reactivity to threat faces; however, one predictor in each hemisphere (left BA11 and right BA10) was no longer uniquely predicting a significant amount of variance in amygdala reactivity.
To determine whether our results were specific to amygdala reactivity to threat faces, we tested whether amygdala-PFC white matter connectivity was associated with amygdala reactivity to happy and sad faces. We found that the models were significant in both hemispheres for happy faces (Left Hemisphere: MSE = 0.15, p=0.013; Right Hemisphere: MSE=0.23, p=0.019) when controlling for gender, pubertal development, and internalizing symptoms. Additionally, we found that amygdala-PFC white matter connectivity was associated with amygdala reactivity to sad faces in the right hemisphere (MSE=0.17, p=0.006), but not the left (controlling for gender, pubertal development, and internalizing symptoms). We then determined which PFC regions were unique predictors of amygdala reactivity using the same bootstrapping procedures to build a 95% confidence interval for the significant models. Similar to the findings for threat faces, in the right hemisphere, the maximum likelihood of white matter connectivity between the amygdala and lateral OFC (BA47) (95% CI: −3.52 −0.45) and the amygdala and dmPFC (BA10) (95% CI: −4.67 −0.30) were reliable contributors to the full model. For the left hemisphere, white matter connectivity with the dmPFC was the only tract that was a reliable predictor of amygdala reactivity to happy faces (95 CI: −24.00 −2.24). The model predicting amygdala reactivity to sad faces was only significant in the right hemisphere and the lateral OFC (BA47) (95% CI: −2.15 −0.16) and dorsolateral PFC (BA9) (95% CI: −35.66 −1.49) were reliable predictors. Thus, amygdala connectivity with BA47 in the right hemisphere broadly predicted amygdala reactivity to emotional faces, whereas amygdala connectivity with bilateral BA10 and left BA11 did not.
Discussion
The present investigation provided two main findings. First, the amygdala had widespread white matter connectivity with most regions of the PFC (BA9, BA10, BA11, BA24, BA25, BA32, BA47), but the degree of connectivity among these regions differed substantially. Specifically, subgenual cingulate (BA25), orbitofrontal (BA11, BA47), and dorsomedial (BA10) regions of the PFC had greater connectivity with the amygdala relative to the dorsolateral (BA9) region and, contrary to our original hypothesis, the dorsal cingulate (BA24, BA32) regions. This study is the first, to our knowledge, to quantify and compare patterns of amygdala white matter connectivity across the PFC in humans, providing a roadmap that charts white matter tracts between these emotion-relevant regions in a relatively large sample of adolescents. Second, in relating microstructural differences in white matter connectivity to amygdala function using a machine-learning ridge regression algorithm, we found that greater amygdala-PFC white matter connectivity related to attenuation of amygdala activation in response to threatening facial stimuli. Specifically, greater white matter connectivity between the amygdala and dmPFC (BA10) and OFC (BA11) in the left hemisphere and with the dmPFC and lateral OFC (BA47) in the right hemisphere related to reduced amygdala activation. Moreover, these findings were not due to gender, pubertal development, or current internalizing symptoms. The present findings indicate that amydala white matter connectivity with these dorsomedial and orbital PFC structures may be involved in the regulation of the amygdala.
Our examination of variability in amygdala white matter connectivity across subregions of the PFC yielded findings that compliment and augment those from non-human primate neural tract-tracer studies (Ongür, Ferry, & Price, 2003). In non-human primates, the amygdala has substantial connections to the subgenual cingulate (SCC – BA25) and dmPFC (BA10), as well as the OFC (BA11, BA47) and the dACC (BA24, BA32) (Amaral & Price, 1984; Barbas, 2015; Ghashghaei et al., 2007; D. Ongür & Price, 2000). Indirect connections from the OFC, dmPFC, and dlPFC to the amygdala have also been documented in non-human primates and are posited to pass through waystation regions in the cingulate cortex (BA25 and BA24) (Price, 2006; Ray & Zald, 2012). Complementing these findings, we found that the SCC, OFC, and dmPFC displayed greater connectivity with the amygdala compared to dorsolateral PFC regions. In addition, consistent with non-human primate work (Ray & Zald, 2012; Stefanacci & Amaral, 2002), we found that amygdala white matter connectivity was less likely in the dlPFC (BA9). Interestingly, in contrast to the non-human primate work, amygdala white matter connectivity with the dACC was less likely than the SCC, OFC, and dmPFC in our community sample of 15-17 year olds. Amygdala-PFC white matter microstructure continues to develop through early adulthood (Huttenlocher & Dabholkar, 1997; Yeatman, Wandell, & Mezer, 2014), so perhaps, amygdala connectivity with the dACC will continue to strengthen as our sample matures. Alternatively, it is possible that the white matter microstructure seen in non-human primates is not conserved in humans due to gray and white matter differences (Donahue, Glasser, Preuss, Rilling, & Essen, 2018). Clarifying this discrepancy is an important avenue for future research.
Overall, amygdala-PFC connectivity was not associated with our measures assessing current symptoms of internalizing disorders (MFQ and SCARED sum scores) or with current annual income. However, there were some small differences associated with gender and pubertal development. We found that amygdala-BA32 connectivity was positively associated with pubertal development in the right hemisphere and there was a gender difference in amygdala-BA24 connectivity in the left hemisphere and in amygdala-BA25 connectivity in the right hemisphere with females having a higher likelihood of connectivity. These are not surprising given that previous work has identified gender differences and differences related to pubertal development in amygdala reactivity (Moore et al., 2012; Tahmasebi et al., 2012) and in the amygdala’s structural connections with other regions of the brain (Hasan et al., 2009; Hein et al., 2018). Future research unpacking the associations seen with gender and pubertal development, perhaps utilizing longitudinal imaging data, would greatly contribute to our understanding of this critical circuit. In contrast to the present findings in an adolescent sample, previous research has found that differences in amygdala-PFC connectivity were associated with trait anxiety in adults (Greening & Mitchell, 2015). Perhaps an association with symptoms of anxiety and depression will develop as this sample develops into adulthood or our results differ based on our sample composition (i.e., a well-sampled community cohort). Additionally, amygdala-PFC connectivity was not associated with current family income. Future research using a more robust, potentially longitudinal, measure of socioeconomic status (SES) would be important given the many SES-related changes in brain development that have been found in previous studies (e.g. Brito & Noble, 2014; Hackman & Farah, 2009).
Our finding that greater amygdala-PFC white matter connectivity was related to decreased amygdala reactivity to threatening faces controlling for gender, pubertal development, and symptoms of internalizing disorders supports theories suggesting the PFC plays a role in behavioral regulation (Casey, 2015; Phillips, Ladouceur, & Drevets, 2008). In these theories, the PFC is posited to regulate or suppress output from the amygdala to control emotional responses. Findings from the present study were consistent with multimodal imaging studies which found that the structural integrity of large white matter structures, such as the uncinate fasciculus, were associated with amygdala reactivity (Hein et al., 2018; Kim & Whalen, 2009; Swartz et al., 2014). Additionally, our results compliment dMRI studies linking weaker amygdala-PFC white matter connectivity with increased trait anxiety, a characteristic associated with increased amygdala activation (Eden et al., 2015; Greening & Mitchell, 2015; Jalbrzikowski et al., 2017; Kim & Whalen, 2009).
Interestingly, amygdala-PFC white matter connectivity several, but not all PFC regions, was not uniquely related to amygdala reactivity to threat, but rather more broadly to amygdala reactivity to emotional faces. We found similar patterns in the associations between white matter connectivity and amygdala reactivity to happy faces relative to threat faces, suggesting some generalization to broader emotion processing. However, a different pattern of findings were seen when examining amygdala reactivity to sad faces. Specifically, amygdala-dorsolateral PFC, not dmPFC and amygdala-OFC, white matter connectivity related to amygdala reactivity to sad faces selectively in the right hemisphere, but not bilaterally. Previous research has shown that the amygdala is reactive to a wide array of emotional faces (Somerville, Kim, Johnstone, Alexander, & Whalen, 2004; van den Bulk et al., 2013), suggesting that there is no reason that the tracts studied here should only shape amygdala reactivity to threat. Rather, they may more broadly guide the regulation of emotion (Cunningham, Van Bavel, & Johnsen, 2008; Janak & Tye, 2015). Future research may wish to more fully examine common and distinct patterns in amygdala-PFC white matter connectivity and amygdala activation to different emotional faces.
Through the combination of probabilistic tractography and fMRI, we found that amygdala white matter connectivity with PFC regions that are posited to be involved in sensory integration – dmPFC and OFC – were uniquely associated with attenuated functional amygdala activation, which compliments current theoretical models of implicit emotion processing (Barbas, 2015; Ray & Zald, 2012). In models of implicit emotion processing, the dmPFC and OFC have direct and indirect, bidirectional connections with the amygdala and influence amygdala regulation through the integration of internal and external sensory information thus influencing the control of attention (Banks, Eddy, Angstadt, Nathan, & Phan, 2007; Barbas, 2015; Eden et al., 2015; Phillips et al., 2008; Ray & Zald, 2012). Interpreting our results through the lens of this model where automatic regulation of the amygdala is facilitated by the dmPFC and OFC, increased amygdala connectivity with the dmPFC and OFC may relate to more efficient communication with regions responsible for sensory integration. More efficient amygdala-dmPFC and amygdala-OFC communication may then increase attentional control and facilitate the regulation of the amygdala (Barbas, 2015; Phillips et al., 2008).
Models of the neural underpinnings of emotion regulation suggest that the SCC plays a primary inhibitory role in the regulation of the amygdala due to the large number of direct neural connections with the amygdala (Quirk & Beer, 2006; Ray & Zald, 2012). Although the present study found strong amygdala white matter connectivity with the SCC, the degree of connectivity did not account for a significant amount of variability in amygdala reactivity. In non-human primates, communication between the sensory integration regions and the amygdala is facilitated by direct amygdala connections and by indirect connections that pass through waystation regions, such as the SCC (Carmichael & Price, 1996; Price, 2006; Ray & Zald, 2012). Considering that the present probabilistic tractography analysis cannot discriminate between direct and indirect connections, white matter tracts detected from the dmPFC and OFC may have passed through the SCC on their way to the amygdala. Thus, consistent with the non-human primate work, the present study found a high level of microstructural connectivity between the amygdala and SCC; however, it is connectivity from the dmPFC and OFC, possibly passing through the SCC, that contribute to variation in amygdala activation.
There are a few limitations to the present work. First, due to the population sampling used in the FFCWS study (i.e., participants were not selected based on their ability or willingness to undergo an MRI), a relatively large number of our participants (N=44) were either not eligible or chose not to participate in the MRI (N=31), or were unable to complete the full session (N=13). Additionally, due to the multi-modal approach, 27 participants were also excluded based on data quality for both fMRI and the dMRI. Despite these limitations, our sample size is considerably larger than most studies examining the relationship between structure and function in the amygdala-PFC circuit. Additionally, the demographic characteristics of the included vs. total recruited sample for this analysis were not statistically different, which suggests that we were not excluding participants with potentially salient demographic differences. Further, our sample contained substantial representation of Black/African American youth and families living in low SES contexts, populations often missing in neuroimaging research (Falk et al., 2013). This is a strength of our study; however, it may limit the generalizability of this study to other populations.
A second limitation of the present study is that this multimodal analysis was correlational and thus we cannot determine either direction of influence of the amygdala-PFC association or if this association could be explained by an unmeasured variable. We provisionally place our results in the context of the PFC regulating the amygdala; however, it is also tenable that the direction of influence may be reversed (e.g. stronger input from the amygdala may improve sensory integration in the PFC). Additionally, previous research identified regions outside of the PFC that may influence emotion, emotion regulation, and related traits, such as anxiety. These regions include the thalamus, hippocampus, insula, and midbrain (Castagna et al., 2018; Silvers et al., 2017), areas that we did not examine in the present study. A logical avenue for future research would be to work towards understanding the direction, or directions, of influence in this circuit and how connections with other regions of the brain may affect amygdala function perhaps utilizing an effective functional connectivity analysis approach. Third, the relation between structural connections and functional variability in the amygdala was examined during only one emotion processing task. Future research could examine the relation between amygdala-PFC structural connectivity and variability in amygdala functional activation during other emotion regulation tasks to determine how that influences the structure-function association. Finally, we know that prefrontal cortex white matter continues to develop into adulthood (Mills et al., 2016), so it is not possible for the present study to make claims regarding how amygdala-PFC white matter relates to amygdala function in adults based on our adolescent sample. An excellent avenue for future research would be to acquire longitudinal diffusion and functional MRI data following adolescents into early adulthood (Casey et al., 2018). This analysis would allow for the analysis of the development of these white matter pathways and how their development relates to amygdala function in adulthood.
In conclusion, using probabilistic tractography, the present study mapped the widespread white matter between the amygdala and PFC. We found greater connectivity between the amygdala and the subgenual cingulate, orbitofrontal, and dorsomedial regions of the PFC compared to the dorsal cingulate and dorsolateral regions. Additionally, by using a machinelearning regression approach, we found that overall, greater maximum likelihood of amygdala-PFC white matter connectivity was associated with attenuation of functional amygdala activation to threatening facial stimuli. This relation was driven by amygdala white matter connectivity with the OFC and dmPFC – areas of the PFC posited to be responsible for sensory integration of internal and external stimuli during automatic emotion processing (Barbas, 2015; Phillips et al., 2008). To our knowledge, the present study is the first to precisely map and compare amygdala white matter connectivity across the PFC in humans. Further, we put forth novel evidence that amygdala white matter connectivity with regions of the PFC involved in sensory integration may play a role in regulation of the amygdala. By examining the association between specific amygdala-PFC tracts and amygdala activation, the present work helped to elucidate the nature of this emotion-based circuit.
Acknowledgements:
We would like to acknowledge the past work of the Fragile Families and Child Wellbeing Study, the families for sharing their experiences with us, and the project staff for making the study possible. Lastly, we would like to thank Bennet Fauber for his computer savvy and assistance.
Funding: The research reported in this paper was supported by grants from the National Institutes of Health, R01MH103761 (Monk), T32HD007109 (McLoyd & Monk), and S10OD012240 (Noll), as well as a Doris Duke Fellowship for the Promotion of Child Well-Being (Hein).
Footnotes
Conflicts of Interest: The authors declare no competing financial interests.
Publisher's Disclaimer: This is a PDF file of an unedited manuscript that has been accepted for publication. As a service to our customers we are providing this early version of the manuscript. The manuscript will undergo copyediting, typesetting, and review of the resulting proof before it is published in its final citable form. Please note that during the production process errors may be discovered which could affect the content, and all legal disclaimers that apply to the journal pertain.
References
- Amaral DG, & Price JL (1984). Amygdalo-cortical projections in the monkey (Macaca fascicularis). The Journal of Comparative Neurology, 230(4), 465–496. 10.1002/cne.902300402 [DOI] [PubMed] [Google Scholar]
- Angold A, Costello EJ, Pickles A, & Winder F (1987). The development of a questionnaire for use in epidemiological studies of depression in children and adolescents. London: Medical Research Council Child Psychiatry Unit. [Google Scholar]
- Banks SJ, Eddy KT, Angstadt M, Nathan PJ, & Phan KL (2007). Amygdala-frontal connectivity during emotion regulation. Social Cognitive and Affective Neuroscience, 2(4), 303–312. 10.1093/scan/nsm029 [DOI] [PMC free article] [PubMed] [Google Scholar]
- Barbas H (2015). General Cortical and Special Prefrontal Connections: Principles from Structure to Function. Annual Review of Neuroscience, 38(1), 269–289. 10.1146/annurev-neuro-071714-033936 [DOI] [PubMed] [Google Scholar]
- Behrens TEJ, Berg HJ, Jbabdi S, Rushworth MFS, & Woolrich MW (2007). Probabilistic diffusion tractography with multiple fibre orientations: What can we gain? Neuroimage, 34(1), 144–155. 10.1016/j.neuroimage.2006.09.018 [DOI] [PMC free article] [PubMed] [Google Scholar]
- Behrens TEJ, Johansen-Berg H, Woolrich MW, Smith SM, Wheeler-Kingshott C. a. M. Boulby PA, … Matthews PM (2003). Non-invasive mapping of connections between human thalamus and cortex using diffusion imaging. Nature Neuroscience, 6(7), 750–757. 10.1038/nn1075 [DOI] [PubMed] [Google Scholar]
- Behrens TEJ, Woolrich MW, Jenkinson M, Johansen-Berg H, Nunes RG, Clare S, … Smith SM (2003). Characterization and propagation of uncertainty in diffusion-weighted MR imaging. Magnetic Resonance in Medicine, 50(5), 1077–1088. 10.1002/mrm.10609 [DOI] [PubMed] [Google Scholar]
- Birmaher B, Khetarpal S, Brent D, Cully M, Balach L, Kaufman J, & Neer SM (1997). The Screen for Child Anxiety Related Emotional Disorders (SCARED): scale construction and psychometric characteristics. Journal of the American Academy of Child and Adolescent Psychiatry, 36(4), 545–553. 10.1097/00004583-199704000-00018 [DOI] [PubMed] [Google Scholar]
- Brett M, Anton J-L, Valabregue R, & Poline J-B (2002). Region of interest analysis using the MarsBar toolbox for SPM 99. Neuroimage, 16(2), S497. [Google Scholar]
- Brito NH, & Noble KG (2014). Socioeconomic status and structural brain development. Frontiers in Neuroscience, 8 10.3389/fnins.2014.00276 [DOI] [PMC free article] [PubMed] [Google Scholar]
- Carmichael ST, & Price JL (1996). Connectional networks within the orbital and medial prefrontal cortex of macaque monkeys. The Journal of Comparative Neurology, 371(2), 179–207. 10.1002/(SICI)1096-9861(19960722)371:2<179::AID-CNE1>3.0.CO;2-# [DOI] [PubMed] [Google Scholar]
- Casey BJ (2015). Beyond Simple Models of Self-Control to Circuit-Based Accounts of Adolescent Behavior. Annual Review of Psychology, 66(1), 295–319. 10.1146/annurev-psych-010814-015156 [DOI] [PubMed] [Google Scholar]
- Casey BJ, Cannonier T, Conley MI, Cohen AO, Barch DM, Heitzeg MM, … Dale AM (2018). The Adolescent Brain Cognitive Development (ABCD) study: Imaging acquisition across 21 sites. Developmental Cognitive Neuroscience, 32, 43–54. 10.1016/j.dcn.2018.03.001 [DOI] [PMC free article] [PubMed] [Google Scholar]
- Casey BJ, Duhoux S, & Cohen MM (2010). Adolescence: What do Transmission, Transition, and Translation have to do with it? Neuron, 67(5), 749–760. 10.1016/j.neuron.2010.08.033 [DOI] [PMC free article] [PubMed] [Google Scholar]
- Castagna PJ, Roye S, Calamia M, Owens-French J, Davis TE, & Greening SG (2018). Parsing the neural correlates of anxious apprehension and anxious arousal in the grey-matter of healthy youth. Brain Imaging and Behavior, 12(4), 1084–1098. 10.1007/s11682-017-9772-1 [DOI] [PubMed] [Google Scholar]
- Cunningham WA, Van Bavel JJ, & Johnsen IR (2008). Affective Flexibility: Evaluative Processing Goals Shape Amygdala Activity. Psychological Science, 19(2), 152–160. 10.1111/j.1467-9280.2008.02061.x [DOI] [PubMed] [Google Scholar]
- Donahue CJ, Glasser MF, Preuss TM, Rilling JK, & Essen DCV (2018). Quantitative assessment of prefrontal cortex in humans relative to nonhuman primates. Proceedings of the National Academy of Sciences, 201721653 10.1073/pnas.1721653115 [DOI] [PMC free article] [PubMed] [Google Scholar]
- Eden AS, Schreiber J, Anwander A, Keuper K, Laeger I, Zwanzger P, … Dobel C (2015). Emotion regulation and trait anxiety are predicted by the microstructure of fibers between amygdala and prefrontal cortex. The Journal of Neuroscience: The Official Journal of the Society for Neuroscience, 35(15), 6020–6027. 10.1523/JNEUROSCI.3659-14.2015 [DOI] [PMC free article] [PubMed] [Google Scholar]
- Eickhoff SB, Jbabdi S, Caspers S, Laird AR, Fox PT, Zilles K, & Behrens TEJ (2010). Anatomical and functional connectivity of cytoarchitectonic areas within the human parietal operculum. The Journal of Neuroscience: The Official Journal of the Society for Neuroscience, 30(18), 6409–6421. 10.1523/JNEUROSCI.5664-09.2010 [DOI] [PMC free article] [PubMed] [Google Scholar]
- Ekman P, & Friesen WV (1975). Pictures of facial affect. consulting psychologists press. [Google Scholar]
- Etkin A, Buchel C, & Gross JJ (2015). The neural bases of emotion regulation. Nature Reviews. Neuroscience, 16(11), 693–700. 10.1038/nrn4044 [DOI] [PubMed] [Google Scholar]
- Falk EB, Hyde LW, Mitchell C, Faul J, Gonzalez R, Heitzeg MM, … Schulenberg J (2013). What is a representative brain? Neuroscience meets population science. Proceedings of the National Academy of Sciences, 110(44), 17615–17622. 10.1073/pnas.1310134110 [DOI] [PMC free article] [PubMed] [Google Scholar]
- Ghashghaei HT, Hilgetag CC, & Barbas H (2007). Sequence of information processing for emotions based on the anatomic dialogue between prefrontal cortex and amygdala. NeuroImage, 34(3), 905–923. 10.1016/j.neuroimage.2006.09.046 [DOI] [PMC free article] [PubMed] [Google Scholar]
- Glover GH, & Law CS (2001). Spiral-in/out BOLD fMRI for increased SNR and reduced susceptibility artifacts. Magnetic Resonance in Medicine, 46(3), 515–522. [DOI] [PubMed] [Google Scholar]
- Greening SG, & Mitchell DGV (2015). A network of amygdala connections predict individual differences in trait anxiety. Human Brain Mapping, 36(12), 4819–4830. 10.1002/hbm.22952 [DOI] [PMC free article] [PubMed] [Google Scholar]
- Hackman DA, & Farah MJ (2009). Socioeconomic status and the developing brain. Trends in Cognitive Sciences, 13(2), 65–73. 10.1016/j.tics.2008.11.003 [DOI] [PMC free article] [PubMed] [Google Scholar]
- Hasan KM, Iftikhar A, Kamali A, Kramer LA, Ashtari M, Cirino PT, … Ewing-Cobbs L (2009). Development and aging of the healthy human brain uncinate fasciculus across the lifespan using diffusion tensor tractography. Brain Research, 1276, 67–76. 10.1016/j.brainres.2009.04.025 [DOI] [PMC free article] [PubMed] [Google Scholar]
- Hein TC, Mattson WI, Dotterer HL, Mitchell C, Thomason ME, Peltier SJ, … Monk CS (2018). Amygdala Habituation and Uncinate Fasciculus Connectivity in Adolescence: a Multi-Modal Approach. NeuroImage. [DOI] [PMC free article] [PubMed] [Google Scholar]
- Hernández M, Guerrero GD, Cecilia JM, Garcia JM, Inuggi A, Jbabdi S, … Sotiropoulos SN (2013). Accelerating Fibre Orientation Estimation from Diffusion Weighted Magnetic Resonance Imaging Using GPUs. PLOS ONE, 8(4), e61892 10.1371/journal.pone.0061892 [DOI] [PMC free article] [PubMed] [Google Scholar]
- Hernandez-Fernandez M, Reguly I, Giles M, Jbabdi S, Smith SM, & Sotiropoulos SN (2016). A fast and flexible toolbox for tracking brain connections in diffusion MRI datasets using GPUs Presented at the 22nd Annual Meeting of the Organization for Human Brain Mapping (OHBM), Geneva, Switzerland. [Google Scholar]
- Hoerl AE, & Kennard RW (1970). Ridge regression: Biased estimation for nonorthogonal problems. Technometrics, 12(1), 55–67. [Google Scholar]
- Huttenlocher PR, & Dabholkar AS (1997). Regional differences in synaptogenesis in human cerebral cortex. The Journal of Comparative Neurology, 387(2), 167–178. 10.1002/(SICI)1096-9861(19971020)387:2<167::AID-CNE1>3.0.CO;2-Z [DOI] [PubMed] [Google Scholar]
- Jalbrzikowski M, Larsen B, Hallquist MN, Foran W, Calabro F, & Luna B (2017). Development of White Matter Microstructure and Intrinsic Functional Connectivity Between the Amygdala and Ventromedial Prefrontal Cortex: Associations With Anxiety and Depression. Biological Psychiatry, 82(7), 511–521. 10.1016/j.biopsych.2017.01.008 [DOI] [PMC free article] [PubMed] [Google Scholar]
- Janak PH, & Tye KM (2015). From circuits to behaviour in the amygdala. Nature, 517(7534), 284–292. 10.1038/nature14188 [DOI] [PMC free article] [PubMed] [Google Scholar]
- Jenkinson M, & Smith S (2001). A global optimisation method for robust affine registration of brain images. Medical Image Analysis, 5(2), 143–156. [DOI] [PubMed] [Google Scholar]
- Jenkinson M, Bannister P, Brady M, & Smith S (2002). Improved optimization for the robust and accurate linear registration and motion correction of brain images. NeuroImage, 17(2), 825–841. [DOI] [PubMed] [Google Scholar]
- Jenkinson Mark, Beckmann CF, Behrens TEJ, Woolrich MW, & Smith SM (2012). FSL. NeuroImage, 62(2), 782–790. 10.1016/j.neuroimage.2011.09.015 [DOI] [PubMed] [Google Scholar]
- Johansen-Berg H, Behrens TEJ, Robson MD, Drobnjak I, Rushworth MFS, Brady JM, … Matthews PM (2004). Changes in connectivity profiles define functionally distinct regions in human medial frontal cortex. Proceedings of the National Academy of Sciences of the United States of America, 101(36), 13335–13340. 10.1073/pnas.0403743101 [DOI] [PMC free article] [PubMed] [Google Scholar]
- Jones DK, Knosche TR, & Turner R (2013). White matter integrity, fiber count, and other fallacies: the do’s and don’ts of diffusion MRI. NeuroImage, 73, 239–254. 10.1016/j.neuroimage.2012.06.081 [DOI] [PubMed] [Google Scholar]
- Kim MJ, & Whalen PJ (2009). The structural integrity of an amygdala-prefrontal pathway predicts trait anxiety. The Journal of Neuroscience : The Official Journal of the Society for Neuroscience, 29(37), 11614–11618. 10.1523/JNEUROSCI.2335-09.2009 [DOI] [PMC free article] [PubMed] [Google Scholar]
- Lenroot RK, & Giedd JN (2006). Brain development in children and adolescents: insights from anatomical magnetic resonance imaging. Neuroscience and Biobehavioral Reviews, 30(6), 718–729. 10.1016/j.neubiorev.2006.06.001 [DOI] [PubMed] [Google Scholar]
- Maldjian JA, Laurienti PJ, Kraft RA, & Burdette JH (2003). An automated method for neuroanatomic and cytoarchitectonic atlas-based interrogation of fMRI data sets. NeuroImage, 19(3), 1233–1239. [DOI] [PubMed] [Google Scholar]
- Mills KL, Goddings A-L, Herting MM, Meuwese R, Blakemore S-J, Crone EA, … Tamnes CK (2016). Structural brain development between childhood and adulthood: Convergence across four longitudinal samples. NeuroImage, 141, 273–281. 10.1016/j.neuroimage.2016.07.044 [DOI] [PMC free article] [PubMed] [Google Scholar]
- Monk CS, Telzer E, Mogg K, & et al. (2008). Amygdala and ventrolateral prefrontal cortex activation to masked angry faces in children and adolescents with generalized anxiety disorder. Archives of General Psychiatry, 65(5), 568–576. 10.1001/archpsyc.65.5.568 [DOI] [PMC free article] [PubMed] [Google Scholar]
- Moore WE, Pfeifer JH, Masten CL, Mazziotta JC, Iacoboni M, & Dapretto M (2012). Facing puberty: associations between pubertal development and neural responses to affective facial displays. Social Cognitive and Affective Neuroscience, 7(1), 35–43. 10.1093/scan/nsr066 [DOI] [PMC free article] [PubMed] [Google Scholar]
- Ojala M, & Garriga GC (2010). Permutation tests for studying classifier performance. Journal of Machine Learning Research, 11(Jun), 1833–1863. [Google Scholar]
- Olson IR, Heide RJVD, Alm KH, & Vyas G (2015). Development of the uncinate fasciculus: Implications for theory and developmental disorders. Developmental Cognitive Neuroscience, 14, 50–61. 10.1016/j.dcn.2015.06.003 [DOI] [PMC free article] [PubMed] [Google Scholar]
- Ongür D, & Price JL (2000). The organization of networks within the orbital and medial prefrontal cortex of rats, monkeys and humans. Cerebral Cortex (New York, N.Y.: 1991), 10(3), 206–219. [DOI] [PubMed] [Google Scholar]
- Ongür Dost, Ferry AT, & Price JL (2003). Architectonic subdivision of the human orbital and medial prefrontal cortex. The Journal of Comparative Neurology, 460(3), 425–449. 10.1002/cne.10609 [DOI] [PubMed] [Google Scholar]
- Pedregosa F, Varoquaux G, Gramfort A, Michel V, Thirion B, Grisel O, … Dubourg V (2011). Scikit-learn: Machine learning in Python. Journal of Machine Learning Research, 12(Oct), 2825–2830. [Google Scholar]
- Peña EA, & Slate EH (2006). Global Validation of Linear Model Assumptions. Journal of the American Statistical Association, 101(473), 341 10.1198/016214505000000637 [DOI] [PMC free article] [PubMed] [Google Scholar]
- Petersen AC, Crockett L, Richards M, & Boxer A (1988). A self-report measure of pubertal status: Reliability, validity, and initial norms. Journal of Youth and Adolescence, 17(2), 117–133. 10.1007/BF01537962 [DOI] [PubMed] [Google Scholar]
- Phillips M, Ladouceur C, & Drevets W (2008). A neural model of voluntary and automatic emotion regulation: implications for understanding the pathophysiology and neurodevelopment of bipolar disorder. Molecular Psychiatry, 13(9), 829–857. 10.1038/mp.2008.65 [DOI] [PMC free article] [PubMed] [Google Scholar]
- Price JL (2006). Connections of the Orbital Cortex In Zald DH & Rauch SL (Eds.), Orbitofrontal Cortex. Oxford, UK: Oxford University Press. [Google Scholar]
- Quirk GJ, & Beer JS (2006). Prefrontal involvement in the regulation of emotion: convergence of rat and human studies. Current Opinion in Neurobiology, 16(6), 723–727. 10.1016/j.conb.2006.07.004 [DOI] [PubMed] [Google Scholar]
- Ray R, & Zald DH (2012). Anatomical insights into the interaction of emotion and cognition in the prefrontal cortex. Neuroscience and Biobehavioral Reviews, 36(1), 479–501. 10.1016/j.neubiorev.2011.08.005 [DOI] [PMC free article] [PubMed] [Google Scholar]
- Reichman NE, Teitler JO, Garfinkel I, & McLanahan SS (2001). Fragile Families: sample and design. Children and Youth Services Review, 23(4), 303–326. 10.1016/S0190-7409(01)00141-4 [DOI] [Google Scholar]
- Schwartz CE, Wright CI, Shin LM, Kagan J, & Rauch SL (2003). Inhibited and Uninhibited Infants “Grown Up”: Adult Amygdalar Response to Novelty. Science, 300(5627), 1952–1953. 10.1126/science.1083703 [DOI] [PubMed] [Google Scholar]
- Silvers JA, Insel C, Powers A, Franz P, Helion C, Martin R, … Ochsner KN (2017). The transition from childhood to adolescence is marked by a general decrease in amygdala reactivity and an affect-specific ventral-to-dorsal shift in medial prefrontal recruitment. Developmental Cognitive Neuroscience, 25, 128–137. 10.1016/j.dcn.2016.06.005 [DOI] [PMC free article] [PubMed] [Google Scholar]
- Smith SM (2002). Fast robust automated brain extraction. Human Brain Mapping, 17(3), 143–155. [DOI] [PMC free article] [PubMed] [Google Scholar]
- Somerville LH, Kim H, Johnstone T, Alexander AL, & Whalen PJ (2004). Human amygdala responses during presentation of happy and neutral faces: correlations with state anxiety. Biological Psychiatry, 55(9), 897–903. 10.1016/j.biopsych.2004.01.007 [DOI] [PubMed] [Google Scholar]
- Stefanacci L, & Amaral DG (2002). Some observations on cortical inputs to the macaque monkey amygdala: an anterograde tracing study. The Journal of Comparative Neurology, 451(4), 301–323. 10.1002/cne.10339 [DOI] [PubMed] [Google Scholar]
- Swartz JR, Carrasco M, Wiggins JL, Thomason ME, & Monk CS (2014). Age-related changes in the structure and function of prefrontal cortex-amygdala circuitry in children and adolescents: a multi-modal imaging approach. NeuroImage, 86, 212–220. 10.1016/j.neuroimage.2013.08.018 [DOI] [PMC free article] [PubMed] [Google Scholar]
- Tahmasebi AM, Artiges E, Banaschewski T, Barker GJ, Bruehl R, Buchel C, … Paus T (2012). Creating probabilistic maps of the face network in the adolescent brain: A multicentre functional MRI study. Human Brain Mapping, 33(4), 938–957. 10.1002/hbm.21261 [DOI] [PMC free article] [PubMed] [Google Scholar]
- Tottenham N, Tanaka JW, Leon AC, McCarry T, Nurse M, Hare TA, … Nelson C (2009). The NimStim set of facial expressions: judgments from untrained research participants. Psychiatry Research, 168(3), 242–249. 10.1016/j.psychres.2008.05.006 [DOI] [PMC free article] [PubMed] [Google Scholar]
- van den Bulk BG, Koolschijn PCMP, Meens PHF, van Lang NDJ, van der Wee NJA, Rombouts SARB, … Crone EA (2013). How stable is activation in the amygdala and prefrontal cortex in adolescence? A study of emotional face processing across three measurements. Developmental Cognitive Neuroscience, 4, 65–76. 10.1016/j.dcn.2012.09.005 [DOI] [PMC free article] [PubMed] [Google Scholar]
- Von Der Heide RJ, Skipper LM, Klobusicky E, & Olson IR (2013). Dissecting the uncinate fasciculus: disorders, controversies and a hypothesis. Brain, 136(6), 1692–1707. 10.1093/brain/awt094 [DOI] [PMC free article] [PubMed] [Google Scholar]
- Yang TT, Simmons AN, Matthews SC, Tapert SF, Frank GK, Max JE, … Paulus MP (2010). Adolescents With Major Depression Demonstrate Increased Amygdala Activation. Journal of the American Academy of Child and Adolescent Psychiatry, 49(1), 42–51. [DOI] [PMC free article] [PubMed] [Google Scholar]
- Yeatman JD, Wandell BA, & Mezer AA (2014). Lifespan maturation and degeneration of human brain white matter. Nature Communications, 5, 4932 10.1038/ncomms5932 [DOI] [PMC free article] [PubMed] [Google Scholar]