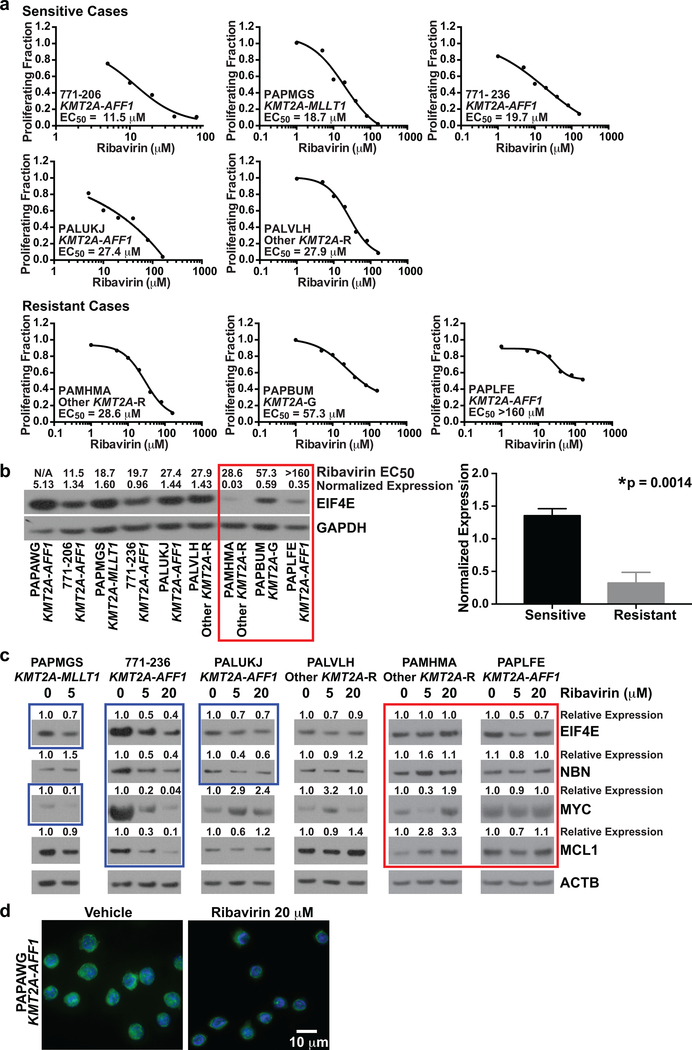
Figure 4. Dependencies of ribavirin response and EIF4E target modulation in infant ALL cells on basal EIF4E expression.
(a) Proliferating fractions plotted as inhibitory sigmoid Emax models to estimate ribavirin EC50s in 8 of 9 cases with sufficient material for ribavirin treatment at multiple concentrations (c.f. Figure 3b, all cases except PAPAWG). An EC50 cut-off of <28 μM, based on clinical Cmax in adult AML trial, was used to define sensitivity.
(b) Western blot analysis of primary infant ALL samples from cases in Figure 3 showing correlation between ribavirin response and basal eIF4E expression (left). Ribavirin EC50s are above the lanes for all samples where determined. N/A indicates EC50 not determined because material was not available (Case PAPAWG). EIF4E levels normalized to GAPDH are shown at top of blot. Note greater ribavirin sensitivity (lower EC50s) in samples with higher EIF4E expression. Red box indicates resistant cases. Experiment was performed once due to sample limitations. Normalized EIF4E levels in sensitive vs. resistant cases in the Western blot are compared in bar graph (right). Bars represent standard error. Note significantly higher EIF4E levels in ribavirin-sensitive than ribavirin-resistant cases.
(c) Western blot analysis showing abrogation of expression of MYC, MCL1 and/or NBN target proteins in EIF4E regulon by ribavirin treatment of infant ALL cells at clinically relevant concentrations. Note the greater protein reductions in the sensitive cases, which also show more abundant basal EIF4E expression. Band intensities normalized to ATCB and then made relative to vehicle for each protein are shown at top of blots. Blue boxes show decreased proteins after ribavirin treatment in the sensitive cases. Also note decreases in EIF4E in sensitive cases indicated by blue boxes. Red box indicates lack of consistent protein down-regulation by ribavirin treatment in resistant cases. Experiment was performed once due to sample limitations.
(d) Re-localization of nuclear EIF4E to the cytoplasm in ribavirin-treated infant ALL cells. The cells are splenocytes from secondary xenografts expanded in NSG mice created from Case PAPAWG. The primary cells responded to single-agent ribavirin on BMSCs (Figure 3b, top). The cells were treated for 72 h with vehicle or ribavirin at 20 μM. DAPI-labeled DNA in nucleus is blue; EIF4E labeled with anti-EIF4E-FITC is green. Image shows change in EIF4E nuclear localization to the cytoplasm in most cells in the field after ribavirin treatment compared to the nuclear localization of EIF4E in vehicle-treated cells. Experiment was performed once, but same result was seen in RS4:11 cell line (c.f. Figure 5g).

